Iron and Steel Market Analysis APAC, Europe, North America, Middle East and Africa, South America - US, China, India, Japan, Russia - Size and Forecast 2024-2028

Iron and Steel Market Analysis APAC, Europe, North America, Middle East and Africa, South America - US, China, India, Japan, Russia - Size and Forecast 2024-2028

Published: May 2024 168 Pages SKU: IRTNTR77719

Market Overview at a Glance

$478.1 B
Market Opportunity
5.65%
CAGR
4.88
YoY growth 2023-2024(%)

Iron and Steel Market Size 2024-2028

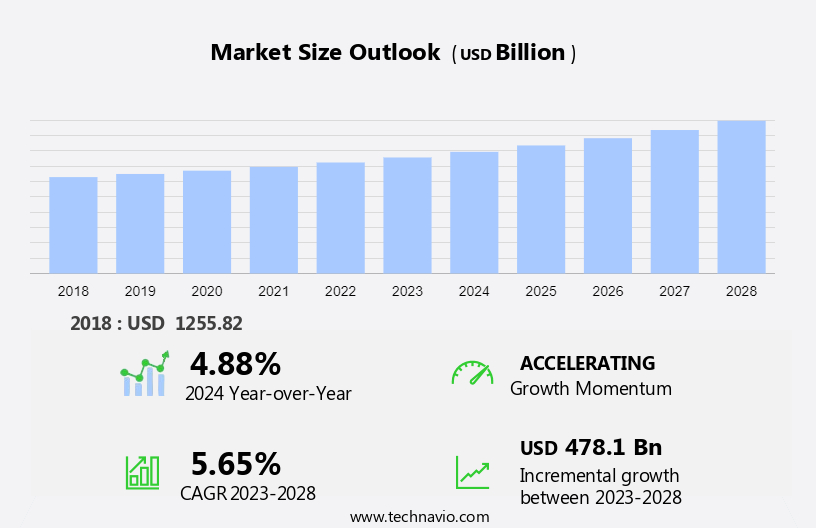
The iron and steel market size is forecast to increase by USD 478.1 billion, at a CAGR of 5.65% between 2023 and 2028.

  • The market is experiencing significant growth, driven by the increasing consumption of high-strength stainless steel. This trend is fueled by the expanding infrastructure sector, particularly in emerging economies, and the growing demand for stainless steel in various end-use industries such as construction, automotive, and packaging. Furthermore, the rising popularity of stainless steel scrap as a cost-effective alternative to primary steel production is contributing to market expansion. However, the market faces challenges as well. Carbon fiber is increasingly gaining traction in the automotive industry, posing a threat to the demand for steel and stainless steel.
  • This shift is due to the lightweight and high-strength properties of carbon fiber, making it an attractive alternative for manufacturers seeking to reduce vehicle weight and improve fuel efficiency. Companies in the iron and steel industry must adapt to this trend by focusing on innovation and developing new applications for steel and stainless steel that offer superior performance or cost advantages over carbon fiber. Additionally, ensuring sustainable production methods and addressing environmental concerns will be crucial in maintaining market competitiveness and addressing regulatory pressures.

What will be the Size of the Iron and Steel Market during the forecast period?

Iron and Steel Market Size

Explore in-depth regional segment analysis with market size data - historical 2018-2022 and forecasts 2024-2028 - in the full report.  
Request Free Sample

The market continues to evolve, driven by advancements in steel production technologies and the diverse applications of various steel types across numerous sectors. High-strength low-alloy steel, for instance, is increasingly sought after for its enhanced yield strength and hardness, making it suitable for use in automotive and construction industries. Impact testing and hardness testing are crucial in ensuring the quality and durability of these high-performance steels. Stainless steel, with its excellent corrosion resistance, is another key player in the market. The production of stainless steel involves processes such as pig iron production, coke making, and sintering, followed by electric arc furnace melting and continuous casting.

The industry anticipates a steady growth of around 4% annually, fueled by increasing demand from sectors like aerospace and healthcare. An example of this market's continuous dynamism can be seen in the implementation of advanced high-strength steel in the automotive industry. A major automaker reported a 15% increase in fuel efficiency by using this steel in vehicle production. The steel's superior properties, such as increased tensile strength and fatigue resistance, contribute to the overall improvement in vehicle performance and sustainability. Quality control systems, steel scrap recycling, and steel microstructure analysis are essential components of the steel manufacturing process.

They ensure the consistent production of steel grades that meet specific customer requirements. The integration of coating lines and galvanizing lines further enhances the versatility of steel products. Alloy steel and carbon steel undergo various processes, including blast furnace operation, basic oxygen furnace, hot rolling mill, and cold rolling mill, to achieve their desired properties. Heat treatment and pickling line processes further refine these steels for specific applications. The ongoing innovation in steelmaking technologies, such as secondary steelmaking and yield optimization techniques, continues to shape the market landscape.

How is this Iron and Steel Industry segmented?

The iron and steel industry research report provides comprehensive data (region-wise segment analysis), with forecasts and estimates in "USD billion" for the period 2024-2028, as well as historical data from 2018-2022 for the following segments.

  • End-user
    • Construction
    • Machinery
    • Transportation
    • Metal goods
    • Others
  • Type
    • Steel
    • Iron
  • Geography
    • North America
      • US
    • Europe
      • Russia
    • APAC
      • China
      • India
      • Japan
    • Rest of World (ROW)

By End-user Insights

The construction segment is estimated to witness significant growth during the forecast period.

The market is a critical sector in the construction industry, supplying essential components for structural integrity, durability, and versatility. High-strength low-alloy steel, for instance, undergoes impact testing and hardness testing to ensure its robustness in various applications. Stainless steel, another key player, offers corrosion resistance and is extensively used in galvanizing lines and coating lines. Pig iron production and coke making are fundamental processes in steelmaking, while advanced high-strength steel is gaining popularity due to its enhanced properties. The steel industry anticipates significant growth, with expectations of a 5% increase in production by 2025. Carbon steel, produced via blast furnaces and basic oxygen furnaces, forms the backbone of the industry.

Steel scrap recycling plays a significant role in reducing production costs and minimizing environmental impact. Continuous casting, secondary steelmaking, and heat treatment are crucial processes in steel production, ensuring the desired microstructure and tensile strength. An example of steel's impact on the construction industry is the use of structural steel in the iconic Millennium Bridge in London. This bridge, with its distinctive tilting mechanism, required high-strength steel to maintain its unique design and functionality. With ongoing advancements in steel technology, the industry continues to evolve, offering innovative solutions for various applications.

Iron and Steel Market Size

Request Free Sample

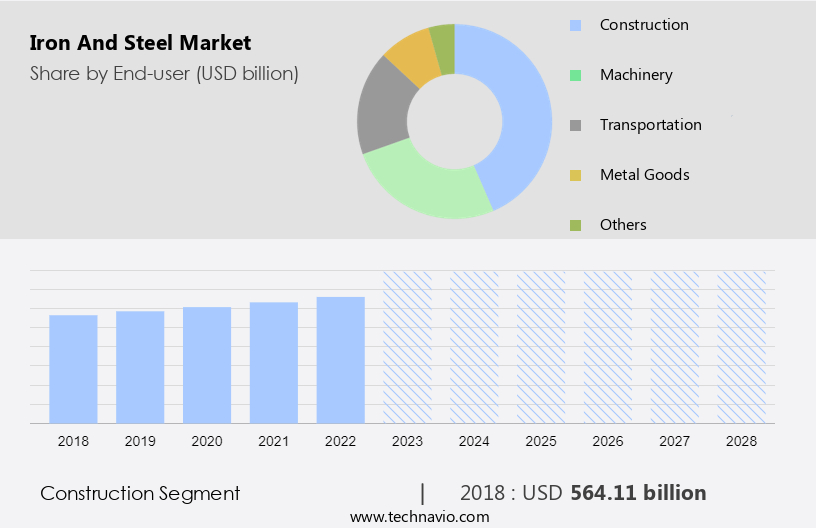
The Construction segment was valued at USD 564.11 billion in 2018 and showed a gradual increase during the forecast period.

Regional Analysis

APAC is estimated to contribute 75% to the growth of the global market during the forecast period.Technavio's analysts have elaborately explained the regional trends and drivers that shape the market during the forecast period.

Iron and Steel Market Share by Geography

 Request Free Sample

The market is experiencing significant growth, particularly in the Asia Pacific region. The construction industry's expansion, driven by the aging infrastructure and rising demand, is a major factor fueling this growth. In the energy sector, the continuous increase in oil production and drilling activities is leading to increased demand for iron and steel in the manufacturing of pipes and tubes. Additionally, the automotive and construction industries' growth is boosting market demand. However, the market's expansion is being challenged by fluctuations in oil prices and the shortage of iron and steel-based pipes and tubes. The iron and steel industry's production processes include pig iron production through the blast furnace, coke making, and the sintering process.

Advanced high-strength steel production involves electric arc furnaces, continuous casting, secondary steelmaking, and heat treatment. Quality control systems ensure the production of steel with specific properties, such as yield strength, tensile strength, and hardness. Stainless steel, an alloy steel with excellent corrosion resistance, is a significant market segment. The galvanizing line and coating line are used to protect steel from corrosion. Steel scrap recycling plays a crucial role in the iron and steel industry's sustainability efforts. According to recent industry reports, The market is expected to grow at a steady rate, with APAC accounting for over 50% of the global production.

For instance, China, the world's largest steel producer, produced approximately 1.2 billion metric tons of steel in 2020. The market's growth is attributed to the increasing demand for steel in various industries, including construction, automotive, and energy.

Market Dynamics

Our researchers analyzed the data with 2023 as the base year, along with the key drivers, trends, and challenges. A holistic analysis of drivers will help companies refine their marketing strategies to gain a competitive advantage.

The market is a dynamic and complex industry, characterized by continuous innovation and advancements in steel production technologies. High-strength low-alloy steels (HSLA) have gained significant traction in various applications due to their enhanced properties, including improved tensile strength and weldability. In the realm of advanced high-strength steels (AHSS), corrosion resistance mechanisms in stainless steel are of paramount importance, ensuring longevity in harsh environments. To optimize electric arc furnace (EAF) power consumption, producers employ sophisticated process control strategies. Similarly, the basic oxygen furnace (BOF) process benefits from refined control systems to maintain consistent steel quality. Continuous casting mold flux optimization and hot rolling mill automation system design are essential to ensure efficient production and superior product quality. Cold rolling mills focus on surface finish improvement, while galvanizing lines require precise coating thickness control to meet customer specifications. Steel microstructure characterization techniques, such as X-ray diffraction and electron microscopy, provide valuable insights into the mechanical properties of various steel grades. Heat treatment effects on mechanical properties are crucial, with careful consideration given to factors such as temperature, time, and quenching rate. Iron ore beneficiation process optimization and coke making quality control measures are essential to maintain a steady supply of raw materials for steel production. Steel scrap recycling process efficiency is another critical aspect, with innovative solutions being developed to maximize the utilization of recycled materials. The steel grade classification system's effectiveness is vital for ensuring consistent product quality and customer satisfaction. Overall, the market continues to evolve, driven by technological advancements and the relentless pursuit of improved efficiency and sustainability.

What are the key market drivers leading to the rise in the adoption of Iron and Steel Industry?

  • The significant increase in the demand for high-strength stainless steel is the primary factor fueling market growth. 
  • The demand for high-strength stainless steel continues to escalate due to its superior properties, including high strength at both normal and elevated temperatures. This material offers enhanced fatigue strength and toughness, making it an ideal choice for architectural, industrial, and consumer applications. The rising preference for high-strength stainless steel is attributed to its cost-effectiveness and favorable strength-to-weight ratio. Strategic positioning and diverse product offerings are key factors driving sales growth in this market. For instance, high-strength stainless steel has demonstrated a 5% annual increase in demand from the automotive sector due to its high strain-hardening ability and excellent balance of ductility and strength.
  • The global high-strength stainless steel market is projected to expand at a robust pace, with industry growth anticipated to reach 7% per annum.

What are the market trends shaping the Iron and Steel Industry?

  • The increasing demand for steel and stainless steel scrap represents a notable market trend. Two distinct market trends emerge: a rising demand for steel and stainless steel scrap.
  • The market is driven by the increasing demand for sustainable and eco-friendly manufacturing processes. The recycling of scrap steel and stainless steel is a significant trend in the industry, contributing to both economic growth and environmental sustainability. Steel's unique circularity properties enable it to be recycled repeatedly without losing its original properties. This reduces the need for primary iron ore extraction, leading to substantial CO2 emissions reduction, energy savings, and water conservation. According to recent studies, steel scrap recycling currently accounts for approximately 30% of the total steel production.
  • Looking ahead, the market is expected to grow by 15% in the next five years, driven by the increasing focus on reducing carbon footprints and the rising demand for sustainable manufacturing practices.

What challenges does the Iron and Steel Industry face during its growth?

  • The increasing adoption of carbon fiber in place of stainless steel in automotive applications poses a significant challenge to the industry's growth trajectory. 
  • The global automotive industry is experiencing a significant shift towards fuel-efficient vehicles due to the volatility of fuel prices. Stainless steel, with its high mechanical strength and corrosion resistance, is widely used in automotive applications. However, the high weight and cost associated with stainless steel pose challenges for automotive manufacturers. In response to this, there is a growing trend towards the use of lightweight materials, such as carbon fiber composites, to reduce vehicle weight and enhance fuel efficiency. For instance, the incorporation of carbon fiber composites can result in a 40-50% reduction in vehicle weight and a 30-35% improvement in fuel efficiency.
  • As the demand for lightweight and fuel-efficient automobiles continues to rise, the use of carbon fiber composites is expected to increase at a substantial rate in the coming years. Industry analysts forecast that the global carbon fiber composites market for automotive applications will grow by over 15% annually through 2025.

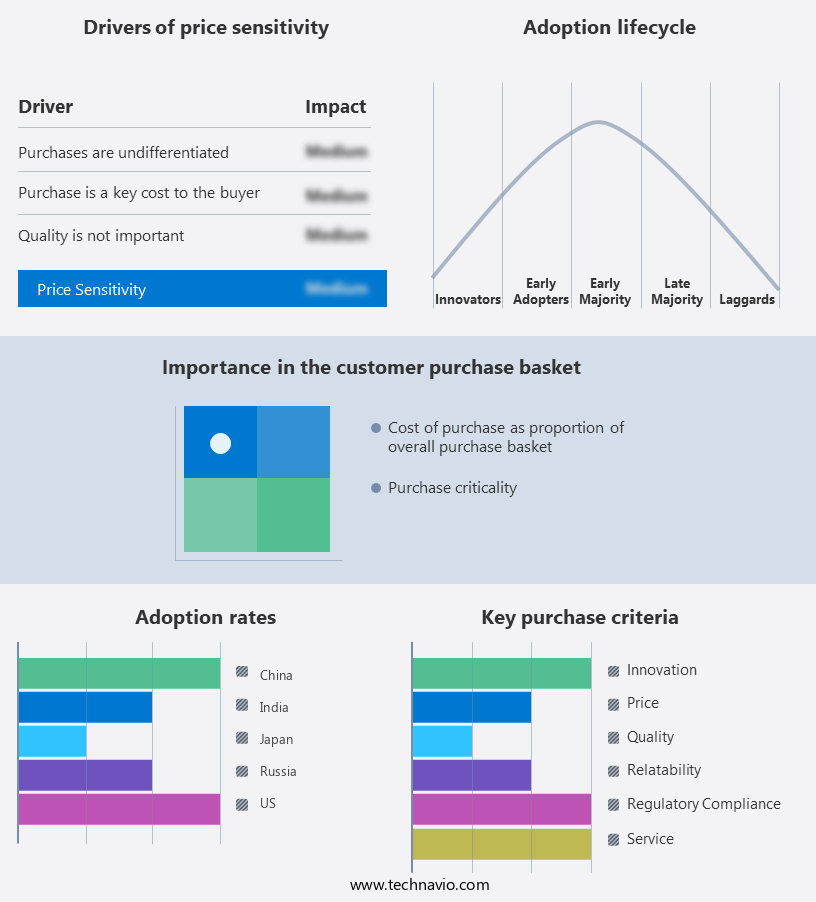
Exclusive Customer Landscape

The iron and steel market forecasting report includes the adoption lifecycle of the market, covering from the innovator's stage to the laggard's stage. It focuses on adoption rates in different regions based on penetration. Furthermore, the iron and steel market report also includes key purchase criteria and drivers of price sensitivity to help companies evaluate and develop their market growth analysis strategies.

Iron and Steel Market Share by Geography

 Customer Landscape

Key Companies & Market Insights

Companies are implementing various strategies, such as strategic alliances, iron and steel market forecast, partnerships, mergers and acquisitions, geographical expansion, and product/service launches, to enhance their presence in the industry.

Ansteel Group Corp. Ltd. - The Anshan Iron and Steel Group division specializes in producing and supplying a range of iron and steel products, including bridge steel, automotive steel, railway steel, and building steel, catering to various industries worldwide.

The industry research and growth report includes detailed analyses of the competitive landscape of the market and information about key companies, including:

  • Ansteel Group Corp. Ltd.
  • ArcelorMittal
  • China BaoWu Steel Group Corp. Ltd.
  • Cleveland Cliffs Inc.
  • EVRAZ Plc
  • HBIS Group Co. Ltd.
  • Hitachi Ltd.
  • Hyundai Steel Co.
  • JFE Holdings Inc.
  • Jiangsu Shagang International Trade Co. Ltd.
  • JSW Group
  • Nippon Steel Corp.
  • Nucor Corp.
  • Olympic Steel
  • POSCO holdings Inc.
  • Reliance Inc
  • Steel Authority of India Ltd.
  • Steelmor Industries
  • Sumitomo Electric Industries Ltd.
  • Tata Steel
  • Ternium
  • thyssenkrupp AG
  • TimkenSteel Corp.
  • Vale SA
  • Varma Steel
  • Voestalpine AG

Qualitative and quantitative analysis of companies has been conducted to help clients understand the wider business environment as well as the strengths and weaknesses of key industry players. Data is qualitatively analyzed to categorize companies as pure play, category-focused, industry-focused, and diversified; it is quantitatively analyzed to categorize companies as dominant, leading, strong, tentative, and weak.

Recent Development and News in Iron And Steel Market

  • In January 2024, ArcelorMittal, the world's leading steel and mining company, announced the launch of its new green steel production line in Europe, aiming to reduce carbon emissions by 65% using hydrogen-based direct reduced iron (HBI) technology. (ArcelorMittal Press Release)
  • In March 2024, Tata Steel and ThyssenKrupp Steel Europe signed a strategic partnership agreement to merge their European steel businesses, creating the second-largest steel producer in Europe. (Tata Steel Press Release)
  • In May 2025, Baosteel Group, China's largest steel producer, secured a significant regulatory approval from the Chinese Ministry of Commerce to build a new 10 million tonne per year greenfield steel mill in Mongolia, expanding its global footprint and increasing its market share in the Asia-Pacific region. (China Ministry of Commerce Press Release)
  • In April 2025, United States Steel Corporation (U.S. Steel) completed a USD750 million investment in its Gary Works facility in Indiana, expanding its electric arc furnace capacity by 1.5 million net tons annually and increasing its total annual steelmaking capacity to 13.5 million net tons. (U.S. Steel Press Release)

Research Analyst Overview

  • The market for iron and steel continues to evolve, driven by advancements in technology and the expanding applications across various sectors. Vacuum degassing and argon oxygen decarburization are critical processes in steel production, ensuring optimal mechanical properties and chemical composition. Quality assurance measures, such as magnetic particle testing, dye penetrant testing, and non-destructive testing, play a pivotal role in detecting surface defects and maintaining material traceability. Data analytics and process optimization are transforming the industry, enabling real-time monitoring and predictive maintenance. Emission control remains a significant concern, with steel producers investing in energy efficiency and waste management solutions to reduce their carbon footprint.
  • The industry anticipates a growth rate of over 5% in the coming years, driven by increasing demand from infrastructure, automotive, and construction sectors. For instance, a leading steel producer reported a 10% increase in sales due to improved production scheduling and inventory management. Automation systems, inclusion control, and metallurgical testing are other areas of focus, enhancing process control and ensuring consistent product quality.

Dive into Technavio's robust research methodology, blending expert interviews, extensive data synthesis, and validated models for unparalleled Iron and Steel Market insights. See full methodology.

Market Scope

Report Coverage

Details

Page number

168

Base year

2023

Historic period

2018-2022

Forecast period

2024-2028

Growth momentum & CAGR

Accelerate at a CAGR of 5.65%

Market growth 2024-2028

USD 478.1 billion

Market structure

Fragmented

YoY growth 2023-2024(%)

4.88

Key countries

US, China, India, Japan, and Russia

Competitive landscape

Leading Companies, Market Positioning of Companies, Competitive Strategies, and Industry Risks

Request Free Sample

What are the Key Data Covered in this Iron and Steel Market Research and Growth Report?

  • CAGR of the Iron and Steel industry during the forecast period
  • Detailed information on factors that will drive the growth and forecasting between 2024 and 2028
  • Precise estimation of the size of the market and its contribution of the industry in focus to the parent market
  • Accurate predictions about upcoming growth and trends and changes in consumer behaviour
  • Growth of the market across APAC, Europe, North America, Middle East and Africa, and South America
  • Thorough analysis of the market's competitive landscape and detailed information about companies
  • Comprehensive analysis of factors that will challenge the iron and steel market growth of industry companies

We can help! Our analysts can customize this iron and steel market research report to meet your requirements.

Get in touch

1 Executive Summary

  • 1.1 Market overview
    • Exhibit 01: Executive Summary – Chart on Market Overview
    • Exhibit 02: Executive Summary – Data Table on Market Overview
    • Exhibit 03: Executive Summary – Chart on Global Market Characteristics
    • Exhibit 04: Executive Summary – Chart on Market by Geography
    • Exhibit 05: Executive Summary – Chart on Market Segmentation by End-user
    • Exhibit 06: Executive Summary – Chart on Market Segmentation by Type
    • Exhibit 07: Executive Summary – Chart on Incremental Growth
    • Exhibit 08: Executive Summary – Data Table on Incremental Growth
    • Exhibit 09: Executive Summary – Chart on Vendor Market Positioning

2 Market Landscape

  • 2.1 Market ecosystem
    • Exhibit 10: Parent market
    • Exhibit 11: Market Characteristics

3 Market Sizing

  • 3.1 Market definition
    • Exhibit 12: Offerings of vendors included in the market definition
  • 3.2 Market segment analysis
    • Exhibit 13: Market segments
  • 3.3 Market size 2023
    • 3.4 Market outlook: Forecast for 2023-2028
      • Exhibit 14: Chart on Global - Market size and forecast 2023-2028 ($ billion)
      • Exhibit 15: Data Table on Global - Market size and forecast 2023-2028 ($ billion)
      • Exhibit 16: Chart on Global Market: Year-over-year growth 2023-2028 (%)
      • Exhibit 17: Data Table on Global Market: Year-over-year growth 2023-2028 (%)

    4 Historic Market Size

    • 4.1 Global iron and steel market 2018 - 2022
      • Exhibit 18: Historic Market Size – Data Table on global iron and steel market 2018 - 2022 ($ billion)
    • 4.2 End-user Segment Analysis 2018 - 2022
      • Exhibit 19: Historic Market Size – End-user Segment 2018 - 2022 ($ billion)
    • 4.3 Type Segment Analysis 2018 - 2022
      • Exhibit 20: Historic Market Size – Type Segment 2018 - 2022 ($ billion)
    • 4.4 Geography Segment Analysis 2018 - 2022
      • Exhibit 21: Historic Market Size – Geography Segment 2018 - 2022 ($ billion)
    • 4.5 Country Segment Analysis 2018 - 2022
      • Exhibit 22: Historic Market Size – Country Segment 2018 - 2022 ($ billion)

    5 Five Forces Analysis

    • 5.1 Five forces summary
      • Exhibit 23: Five forces analysis - Comparison between 2023 and 2028
    • 5.2 Bargaining power of buyers
      • Exhibit 24: Chart on Bargaining power of buyers – Impact of key factors 2023 and 2028
    • 5.3 Bargaining power of suppliers
      • Exhibit 25: Bargaining power of suppliers – Impact of key factors in 2023 and 2028
    • 5.4 Threat of new entrants
      • Exhibit 26: Threat of new entrants – Impact of key factors in 2023 and 2028
    • 5.5 Threat of substitutes
      • Exhibit 27: Threat of substitutes – Impact of key factors in 2023 and 2028
    • 5.6 Threat of rivalry
      • Exhibit 28: Threat of rivalry – Impact of key factors in 2023 and 2028
    • 5.7 Market condition
      • Exhibit 29: Chart on Market condition - Five forces 2023 and 2028

    6 Market Segmentation by End-user

    • 6.1 Market segments
      • Exhibit 30: Chart on End-user - Market share 2023-2028 (%)
      • Exhibit 31: Data Table on End-user - Market share 2023-2028 (%)
    • 6.2 Comparison by End-user
      • Exhibit 32: Chart on Comparison by End-user
      • Exhibit 33: Data Table on Comparison by End-user
    • 6.3 Construction - Market size and forecast 2023-2028
      • Exhibit 34: Chart on Construction - Market size and forecast 2023-2028 ($ billion)
      • Exhibit 35: Data Table on Construction - Market size and forecast 2023-2028 ($ billion)
      • Exhibit 36: Chart on Construction - Year-over-year growth 2023-2028 (%)
      • Exhibit 37: Data Table on Construction - Year-over-year growth 2023-2028 (%)
    • 6.4 Machinery - Market size and forecast 2023-2028
      • Exhibit 38: Chart on Machinery - Market size and forecast 2023-2028 ($ billion)
      • Exhibit 39: Data Table on Machinery - Market size and forecast 2023-2028 ($ billion)
      • Exhibit 40: Chart on Machinery - Year-over-year growth 2023-2028 (%)
      • Exhibit 41: Data Table on Machinery - Year-over-year growth 2023-2028 (%)
    • 6.5 Transportation - Market size and forecast 2023-2028
      • Exhibit 42: Chart on Transportation - Market size and forecast 2023-2028 ($ billion)
      • Exhibit 43: Data Table on Transportation - Market size and forecast 2023-2028 ($ billion)
      • Exhibit 44: Chart on Transportation - Year-over-year growth 2023-2028 (%)
      • Exhibit 45: Data Table on Transportation - Year-over-year growth 2023-2028 (%)
    • 6.6 Metal goods - Market size and forecast 2023-2028
      • Exhibit 46: Chart on Metal goods - Market size and forecast 2023-2028 ($ billion)
      • Exhibit 47: Data Table on Metal goods - Market size and forecast 2023-2028 ($ billion)
      • Exhibit 48: Chart on Metal goods - Year-over-year growth 2023-2028 (%)
      • Exhibit 49: Data Table on Metal goods - Year-over-year growth 2023-2028 (%)
    • 6.7 Others - Market size and forecast 2023-2028
      • Exhibit 50: Chart on Others - Market size and forecast 2023-2028 ($ billion)
      • Exhibit 51: Data Table on Others - Market size and forecast 2023-2028 ($ billion)
      • Exhibit 52: Chart on Others - Year-over-year growth 2023-2028 (%)
      • Exhibit 53: Data Table on Others - Year-over-year growth 2023-2028 (%)
    • 6.8 Market opportunity by End-user
      • Exhibit 54: Market opportunity by End-user ($ billion)
      • Exhibit 55: Data Table on Market opportunity by End-user ($ billion)

    7 Market Segmentation by Type

    • 7.1 Market segments
      • Exhibit 56: Chart on Type - Market share 2023-2028 (%)
      • Exhibit 57: Data Table on Type - Market share 2023-2028 (%)
    • 7.2 Comparison by Type
      • Exhibit 58: Chart on Comparison by Type
      • Exhibit 59: Data Table on Comparison by Type
    • 7.3 Steel - Market size and forecast 2023-2028
      • Exhibit 60: Chart on Steel - Market size and forecast 2023-2028 ($ billion)
      • Exhibit 61: Data Table on Steel - Market size and forecast 2023-2028 ($ billion)
      • Exhibit 62: Chart on Steel - Year-over-year growth 2023-2028 (%)
      • Exhibit 63: Data Table on Steel - Year-over-year growth 2023-2028 (%)
    • 7.4 Iron - Market size and forecast 2023-2028
      • Exhibit 64: Chart on Iron - Market size and forecast 2023-2028 ($ billion)
      • Exhibit 65: Data Table on Iron - Market size and forecast 2023-2028 ($ billion)
      • Exhibit 66: Chart on Iron - Year-over-year growth 2023-2028 (%)
      • Exhibit 67: Data Table on Iron - Year-over-year growth 2023-2028 (%)
    • 7.5 Market opportunity by Type
      • Exhibit 68: Market opportunity by Type ($ billion)
      • Exhibit 69: Data Table on Market opportunity by Type ($ billion)

    8 Customer Landscape

    • 8.1 Customer landscape overview
      • Exhibit 70: Analysis of price sensitivity, lifecycle, customer purchase basket, adoption rates, and purchase criteria

    9 Geographic Landscape

    • 9.1 Geographic segmentation
      • Exhibit 71: Chart on Market share by geography 2023-2028 (%)
      • Exhibit 72: Data Table on Market share by geography 2023-2028 (%)
    • 9.2 Geographic comparison
      • Exhibit 73: Chart on Geographic comparison
      • Exhibit 74: Data Table on Geographic comparison
    • 9.3 APAC - Market size and forecast 2023-2028
      • Exhibit 75: Chart on APAC - Market size and forecast 2023-2028 ($ billion)
      • Exhibit 76: Data Table on APAC - Market size and forecast 2023-2028 ($ billion)
      • Exhibit 77: Chart on APAC - Year-over-year growth 2023-2028 (%)
      • Exhibit 78: Data Table on APAC - Year-over-year growth 2023-2028 (%)
    • 9.4 Europe - Market size and forecast 2023-2028
      • Exhibit 79: Chart on Europe - Market size and forecast 2023-2028 ($ billion)
      • Exhibit 80: Data Table on Europe - Market size and forecast 2023-2028 ($ billion)
      • Exhibit 81: Chart on Europe - Year-over-year growth 2023-2028 (%)
      • Exhibit 82: Data Table on Europe - Year-over-year growth 2023-2028 (%)
    • 9.5 North America - Market size and forecast 2023-2028
      • Exhibit 83: Chart on North America - Market size and forecast 2023-2028 ($ billion)
      • Exhibit 84: Data Table on North America - Market size and forecast 2023-2028 ($ billion)
      • Exhibit 85: Chart on North America - Year-over-year growth 2023-2028 (%)
      • Exhibit 86: Data Table on North America - Year-over-year growth 2023-2028 (%)
    • 9.6 Middle East and Africa - Market size and forecast 2023-2028
      • Exhibit 87: Chart on Middle East and Africa - Market size and forecast 2023-2028 ($ billion)
      • Exhibit 88: Data Table on Middle East and Africa - Market size and forecast 2023-2028 ($ billion)
      • Exhibit 89: Chart on Middle East and Africa - Year-over-year growth 2023-2028 (%)
      • Exhibit 90: Data Table on Middle East and Africa - Year-over-year growth 2023-2028 (%)
    • 9.7 South America - Market size and forecast 2023-2028
      • Exhibit 91: Chart on South America - Market size and forecast 2023-2028 ($ billion)
      • Exhibit 92: Data Table on South America - Market size and forecast 2023-2028 ($ billion)
      • Exhibit 93: Chart on South America - Year-over-year growth 2023-2028 (%)
      • Exhibit 94: Data Table on South America - Year-over-year growth 2023-2028 (%)
    • 9.8 China - Market size and forecast 2023-2028
      • Exhibit 95: Chart on China - Market size and forecast 2023-2028 ($ billion)
      • Exhibit 96: Data Table on China - Market size and forecast 2023-2028 ($ billion)
      • Exhibit 97: Chart on China - Year-over-year growth 2023-2028 (%)
      • Exhibit 98: Data Table on China - Year-over-year growth 2023-2028 (%)
    • 9.9 India - Market size and forecast 2023-2028
      • Exhibit 99: Chart on India - Market size and forecast 2023-2028 ($ billion)
      • Exhibit 100: Data Table on India - Market size and forecast 2023-2028 ($ billion)
      • Exhibit 101: Chart on India - Year-over-year growth 2023-2028 (%)
      • Exhibit 102: Data Table on India - Year-over-year growth 2023-2028 (%)
    • 9.10 Japan - Market size and forecast 2023-2028
      • Exhibit 103: Chart on Japan - Market size and forecast 2023-2028 ($ billion)
      • Exhibit 104: Data Table on Japan - Market size and forecast 2023-2028 ($ billion)
      • Exhibit 105: Chart on Japan - Year-over-year growth 2023-2028 (%)
      • Exhibit 106: Data Table on Japan - Year-over-year growth 2023-2028 (%)
    • 9.11 US - Market size and forecast 2023-2028
      • Exhibit 107: Chart on US - Market size and forecast 2023-2028 ($ billion)
      • Exhibit 108: Data Table on US - Market size and forecast 2023-2028 ($ billion)
      • Exhibit 109: Chart on US - Year-over-year growth 2023-2028 (%)
      • Exhibit 110: Data Table on US - Year-over-year growth 2023-2028 (%)
    • 9.12 Russia - Market size and forecast 2023-2028
      • Exhibit 111: Chart on Russia - Market size and forecast 2023-2028 ($ billion)
      • Exhibit 112: Data Table on Russia - Market size and forecast 2023-2028 ($ billion)
      • Exhibit 113: Chart on Russia - Year-over-year growth 2023-2028 (%)
      • Exhibit 114: Data Table on Russia - Year-over-year growth 2023-2028 (%)
    • 9.13 Market opportunity by geography
      • Exhibit 115: Market opportunity by geography ($ billion)
      • Exhibit 116: Data Tables on Market opportunity by geography ($ billion)

    10 Drivers, Challenges, and Trends

    • 10.1 Market drivers
      • 10.2 Market challenges
        • 10.3 Impact of drivers and challenges
          • Exhibit 117: Impact of drivers and challenges in 2023 and 2028
        • 10.4 Market trends

          11 Vendor Landscape

          • 11.1 Overview
            • 11.2 Vendor landscape
              • Exhibit 118: Overview on Criticality of inputs and Factors of differentiation
            • 11.3 Landscape disruption
              • Exhibit 119: Overview on factors of disruption
            • 11.4 Industry risks
              • Exhibit 120: Impact of key risks on business

            12 Vendor Analysis

            • 12.1 Vendors covered
              • Exhibit 121: Vendors covered
            • 12.2 Market positioning of vendors
              • Exhibit 122: Matrix on vendor position and classification
            • 12.3 Ansteel Group Corp. Ltd.
              • Exhibit 123: Ansteel Group Corp. Ltd. - Overview
              • Exhibit 124: Ansteel Group Corp. Ltd. - Business segments
              • Exhibit 125: Ansteel Group Corp. Ltd. - Key offerings
              • Exhibit 126: Ansteel Group Corp. Ltd. - Segment focus
            • 12.4 ArcelorMittal
              • Exhibit 127: ArcelorMittal - Overview
              • Exhibit 128: ArcelorMittal - Business segments
              • Exhibit 129: ArcelorMittal - Key news
              • Exhibit 130: ArcelorMittal - Key offerings
              • Exhibit 131: ArcelorMittal - Segment focus
            • 12.5 China BaoWu Steel Group Corp. Ltd.
              • Exhibit 132: China BaoWu Steel Group Corp. Ltd. - Overview
              • Exhibit 133: China BaoWu Steel Group Corp. Ltd. - Product / Service
              • Exhibit 134: China BaoWu Steel Group Corp. Ltd. - Key offerings
            • 12.6 HBIS Group Co. Ltd.
              • Exhibit 135: HBIS Group Co. Ltd. - Overview
              • Exhibit 136: HBIS Group Co. Ltd. - Product / Service
              • Exhibit 137: HBIS Group Co. Ltd. - Key offerings
            • 12.7 JFE Holdings Inc.
              • Exhibit 138: JFE Holdings Inc. - Overview
              • Exhibit 139: JFE Holdings Inc. - Business segments
              • Exhibit 140: JFE Holdings Inc. - Key news
              • Exhibit 141: JFE Holdings Inc. - Key offerings
              • Exhibit 142: JFE Holdings Inc. - Segment focus
            • 12.8 JSW Group
              • Exhibit 143: JSW Group - Overview
              • Exhibit 144: JSW Group - Product / Service
              • Exhibit 145: JSW Group - Key offerings
            • 12.9 Nippon Steel Corp.
              • Exhibit 146: Nippon Steel Corp. - Overview
              • Exhibit 147: Nippon Steel Corp. - Business segments
              • Exhibit 148: Nippon Steel Corp. - Key offerings
              • Exhibit 149: Nippon Steel Corp. - Segment focus
            • 12.10 Nucor Corp.
              • Exhibit 150: Nucor Corp. - Overview
              • Exhibit 151: Nucor Corp. - Business segments
              • Exhibit 152: Nucor Corp. - Key news
              • Exhibit 153: Nucor Corp. - Key offerings
              • Exhibit 154: Nucor Corp. - Segment focus
            • 12.11 POSCO holdings Inc.
              • Exhibit 155: POSCO holdings Inc. - Overview
              • Exhibit 156: POSCO holdings Inc. - Product / Service
              • Exhibit 157: POSCO holdings Inc. - Key offerings
            • 12.12 Steel Authority of India Ltd.
              • Exhibit 158: Steel Authority of India Ltd. - Overview
              • Exhibit 159: Steel Authority of India Ltd. - Key offerings
            • 12.13 Sumitomo Electric Industries Ltd.
              • Exhibit 160: Sumitomo Electric Industries Ltd. - Overview
              • Exhibit 161: Sumitomo Electric Industries Ltd. - Business segments
              • Exhibit 162: Sumitomo Electric Industries Ltd. - Key news
              • Exhibit 163: Sumitomo Electric Industries Ltd. - Key offerings
              • Exhibit 164: Sumitomo Electric Industries Ltd. - Segment focus
            • 12.14 Tata Steel
              • Exhibit 165: Tata Steel - Overview
              • Exhibit 166: Tata Steel - Business segments
              • Exhibit 167: Tata Steel - Key news
              • Exhibit 168: Tata Steel - Key offerings
              • Exhibit 169: Tata Steel - Segment focus
            • 12.15 Ternium
              • Exhibit 170: Ternium - Overview
              • Exhibit 171: Ternium - Business segments
              • Exhibit 172: Ternium - Key offerings
              • Exhibit 173: Ternium - Segment focus
            • 12.16 thyssenkrupp AG
              • Exhibit 174: thyssenkrupp AG - Overview
              • Exhibit 175: thyssenkrupp AG - Business segments
              • Exhibit 176: thyssenkrupp AG - Key news
              • Exhibit 177: thyssenkrupp AG - Key offerings
              • Exhibit 178: thyssenkrupp AG - Segment focus
            • 12.17 Varma Steel
              • Exhibit 179: Varma Steel - Overview
              • Exhibit 180: Varma Steel - Product / Service
              • Exhibit 181: Varma Steel - Key offerings

            13 Appendix

            • 13.1 Scope of the report
              • 13.2 Inclusions and exclusions checklist
                • Exhibit 182: Inclusions checklist
                • Exhibit 183: Exclusions checklist
              • 13.3 Currency conversion rates for US$
                • Exhibit 184: Currency conversion rates for US$
              • 13.4 Research methodology
                • Exhibit 185: Research methodology
                • Exhibit 186: Validation techniques employed for market sizing
                • Exhibit 187: Information sources
              • 13.5 List of abbreviations
                • Exhibit 188: List of abbreviations

              Research Methodology

              Technavio presents a detailed picture of the market by way of study, synthesis, and summation of data from multiple sources. The analysts have presented the various facets of the market with a particular focus on identifying the key industry influencers. The data thus presented is comprehensive, reliable, and the result of extensive research, both primary and secondary.

              INFORMATION SOURCES

              Primary sources

              • Manufacturers and suppliers
              • Channel partners
              • Industry experts
              • Strategic decision makers

              Secondary sources

              • Industry journals and periodicals
              • Government data
              • Financial reports of key industry players
              • Historical data
              • Press releases

              DATA ANALYSIS

              Data Synthesis

              • Collation of data
              • Estimation of key figures
              • Analysis of derived insights

              Data Validation

              • Triangulation with data models
              • Reference against proprietary databases
              • Corroboration with industry experts

              REPORT WRITING

              Qualitative

              • Market drivers
              • Market challenges
              • Market trends
              • Five forces analysis

              Quantitative

              • Market size and forecast
              • Market segmentation
              • Geographical insights
              • Competitive landscape

              Interested in this report?

              Get your sample now to see our research methodology and insights!

              Download Now

              Frequently Asked Questions

              Iron and Steel market growth will increase by $ 478.1 bn during 2024-2028 .

              The Iron and Steel market is expected to grow at a CAGR of 5.65% during 2024-2028 .

              Iron and Steel market is segmented by End-user( Construction, Machinery, Transportation, Metal goods, Others) Type( Steel, Iron)

              Ansteel Group Corp. Ltd., ArcelorMittal, China BaoWu Steel Group Corp. Ltd., Cleveland Cliffs Inc., EVRAZ Plc, HBIS Group Co. Ltd., Hitachi Ltd., Hyundai Steel Co., JFE Holdings Inc., Jiangsu Shagang International Trade Co. Ltd., JSW Group, Nippon Steel Corp., Nucor Corp., Olympic Steel, POSCO holdings Inc., Reliance Inc, Steel Authority of India Ltd., Steelmor Industries, Sumitomo Electric Industries Ltd., Tata Steel, Ternium, thyssenkrupp AG, TimkenSteel Corp., Vale SA, Varma Steel, Voestalpine AG are a few of the key vendors in the Iron and Steel market.

              APAC will register the highest growth rate of 75% among the other regions. Therefore, the Iron and Steel market in APAC is expected to garner significant business opportunities for the vendors during the forecast period.

              US, China, India, Japan, Russia

              • Upsurge in consumption of high-strength stainless steelThe use of high-strength stainless steel has increased due to its high strength at both room and high temperatures. It provides increased fatigue strength and toughness to steel products. The use of high-strength stainless steel is increasing in architectural is the driving factor this market.
              • industrial is the driving factor this market.
              • and consumer applications. The increased use of high-strength stainless steel is due to its superior properties is the driving factor this market.
              • such as low cost and high strength-to-weight ratio. Strategic positioning and diversified product portfolios are two factors that will boost high-strength stainless steel sales during the forecast period. High-strength stainless steel has a high strain-hardening ability and provides an excellent balance of ductility and strength. High-strength stainless steel has several advantages is the driving factor this market.
              • including faster hardening rates is the driving factor this market.
              • high weldability is the driving factor this market.
              • increased malleability is the driving factor this market.
              • and a high ability to withstand stress. The increased demand for high-strength stainless steel is due to the increasing focus of the automotive industry on reducing vehicle weight while maintaining important criteria such as stiffness and crash performance. High-strength stainless steel meets the performance demands of the construction and automotive industries. In the automotive industry is the driving factor this market.
              • high-strength stainless steel is used for manufacturing passenger compartments as well as the crumple zone. It finds application in cross members is the driving factor this market.
              • beams is the driving factor this market.
              • and other structural components of vehicles. The demand for stainless steel in automotive industries to develop environment-friendly vehicles is increasing the use of high-strength stainless steel is the driving factor this market.
              • which will thereby drive the growth of the global iron and steel market during the forecast period. is the driving factor this market.

              The Iron and Steel market vendors should focus on grabbing business opportunities from the Construction segment as it accounted for the largest market share in the base year.