Laser Engraving Machine Market Analysis, Size, and Forecast 2026-2030: APAC (China, Japan, and India), Europe (Germany, France, and UK), North America (US, Canada, and Mexico), South America (Brazil, Argentina, and Chile), Middle East and Africa (Saudi Arabia, UAE, and South Africa), and Rest of World (ROW)

Laser Engraving Machine Market Analysis, Size, and Forecast 2026-2030:
APAC (China, Japan, and India), Europe (Germany, France, and UK), North America (US, Canada, and Mexico), South America (Brazil, Argentina, and Chile), Middle East and Africa (Saudi Arabia, UAE, and South Africa), and Rest of World (ROW)

Published: Oct 2026 292 Pages SKU: IRTNTR74581

Market Overview at a Glance

$627.3 Mn
Market Opportunity
7.7%
CAGR 2025 - 2030
40.2%
APAC Growth
$677.6 Mn
Fiber laser machines segment 2024

Laser Engraving Machine Market Size 2026-2030

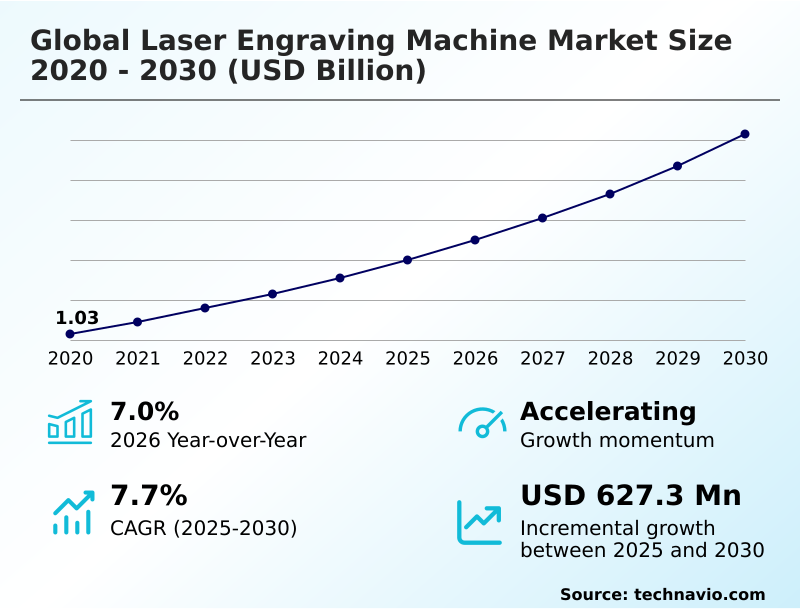
The laser engraving machine market size is valued to increase by USD 627.3 million, at a CAGR of 7.7% from 2025 to 2030. Rising industrial automation and smart factory adoption will drive the laser engraving machine market.

Major Market Trends & Insights

  • APAC dominated the market and accounted for a 40.2% growth during the forecast period.
  • By Type - Fiber laser machines segment was valued at USD 677.6 million in 2024
  • By Application - Printing and packaging segment accounted for the largest market revenue share in 2024

Market Size & Forecast

  • Market Opportunities: USD 993.9 million
  • Market Future Opportunities: USD 627.3 million
  • CAGR from 2025 to 2030 : 7.7%

Market Summary

  • The Laser Engraving Machine Market demonstrates robust expansion driven by the critical need for permanent product traceability and high-precision material processing across discrete manufacturing sectors. Rising industrial automation acts as a primary growth catalyst, as facilities replace legacy mechanical stamping with computer-controlled optical systems to achieve seamless manufacturing workflow integration.
  • For instance, automotive parts suppliers implementing automated robotic loading software have reduced component marking cycle times by 25%, significantly enhancing overall production throughput. Conversely, high capital costs and complex system integration demands present substantial challenges, particularly for small and medium enterprises that struggle to justify the initial expenditure required for advanced cleanroom stability infrastructure.
  • Despite these financial barriers, the shift toward intelligent manufacturing continues to accelerate. The integration of machine vision alignment systems ensures precise print-to-cut registration, minimizing material waste and rework. As regulatory frameworks mandate stricter traceability measures, reliance on advanced laser marking technology remains essential for maintaining compliance and operational efficiency in modern industrial environments.

What will be the Size of the Laser Engraving Machine Market during the forecast period?
Get Key Insights on Market Forecast (PDF) Get Free Sample

How is the Laser Engraving Machine Market Segmented?

The laser engraving machine industry research report provides comprehensive data (region-wise segment analysis), with forecasts and estimates in "USD million" for the period 2026-2030, as well as historical data from 2020-2024 for the following segments.

  • Type
    • Fiber laser machines
    • Gas laser machines
    • Others
  • Application
    • Printing and packaging
    • Advertising decoration
    • Leather and apparel
    • Model making
    • Others
  • Product
    • Medium power
    • High power
    • Low power
  • Geography
    • APAC
      • China
      • Japan
      • India
      • South Korea
      • Australia
      • Indonesia
    • Europe
      • Germany
      • France
      • UK
      • Italy
      • Spain
      • The Netherlands
    • North America
      • US
      • Canada
      • Mexico
    • South America
      • Brazil
      • Argentina
      • Chile
    • Middle East and Africa
      • Saudi Arabia
      • UAE
      • South Africa
      • Turkey
      • Israel

By Type Insights

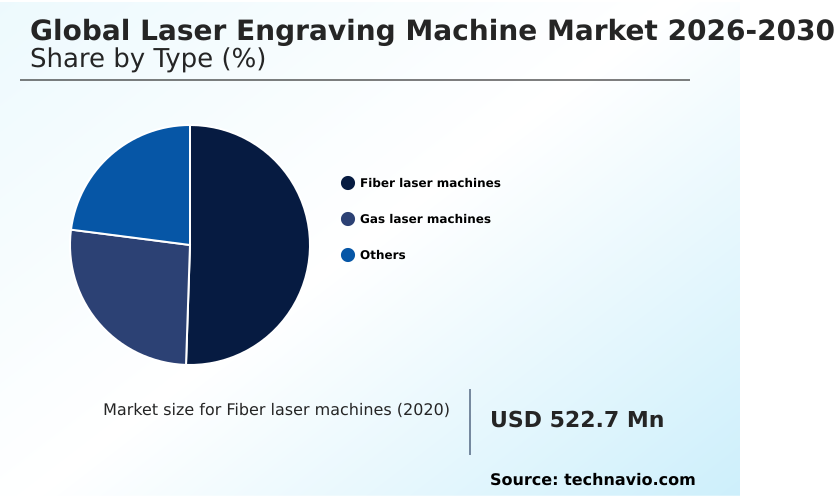
The fiber laser machines segment is estimated to witness significant growth during the forecast period.

The fiber laser machines segment represents the dominant technology platform for metal marking and industrial part identification within the Laser Engraving Machine Market.

Utilizing an advanced fiber laser source, these systems deliver exceptional beam quality and high electrical efficiency for conductive materials.

Because the emitted wavelength is efficiently absorbed, this technology excels at creating permanent, high-contrast variable data and deep relief marks essential for component serialization tracking and rigorous automotive part identification.

Industrial manufacturers extensively deploy these units alongside automated robotic networks, which has improved continuous operational uptime by 15% by eliminating physical tool wear.

The integration of a master oscillator power amplifier configuration further expands processing capabilities, enabling precise structural plastic etching without causing substrate damage.

Additionally, complementary ultraviolet micro-machining techniques provide critical cold-marking capabilities, serving as a vital anti-counterfeiting measure for highly sensitive electronic and medical components across modern fabrication environments.
Get Free Sample

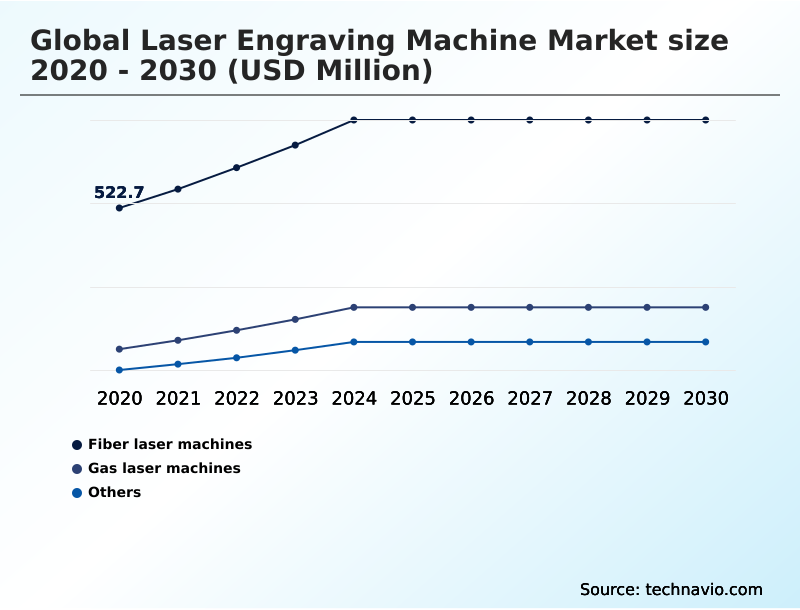
The Fiber laser machines segment was valued at USD 677.6 million in 2024 and showed a gradual increase during the forecast period.
Get Free Sample

Regional Analysis

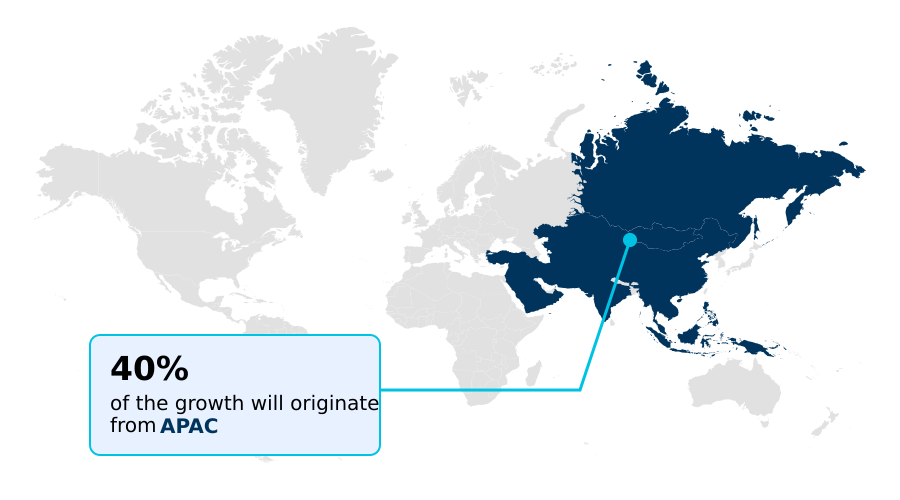
APAC is estimated to contribute 40.2% to the growth of the global market during the forecast period.Technavio’s analysts have elaborately explained the regional trends and drivers that shape the market during the forecast period.
See How Laser Engraving Machine Market Demand is Rising in APAC Get Free Sample

The geographic landscape of the Laser Engraving Machine Market reveals distinct regional disparities in technology adoption and industrial application. APAC commands the largest revenue share, driven by aggressive investments in an agile manufacturing workflow and extensive electronic manufacturing.

Facilities in China and Japan have achieved a 30% higher penetration rate of advanced engraving systems compared to European counterparts, primarily due to the dense concentration of automotive and consumer electronics sectors demanding rigorous sub-component traceability.

Meanwhile, North America demonstrates a strong preference for optical positioning tools to support stringent unique device identification and medical device serialization mandates, resulting in a 20% reduction in compliance-related marking errors.

European manufacturers prioritize sustainable flexible packaging processing and corrugated cardboard encoding, heavily utilizing roll-to-roll conveyor integration alongside a high-precision galvanometer scanning head to execute eco-friendly micro-perforation processing.

These regional variations highlight how localized supply chains and machine vision alignment requirements dictate optical technology deployment.

Market Dynamics

Our researchers analyzed the data with 2025 as the base year, along with the key drivers, trends, and challenges. A holistic analysis of drivers will help companies refine their marketing strategies to gain a competitive advantage.

  • The continuous evolution of the Laser Engraving Machine Market is fundamentally reshaping how industrial manufacturers approach permanent part identification and material processing. As production facilities transition toward fully digitized operations, the deployment of high-speed fiber laser marking systems has become critical for maintaining traceability across complex supply chains.
  • This technological shift allows automotive and aerospace manufacturers to execute deep relief etching on hardened metals with unprecedented speed and accuracy. Concurrently, the integration of automated robotic cell integration software enables seamless communication between marking stations and enterprise resource planning platforms, reducing manual handling errors by nearly 18% compared to legacy mechanical stamping workflows.
  • In the medical and electronics sectors, the demand for processing heat-sensitive substrates has accelerated the adoption of ultraviolet laser micro-machining tools, which provide cold-marking capabilities essential for preserving material integrity. Furthermore, the packaging and signage industries continue to leverage carbon dioxide flatbed engraver units to process organic materials, acrylics, and coated glass with high precision.
  • To further optimize these diverse applications, equipment manufacturers are increasingly embedding artificial intelligence vision alignment systems into their machinery. These intelligent optical networks automatically detect workpiece orientation and adjust focal parameters in real time, ensuring consistent engraving quality even during mixed-batch production runs.
  • By minimizing setup times and eliminating costly rework, these advanced laser solutions provide a measurable competitive advantage for modern fabrication enterprises.
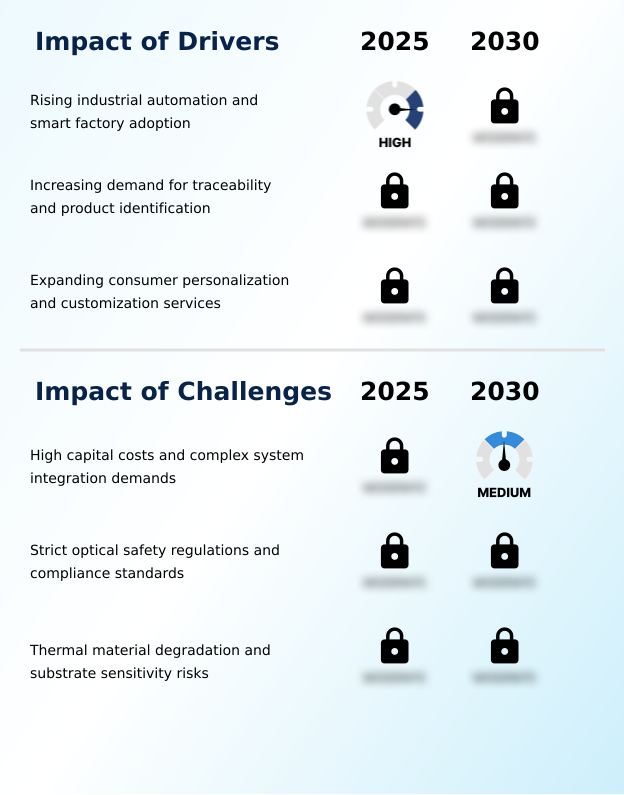
What are the key market drivers leading to the rise in the adoption of Laser Engraving Machine Industry?

  • Rising industrial automation and the widespread adoption of smart factory ecosystems serve as the primary catalysts propelling market expansion.

  • The global transition toward industrial automation integration acts as a powerful catalyst propelling the Laser Engraving Machine Market.
  • Contemporary manufacturing facilities are systematically replacing legacy mechanical stamping workstations with digital laser marking systems that interface seamlessly within a broader smart factory ecosystem. This digital synergy enables non-stop operation during high-throughput production, improving continuous manufacturing uptime by 20%.
  • By utilizing advanced carbon dioxide resonator technology and a highly efficient ytterbium doped fiber source, automated marking nodes eliminate physical tool wear.
  • This transition allows manufacturers to execute precise direct part marking and non-contact thermal control without halting assembly lines, reducing long-term shop floor labor expenditures by 15%.
  • As the demand for rigorous aerospace component marking and bespoke customization in the promotional merchandise workshop sector expands, the integration of a closed-loop autofocus mechanism ensures superior operational agility and sustained processing efficiency.

What are the market trends shaping the Laser Engraving Machine Industry?

  • The integration of artificial intelligence and automated vision systems represents a defining trend shaping the industry landscape. This technological advancement enhances precision and operational efficiency across complex manufacturing workflows.

  • The deep integration of intelligent optical positioning system software represents a transformative trend within the Laser Engraving Machine Market. Modern fabrication facilities are increasingly deploying these technologies to automatically detect material orientation in real time. This intelligent automation eliminates human alignment errors, reducing machine setup times by 40% and significantly improving overall production throughput.
  • By dynamically adjusting laser pulse stability and raster etching precision on the fly, operators can process mixed batches of un-jigged parts with exceptional accuracy. Consequently, businesses utilizing these systems have decreased costly material rework by 25%. As demand for intricate jewelry fabrication finishing and architectural glass texturing grows, the reliance on a compact desktop rotary system ensures consistent quality.
  • Furthermore, the shift toward direct-to-plate sleeve cylinder engraving and superior vector cutting depth provides commercial signage creation enterprises with the agility needed to accelerate consumer goods customization and lower operational overhead.

What challenges does the Laser Engraving Machine Industry face during its growth?

  • High capital costs and the complex demands of system integration remain significant challenges constraining broader industry growth.

  • The substantial financial investment required to procure and install state-of-the-art optical equipment remains a primary operational challenge within the Laser Engraving Machine Market. Advanced systems utilizing delicate optical fiber doping and specialized digital signal processing controller infrastructure significantly elevate baseline procurement costs.
  • Beyond the initial hardware expenditure, industrial facilities encounter steep system integration expenses when embedding engraving units into existing material handling networks. Maintaining optimal cleanroom optical stability often requires a specialized dust enclosure ventilation system, which can increase ongoing utility and structural retrofitting overhead by 18%.
  • Consequently, small and medium enterprises frequently face an extended capital expenditure cycle, reducing their equipment acquisition rates by 12% compared to larger corporations.
  • Furthermore, mitigating thermal material degradation risks during sensitive electronic component fabrication demands continuous pulse duration adjustment and frequent calibration of the beam delivery component, adding complex maintenance requirements to daily shop floor operations amid unpredictable semiconductor diode supply constraints.

Exclusive Technavio Analysis on Customer Landscape

The laser engraving machine market forecasting report includes the adoption lifecycle of the market, covering from the innovator’s stage to the laggard’s stage. It focuses on adoption rates in different regions based on penetration. Furthermore, the laser engraving machine market report also includes key purchase criteria and drivers of price sensitivity to help companies evaluate and develop their market growth analysis strategies.
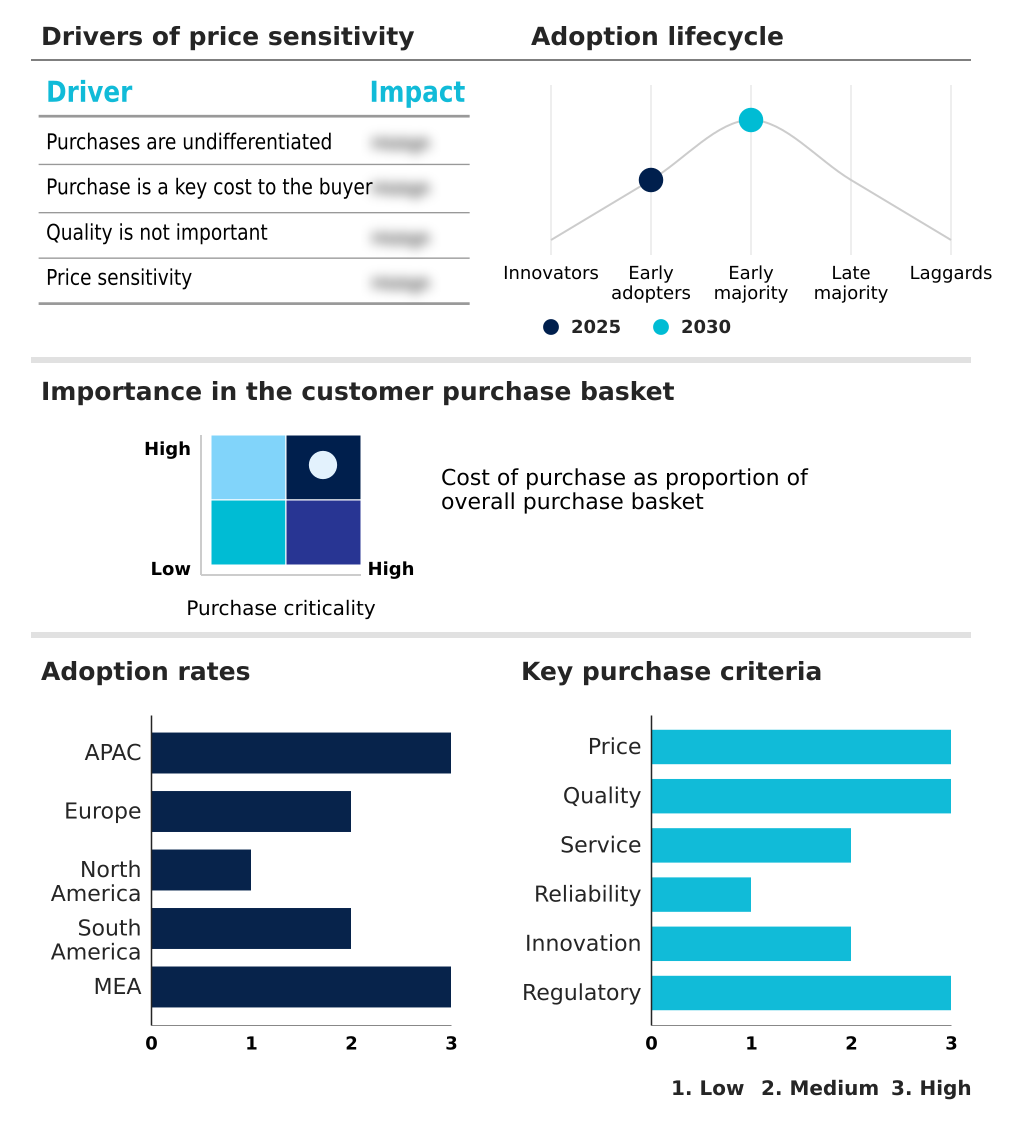
Customer Landscape of Laser Engraving Machine Industry

Competitive Landscape

Companies are implementing various strategies, such as strategic alliances, laser engraving machine market forecast, partnerships, mergers and acquisitions, geographical expansion, and product/service launches, to enhance their presence in the industry.

AMADA WELD TECH Inc. - The portfolio features advanced laser markers and processing workstations engineered for high-precision industrial engraving, ensuring permanent component traceability and seamless integration into automated manufacturing environments.

The industry research and growth report includes detailed analyses of the competitive landscape of the market and information about key companies, including:

  • AMADA WELD TECH Inc.
  • Coherent Corp.
  • CY Laser Srl
  • Datalogic SpA
  • Domino Printing Sciences Plc
  • Epilog Corp.
  • GCC Inc.
  • Gravotech Marking SAS
  • IPG Photonics Corp.
  • Jenoptik AG
  • Laserstar Technologies Corp.
  • MACSA ID SA
  • Markem Imaje
  • Mecco
  • Sisma SpA
  • Telesis Technologies Inc.
  • Trotec Laser GmbH
  • TRUMPF SE Co. KG
  • TYKMA Electrox Inc.
  • Universal Laser Systems Inc.

Qualitative and quantitative analysis of companies has been conducted to help clients understand the wider business environment as well as the strengths and weaknesses of key industry players. Data is qualitatively analyzed to categorize companies as pure play, category-focused, industry-focused, and diversified; it is quantitatively analyzed to categorize companies as dominant, leading, strong, tentative, and weak.

Recent Development and News in Laser engraving machine market

  • In the Industrial Machinery and Supplies and Components industry, the rapid transition toward smart factory architectures has accelerated the deployment of interconnected controllers, directly impacting Laser Engraving Machine demand by requiring marking systems that interface with enterprise resource planning software to achieve a 20% improvement in automated batch changeovers.
  • Stringent unique device identification regulations mandated by health authorities for medical equipment have forced manufacturers to upgrade their component tracking infrastructure, driving the adoption of micro-machining tools capable of etching corrosion-resistant 2D Data Matrix codes on surgical instruments while maintaining 100% compliance with ISO 13485 standards.
  • The expansion of sustainable flexible packaging within the consumer goods sector has necessitated the integration of high-throughput production machinery, increasing the reliance on resonator technology to execute high-speed micro-perforations at line speeds exceeding 150 meters per minute.
  • Supply chain disruptions affecting semiconductor diode availability have prompted automation specialists to localize optical component sourcing, stabilizing the production of galvanometer scanning assemblies and ensuring consistent delivery of marking systems to automotive facilities, thereby reducing equipment lead times by 15%.

Dive into Technavio’s robust research methodology, blending expert interviews, extensive data synthesis, and validated models for unparalleled Laser Engraving Machine Market insights. See full methodology.

Market Scope
Page number 292
Base year 2025
Historic period 2020-2024
Forecast period 2026-2030
Growth momentum & CAGR Accelerate at a CAGR of 7.7%
Market growth 2026-2030 USD 627.3 million
Market structure Fragmented
YoY growth 2025-2026(%) 7.0%
Key countries China, Japan, India, South Korea, Australia, Indonesia, Germany, France, UK, Italy, Spain, The Netherlands, US, Canada, Mexico, Brazil, Argentina, Chile, Saudi Arabia, UAE, South Africa, Turkey and Israel
Competitive landscape Leading Companies, Market Positioning of Companies, Competitive Strategies, and Industry Risks

Request Free Sample

Research Analyst Overview

  • The Laser Engraving Machine Market is experiencing a structural shift as industrial fabricators prioritize precision optical technologies over conventional mechanical tooling. The widespread adoption of master oscillator power amplifier architectures allows operators to execute precise pulse duration adjustments, enabling high-contrast color marking on stainless steel without inducing thermal material degradation.
  • This capability is particularly critical for aerospace and medical device manufacturers requiring permanent direct part marking that withstands harsh sterilization protocols. By integrating advanced galvanometer scanning head assemblies and closed-loop autofocus mechanisms, production facilities have achieved a 25% reduction in processing cycle times compared to legacy etching methods.
  • Furthermore, the implementation of intelligent machine vision alignment ensures accurate print-to-cut registration, significantly minimizing substrate waste during complex fabrication runs. As regulatory frameworks increasingly mandate rigorous sub-component traceability, reliance on stable beam delivery component infrastructure becomes essential for maintaining operational compliance.
  • This continuous technological evolution empowers enterprises to optimize manufacturing workflows, reduce long-term maintenance expenditures, and deliver superior product quality across diverse industrial applications.

What are the Key Data Covered in this Laser Engraving Machine Market Research and Growth Report?

  • What is the expected growth of the Laser Engraving Machine Market between 2026 and 2030?

    • USD 627.3 million, at a CAGR of 7.7%

  • What segmentation does the market report cover?

    • The report is segmented by Type (Fiber laser machines, Gas laser machines, and Others), Application (Printing and packaging, Advertising decoration, Leather and apparel, Model making, and Others), Product (Medium power, High power, and Low power) and Geography (APAC, Europe, North America, South America, Middle East and Africa)

  • Which regions are analyzed in the report?

    • APAC, Europe, North America, South America and Middle East and Africa

  • What are the key growth drivers and market challenges?

    • Rising industrial automation and smart factory adoption, High capital costs and complex system integration demands

  • Who are the major players in the Laser Engraving Machine Market?

    • AMADA WELD TECH Inc., Coherent Corp., CY Laser Srl, Datalogic SpA, Domino Printing Sciences Plc, Epilog Corp., GCC Inc., Gravotech Marking SAS, IPG Photonics Corp., Jenoptik AG, Laserstar Technologies Corp., MACSA ID SA, Markem Imaje, Mecco, Sisma SpA, Telesis Technologies Inc., Trotec Laser GmbH, TRUMPF SE Co. KG, TYKMA Electrox Inc. and Universal Laser Systems Inc.

Market Research Insights

  • The Laser Engraving Machine Market is undergoing a rapid transformation fueled by the integration of advanced photonics into smart factory ecosystems. Industrial manufacturers are increasingly deploying these systems to enhance component serialization tracking and ensure compliance with stringent unique device identification mandates.
  • By transitioning from traditional chemical etching to digital laser processing, facilities have improved agile manufacturing workflow efficiency by 22%. Furthermore, the implementation of automated desktop rotary systems in commercial signage creation has reduced material setup times by 15%, directly lowering operational overhead.
  • As the demand for consumer goods customization accelerates, businesses leveraging high-precision laser engravers report a 30% increase in order fulfillment speed, demonstrating the critical role of optical technology in optimizing modern production operations.

We can help! Our analysts can customize this laser engraving machine market research report to meet your requirements.

Get in touch

1. Executive Summary

1.1 Market overview

Executive Summary - Chart on Market Overview
Executive Summary - Data Table on Market Overview
Executive Summary - Chart on Global Market Characteristics
Executive Summary - Chart on Market by Geography
Executive Summary - Chart on Market Segmentation by Type
Executive Summary - Chart on Market Segmentation by Application
Executive Summary - Chart on Market Segmentation by Product
Executive Summary - Chart on Incremental Growth
Executive Summary - Data Table on Incremental Growth
Executive Summary - Chart on Company Market Positioning

2. Technavio Analysis

2.1 Analysis of price sensitivity, lifecycle, customer purchase basket, adoption rates, and purchase criteria

2.2 Criticality of inputs and Factors of differentiation

Chart on Overview on criticality of inputs and factors of differentiation

2.3 Factors of disruption

Chart on Overview on factors of disruption

2.4 Impact of drivers and challenges

Chart on Impact of drivers and challenges in 2025 and 2030

3. Market Landscape

3.1 Market ecosystem

Chart on Parent Market
Data Table on - Parent Market

3.2 Market characteristics

Chart on Market characteristics analysis

3.3 Value chain analysis

Chart on Value chain analysis

4. Market Sizing

4.1 Market definition

Data Table on Offerings of companies included in the market definition

4.2 Market segment analysis

Market segments

4.3 Market size 2025

4.4 Market outlook: Forecast for 2025-2030

Chart on Global - Market size and forecast 2025-2030 ($ million)
Data Table on Global - Market size and forecast 2025-2030 ($ million)
Chart on Global Market: Year-over-year growth 2025-2030 (%)
Data Table on Global Market: Year-over-year growth 2025-2030 (%)

5. Historic Market Size

5.1 Global Laser Engraving Machine Market 2020 - 2024

Historic Market Size - Data Table on Global Laser Engraving Machine Market 2020 - 2024 ($ million)

5.2 Type segment analysis 2020 - 2024

Historic Market Size - Type Segment 2020 - 2024 ($ million)

5.3 Application segment analysis 2020 - 2024

Historic Market Size - Application Segment 2020 - 2024 ($ million)

5.4 Product segment analysis 2020 - 2024

Historic Market Size - Product Segment 2020 - 2024 ($ million)

5.5 Geography segment analysis 2020 - 2024

Historic Market Size - Geography Segment 2020 - 2024 ($ million)

5.6 Country segment analysis 2020 - 2024

Historic Market Size - Country Segment 2020 - 2024 ($ million)

6. Qualitative Analysis

6.1 Impact of AI on global laser engraving machine market

6.2 Impact of geopolitical conflicts on global laser engraving machine market

7. Five Forces Analysis

7.1 Five forces summary

Five forces analysis - Comparison between 2025 and 2030

7.2 Bargaining power of buyers

Bargaining power of buyers - Impact of key factors 2025 and 2030

7.3 Bargaining power of suppliers

Bargaining power of suppliers - Impact of key factors in 2025 and 2030

7.4 Threat of new entrants

Threat of new entrants - Impact of key factors in 2025 and 2030

7.5 Threat of substitutes

Threat of substitutes - Impact of key factors in 2025 and 2030

7.6 Threat of rivalry

Threat of rivalry - Impact of key factors in 2025 and 2030

7.7 Market condition

Chart on Market condition - Five forces 2025 and 2030

8. Market Segmentation by Type

8.1 Market segments

Chart on Type - Market share 2025-2030 (%)
Data Table on Type - Market share 2025-2030 (%)

8.2 Comparison by Type

Chart on Comparison by Type
Data Table on Comparison by Type

8.3 Fiber laser machines - Market size and forecast 2025-2030

Chart on Fiber laser machines - Market size and forecast 2025-2030 ($ million)
Data Table on Fiber laser machines - Market size and forecast 2025-2030 ($ million)
Chart on Fiber laser machines - Year-over-year growth 2025-2030 (%)
Data Table on Fiber laser machines - Year-over-year growth 2025-2030 (%)

8.4 Gas laser machines - Market size and forecast 2025-2030

Chart on Gas laser machines - Market size and forecast 2025-2030 ($ million)
Data Table on Gas laser machines - Market size and forecast 2025-2030 ($ million)
Chart on Gas laser machines - Year-over-year growth 2025-2030 (%)
Data Table on Gas laser machines - Year-over-year growth 2025-2030 (%)

8.5 Others - Market size and forecast 2025-2030

Chart on Others - Market size and forecast 2025-2030 ($ million)
Data Table on Others - Market size and forecast 2025-2030 ($ million)
Chart on Others - Year-over-year growth 2025-2030 (%)
Data Table on Others - Year-over-year growth 2025-2030 (%)

8.6 Market opportunity by Type

Market opportunity by Type ($ million)
Data Table on Market opportunity by Type ($ million)

9. Market Segmentation by Application

9.1 Market segments

Chart on Application - Market share 2025-2030 (%)
Data Table on Application - Market share 2025-2030 (%)

9.2 Comparison by Application

Chart on Comparison by Application
Data Table on Comparison by Application

9.3 Printing and packaging - Market size and forecast 2025-2030

Chart on Printing and packaging - Market size and forecast 2025-2030 ($ million)
Data Table on Printing and packaging - Market size and forecast 2025-2030 ($ million)
Chart on Printing and packaging - Year-over-year growth 2025-2030 (%)
Data Table on Printing and packaging - Year-over-year growth 2025-2030 (%)

9.4 Advertising decoration - Market size and forecast 2025-2030

Chart on Advertising decoration - Market size and forecast 2025-2030 ($ million)
Data Table on Advertising decoration - Market size and forecast 2025-2030 ($ million)
Chart on Advertising decoration - Year-over-year growth 2025-2030 (%)
Data Table on Advertising decoration - Year-over-year growth 2025-2030 (%)

9.5 Leather and apparel - Market size and forecast 2025-2030

Chart on Leather and apparel - Market size and forecast 2025-2030 ($ million)
Data Table on Leather and apparel - Market size and forecast 2025-2030 ($ million)
Chart on Leather and apparel - Year-over-year growth 2025-2030 (%)
Data Table on Leather and apparel - Year-over-year growth 2025-2030 (%)

9.6 Model making - Market size and forecast 2025-2030

Chart on Model making - Market size and forecast 2025-2030 ($ million)
Data Table on Model making - Market size and forecast 2025-2030 ($ million)
Chart on Model making - Year-over-year growth 2025-2030 (%)
Data Table on Model making - Year-over-year growth 2025-2030 (%)

9.7 Others - Market size and forecast 2025-2030

Chart on Others - Market size and forecast 2025-2030 ($ million)
Data Table on Others - Market size and forecast 2025-2030 ($ million)
Chart on Others - Year-over-year growth 2025-2030 (%)
Data Table on Others - Year-over-year growth 2025-2030 (%)

9.8 Market opportunity by Application

Market opportunity by Application ($ million)
Data Table on Market opportunity by Application ($ million)

10. Market Segmentation by Product

10.1 Market segments

Chart on Product - Market share 2025-2030 (%)
Data Table on Product - Market share 2025-2030 (%)

10.2 Comparison by Product

Chart on Comparison by Product
Data Table on Comparison by Product

10.3 Medium power - Market size and forecast 2025-2030

Chart on Medium power - Market size and forecast 2025-2030 ($ million)
Data Table on Medium power - Market size and forecast 2025-2030 ($ million)
Chart on Medium power - Year-over-year growth 2025-2030 (%)
Data Table on Medium power - Year-over-year growth 2025-2030 (%)

10.4 High power - Market size and forecast 2025-2030

Chart on High power - Market size and forecast 2025-2030 ($ million)
Data Table on High power - Market size and forecast 2025-2030 ($ million)
Chart on High power - Year-over-year growth 2025-2030 (%)
Data Table on High power - Year-over-year growth 2025-2030 (%)

10.5 Low power - Market size and forecast 2025-2030

Chart on Low power - Market size and forecast 2025-2030 ($ million)
Data Table on Low power - Market size and forecast 2025-2030 ($ million)
Chart on Low power - Year-over-year growth 2025-2030 (%)
Data Table on Low power - Year-over-year growth 2025-2030 (%)

10.6 Market opportunity by Product

Market opportunity by Product ($ million)
Data Table on Market opportunity by Product ($ million)

11. Customer Landscape

11.1 Customer landscape overview

Analysis of price sensitivity, lifecycle, customer purchase basket, adoption rates, and purchase criteria

12. Geographic Landscape

12.1 Geographic segmentation

Chart on Market share by geography 2025-2030 (%)
Data Table on Market share by geography 2025-2030 (%)

12.2 Geographic comparison

Chart on Geographic comparison
Data Table on Geographic comparison

12.3 APAC - Market size and forecast 2025-2030

Chart on APAC - Market size and forecast 2025-2030 ($ million)
Data Table on APAC - Market size and forecast 2025-2030 ($ million)
Chart on APAC - Year-over-year growth 2025-2030 (%)
Data Table on APAC - Year-over-year growth 2025-2030 (%)
Chart on Regional Comparison - APAC
Data Table on Regional Comparison - APAC

12.3.1 China - Market size and forecast 2025-2030

Chart on China - Market size and forecast 2025-2030 ($ million)
Data Table on China - Market size and forecast 2025-2030 ($ million)
Chart on China - Year-over-year growth 2025-2030 (%)
Data Table on China - Year-over-year growth 2025-2030 (%)

12.3.2 Japan - Market size and forecast 2025-2030

Chart on Japan - Market size and forecast 2025-2030 ($ million)
Data Table on Japan - Market size and forecast 2025-2030 ($ million)
Chart on Japan - Year-over-year growth 2025-2030 (%)
Data Table on Japan - Year-over-year growth 2025-2030 (%)

12.3.3 India - Market size and forecast 2025-2030

Chart on India - Market size and forecast 2025-2030 ($ million)
Data Table on India - Market size and forecast 2025-2030 ($ million)
Chart on India - Year-over-year growth 2025-2030 (%)
Data Table on India - Year-over-year growth 2025-2030 (%)

12.3.4 South Korea - Market size and forecast 2025-2030

Chart on South Korea - Market size and forecast 2025-2030 ($ million)
Data Table on South Korea - Market size and forecast 2025-2030 ($ million)
Chart on South Korea - Year-over-year growth 2025-2030 (%)
Data Table on South Korea - Year-over-year growth 2025-2030 (%)

12.3.5 Australia - Market size and forecast 2025-2030

Chart on Australia - Market size and forecast 2025-2030 ($ million)
Data Table on Australia - Market size and forecast 2025-2030 ($ million)
Chart on Australia - Year-over-year growth 2025-2030 (%)
Data Table on Australia - Year-over-year growth 2025-2030 (%)

12.3.6 Indonesia - Market size and forecast 2025-2030

Chart on Indonesia - Market size and forecast 2025-2030 ($ million)
Data Table on Indonesia - Market size and forecast 2025-2030 ($ million)
Chart on Indonesia - Year-over-year growth 2025-2030 (%)
Data Table on Indonesia - Year-over-year growth 2025-2030 (%)

12.4 Europe - Market size and forecast 2025-2030

Chart on Europe - Market size and forecast 2025-2030 ($ million)
Data Table on Europe - Market size and forecast 2025-2030 ($ million)
Chart on Europe - Year-over-year growth 2025-2030 (%)
Data Table on Europe - Year-over-year growth 2025-2030 (%)
Chart on Regional Comparison - Europe
Data Table on Regional Comparison - Europe

12.4.1 Germany - Market size and forecast 2025-2030

Chart on Germany - Market size and forecast 2025-2030 ($ million)
Data Table on Germany - Market size and forecast 2025-2030 ($ million)
Chart on Germany - Year-over-year growth 2025-2030 (%)
Data Table on Germany - Year-over-year growth 2025-2030 (%)

12.4.2 France - Market size and forecast 2025-2030

Chart on France - Market size and forecast 2025-2030 ($ million)
Data Table on France - Market size and forecast 2025-2030 ($ million)
Chart on France - Year-over-year growth 2025-2030 (%)
Data Table on France - Year-over-year growth 2025-2030 (%)

12.4.3 UK - Market size and forecast 2025-2030

Chart on UK - Market size and forecast 2025-2030 ($ million)
Data Table on UK - Market size and forecast 2025-2030 ($ million)
Chart on UK - Year-over-year growth 2025-2030 (%)
Data Table on UK - Year-over-year growth 2025-2030 (%)

12.4.4 Italy - Market size and forecast 2025-2030

Chart on Italy - Market size and forecast 2025-2030 ($ million)
Data Table on Italy - Market size and forecast 2025-2030 ($ million)
Chart on Italy - Year-over-year growth 2025-2030 (%)
Data Table on Italy - Year-over-year growth 2025-2030 (%)

12.4.5 Spain - Market size and forecast 2025-2030

Chart on Spain - Market size and forecast 2025-2030 ($ million)
Data Table on Spain - Market size and forecast 2025-2030 ($ million)
Chart on Spain - Year-over-year growth 2025-2030 (%)
Data Table on Spain - Year-over-year growth 2025-2030 (%)

12.4.6 The Netherlands - Market size and forecast 2025-2030

Chart on The Netherlands - Market size and forecast 2025-2030 ($ million)
Data Table on The Netherlands - Market size and forecast 2025-2030 ($ million)
Chart on The Netherlands - Year-over-year growth 2025-2030 (%)
Data Table on The Netherlands - Year-over-year growth 2025-2030 (%)

12.5 North America - Market size and forecast 2025-2030

Chart on North America - Market size and forecast 2025-2030 ($ million)
Data Table on North America - Market size and forecast 2025-2030 ($ million)
Chart on North America - Year-over-year growth 2025-2030 (%)
Data Table on North America - Year-over-year growth 2025-2030 (%)
Chart on Regional Comparison - North America
Data Table on Regional Comparison - North America

12.5.1 US - Market size and forecast 2025-2030

Chart on US - Market size and forecast 2025-2030 ($ million)
Data Table on US - Market size and forecast 2025-2030 ($ million)
Chart on US - Year-over-year growth 2025-2030 (%)
Data Table on US - Year-over-year growth 2025-2030 (%)

12.5.2 Canada - Market size and forecast 2025-2030

Chart on Canada - Market size and forecast 2025-2030 ($ million)
Data Table on Canada - Market size and forecast 2025-2030 ($ million)
Chart on Canada - Year-over-year growth 2025-2030 (%)
Data Table on Canada - Year-over-year growth 2025-2030 (%)

12.5.3 Mexico - Market size and forecast 2025-2030

Chart on Mexico - Market size and forecast 2025-2030 ($ million)
Data Table on Mexico - Market size and forecast 2025-2030 ($ million)
Chart on Mexico - Year-over-year growth 2025-2030 (%)
Data Table on Mexico - Year-over-year growth 2025-2030 (%)

12.6 South America - Market size and forecast 2025-2030

Chart on South America - Market size and forecast 2025-2030 ($ million)
Data Table on South America - Market size and forecast 2025-2030 ($ million)
Chart on South America - Year-over-year growth 2025-2030 (%)
Data Table on South America - Year-over-year growth 2025-2030 (%)
Chart on Regional Comparison - South America
Data Table on Regional Comparison - South America

12.6.1 Brazil - Market size and forecast 2025-2030

Chart on Brazil - Market size and forecast 2025-2030 ($ million)
Data Table on Brazil - Market size and forecast 2025-2030 ($ million)
Chart on Brazil - Year-over-year growth 2025-2030 (%)
Data Table on Brazil - Year-over-year growth 2025-2030 (%)

12.6.2 Argentina - Market size and forecast 2025-2030

Chart on Argentina - Market size and forecast 2025-2030 ($ million)
Data Table on Argentina - Market size and forecast 2025-2030 ($ million)
Chart on Argentina - Year-over-year growth 2025-2030 (%)
Data Table on Argentina - Year-over-year growth 2025-2030 (%)

12.6.3 Chile - Market size and forecast 2025-2030

Chart on Chile - Market size and forecast 2025-2030 ($ million)
Data Table on Chile - Market size and forecast 2025-2030 ($ million)
Chart on Chile - Year-over-year growth 2025-2030 (%)
Data Table on Chile - Year-over-year growth 2025-2030 (%)

12.7 Middle East and Africa - Market size and forecast 2025-2030

Chart on Middle East and Africa - Market size and forecast 2025-2030 ($ million)
Data Table on Middle East and Africa - Market size and forecast 2025-2030 ($ million)
Chart on Middle East and Africa - Year-over-year growth 2025-2030 (%)
Data Table on Middle East and Africa - Year-over-year growth 2025-2030 (%)
Chart on Regional Comparison - Middle East and Africa
Data Table on Regional Comparison - Middle East and Africa

12.7.1 Saudi Arabia - Market size and forecast 2025-2030

Chart on Saudi Arabia - Market size and forecast 2025-2030 ($ million)
Data Table on Saudi Arabia - Market size and forecast 2025-2030 ($ million)
Chart on Saudi Arabia - Year-over-year growth 2025-2030 (%)
Data Table on Saudi Arabia - Year-over-year growth 2025-2030 (%)

12.7.2 UAE - Market size and forecast 2025-2030

Chart on UAE - Market size and forecast 2025-2030 ($ million)
Data Table on UAE - Market size and forecast 2025-2030 ($ million)
Chart on UAE - Year-over-year growth 2025-2030 (%)
Data Table on UAE - Year-over-year growth 2025-2030 (%)

12.7.3 South Africa - Market size and forecast 2025-2030

Chart on South Africa - Market size and forecast 2025-2030 ($ million)
Data Table on South Africa - Market size and forecast 2025-2030 ($ million)
Chart on South Africa - Year-over-year growth 2025-2030 (%)
Data Table on South Africa - Year-over-year growth 2025-2030 (%)

12.7.4 Turkey - Market size and forecast 2025-2030

Chart on Turkey - Market size and forecast 2025-2030 ($ million)
Data Table on Turkey - Market size and forecast 2025-2030 ($ million)
Chart on Turkey - Year-over-year growth 2025-2030 (%)
Data Table on Turkey - Year-over-year growth 2025-2030 (%)

12.7.5 Israel - Market size and forecast 2025-2030

Chart on Israel - Market size and forecast 2025-2030 ($ million)
Data Table on Israel - Market size and forecast 2025-2030 ($ million)
Chart on Israel - Year-over-year growth 2025-2030 (%)
Data Table on Israel - Year-over-year growth 2025-2030 (%)

12.8 Market opportunity by geography

Market opportunity by geography ($ million)
Data Tables on Market opportunity by geography ($ million)

13. Drivers, Challenges, and Opportunity

13.1 Market drivers

Rising industrial automation and smart factory adoption
Increasing demand for traceability and product identification
Expanding consumer personalization and customization services

13.2 Market challenges

High capital costs and complex system integration demands
Strict optical safety regulations and compliance standards
Thermal material degradation and substrate sensitivity risks

13.3 Impact of drivers and challenges

Impact of drivers and challenges in 2025 and 2030

13.4 Market opportunities

Integration of AI and automated vision
Shift toward ultrafast and mopa fiber lasers
Workflow streamlining and cloud connected control software

14. Competitive Landscape

14.1 Overview

14.2

Overview on criticality of inputs and factors of differentiation

14.3 Landscape disruption

Overview on factors of disruption

14.4 Industry risks

Impact of key risks on business

15. Competitive Analysis

15.1 Companies profiled

Companies covered

15.2 Company ranking index

15.3 Market positioning of companies

Matrix on companies position and classification

15.4 AMADA WELD TECH Inc.

AMADA WELD TECH Inc. - Overview
AMADA WELD TECH Inc. - Product / Service
AMADA WELD TECH Inc. - Key offerings
SWOT

15.5 Coherent Corp.

Coherent Corp. - Overview
Coherent Corp. - Business segments
Coherent Corp. - Key offerings
Coherent Corp. - Segment focus
SWOT

15.6 CY Laser Srl

CY Laser Srl - Overview
CY Laser Srl - Product / Service
CY Laser Srl - Key offerings
SWOT

15.7 Datalogic SpA

Datalogic SpA - Overview
Datalogic SpA - Business segments
Datalogic SpA - Key offerings
Datalogic SpA - Segment focus
SWOT

15.8 Domino Printing Sciences Plc

Domino Printing Sciences Plc - Overview
Domino Printing Sciences Plc - Product / Service
Domino Printing Sciences Plc - Key offerings
SWOT

15.9 GCC Inc.

GCC Inc. - Overview
GCC Inc. - Product / Service
GCC Inc. - Key offerings
SWOT

15.10 Gravotech Marking SAS

Gravotech Marking SAS - Overview
Gravotech Marking SAS - Product / Service
Gravotech Marking SAS - Key offerings
SWOT

15.11 IPG Photonics Corp.

IPG Photonics Corp. - Overview
IPG Photonics Corp. - Product / Service
IPG Photonics Corp. - Key offerings
SWOT

15.12 Laserstar Technologies Corp.

Laserstar Technologies Corp. - Overview
Laserstar Technologies Corp. - Product / Service
Laserstar Technologies Corp. - Key offerings
SWOT

15.13 MACSA ID SA

MACSA ID SA - Overview
MACSA ID SA - Product / Service
MACSA ID SA - Key offerings
SWOT

15.14 Markem Imaje

Markem Imaje - Overview
Markem Imaje - Product / Service
Markem Imaje - Key offerings
SWOT

15.15 Sisma SpA

Sisma SpA - Overview
Sisma SpA - Product / Service
Sisma SpA - Key offerings
SWOT

15.16 Telesis Technologies Inc.

Telesis Technologies Inc. - Overview
Telesis Technologies Inc. - Product / Service
Telesis Technologies Inc. - Key offerings
SWOT

15.17 Trotec Laser GmbH

Trotec Laser GmbH - Overview
Trotec Laser GmbH - Product / Service
Trotec Laser GmbH - Key offerings
SWOT

15.18 TRUMPF SE Co. KG

TRUMPF SE Co. KG - Overview
TRUMPF SE Co. KG - Product / Service
TRUMPF SE Co. KG - Key offerings
SWOT

16. Appendix

16.1 Scope of the report

Market definition
Objectives
Notes and caveats

16.2 Inclusions and exclusions checklist

Inclusions checklist
Exclusions checklist

16.3 Currency conversion rates for US$

16.4 Research methodology

16.5 Data procurement

Information sources

16.6 Data validation

16.7 Validation techniques employed for market sizing

16.8 Data synthesis

16.9 360 degree market analysis

16.10 List of abbreviations

Research Methodology

Technavio presents a detailed picture of the market by way of study, synthesis, and summation of data from multiple sources. The analysts have presented the various facets of the market with a particular focus on identifying the key industry influencers. The data thus presented is comprehensive, reliable, and the result of extensive research, both primary and secondary.

INFORMATION SOURCES

Primary sources

  • Manufacturers and suppliers
  • Channel partners
  • Industry experts
  • Strategic decision makers

Secondary sources

  • Industry journals and periodicals
  • Government data
  • Financial reports of key industry players
  • Historical data
  • Press releases

DATA ANALYSIS

Data Synthesis

  • Collation of data
  • Estimation of key figures
  • Analysis of derived insights

Data Validation

  • Triangulation with data models
  • Reference against proprietary databases
  • Corroboration with industry experts

REPORT WRITING

Qualitative

  • Market drivers
  • Market challenges
  • Market trends
  • Five forces analysis

Quantitative

  • Market size and forecast
  • Market segmentation
  • Geographical insights
  • Competitive landscape

Interested in this report?

Get your sample now to see our research methodology and insights!

Download Now

Frequently Asked Questions

Laser Engraving Machine market growth will increase by USD 627.3 million during 2026-2030.

The Laser Engraving Machine market is expected to grow at a CAGR of 7.7% during 2026-2030.

Laser Engraving Machine market is segmented by Type (Fiber laser machines, Gas laser machines, Others) Application (Printing and packaging, Advertising decoration, Leather and apparel, Model making, Others) Product (Medium power, High power, Low power)

AMADA WELD TECH Inc., Coherent Corp., CY Laser Srl, Datalogic SpA, Domino Printing Sciences Plc, Epilog Corp., GCC Inc., Gravotech Marking SAS, IPG Photonics Corp., Jenoptik AG, Laserstar Technologies Corp., MACSA ID SA, Markem Imaje, Mecco, Sisma SpA, Telesis Technologies Inc., Trotec Laser GmbH, TRUMPF SE Co. KG, TYKMA Electrox Inc., Universal Laser Systems Inc. are a few of the key vendors in the Laser Engraving Machine market.

APAC will register the highest growth rate of 40.2% among the other regions. Therefore, the Laser Engraving Machine market in APAC is expected to garner significant business opportunities for the vendors during the forecast period.

China, Japan, India, South Korea, Australia, Indonesia, Germany, France, UK, Italy, Spain, The Netherlands, US, Canada, Mexico, Brazil, Argentina, Chile, Saudi Arabia, UAE, South Africa, Turkey, Israel

  • Rising industrial automation and smart factory adoption is the driving factor this market.

The Laser Engraving Machine market vendors should focus on grabbing business opportunities from the Type segment as it accounted for the largest market share in the base year.
RIA - Research AI Assistant
Ask RIA
