Last Mile Delivery Market Analysis, Size, and Forecast 2026-2030: APAC (China, Japan, and India), North America (US, Canada, and Mexico), Europe (Germany, UK, and France), Middle East and Africa (Saudi Arabia, UAE, and South Africa), South America (Brazil and Argentina), and Rest of World (ROW)

Last Mile Delivery Market Analysis, Size, and Forecast 2026-2030:
APAC (China, Japan, and India), North America (US, Canada, and Mexico), Europe (Germany, UK, and France), Middle East and Africa (Saudi Arabia, UAE, and South Africa), South America (Brazil and Argentina), and Rest of World (ROW)

Published: Mar 2026 296 Pages SKU: IRTNTR71013

Market Overview at a Glance

$54.2 B
Market Opportunity
4.2%
CAGR 2025 - 2030
43.2%
APAC Growth
$146.3 B
B2C segment 2024

Last Mile Delivery Market Size 2026-2030
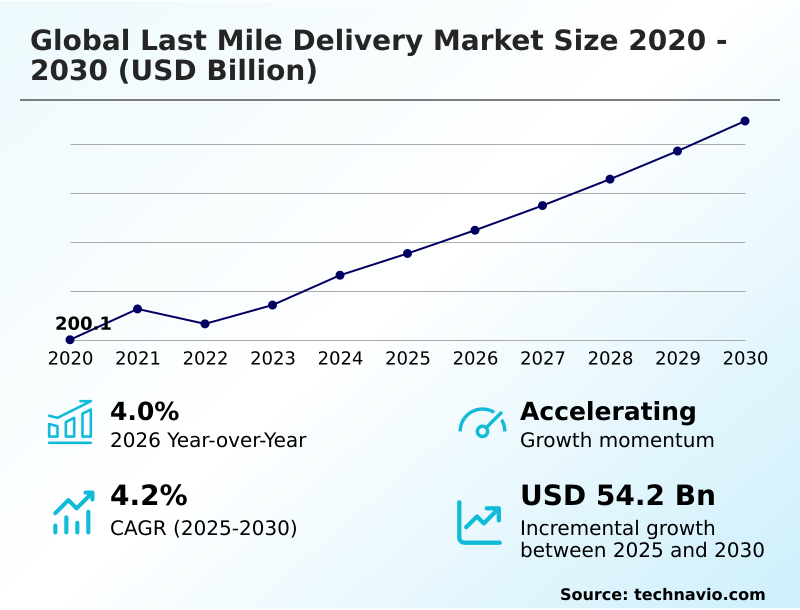
The last mile delivery market size is valued to increase by USD 54.2 billion, at a CAGR of 4.2% from 2025 to 2030. Growing global e-commerce industry will drive the last mile delivery market.

Major Market Trends & Insights

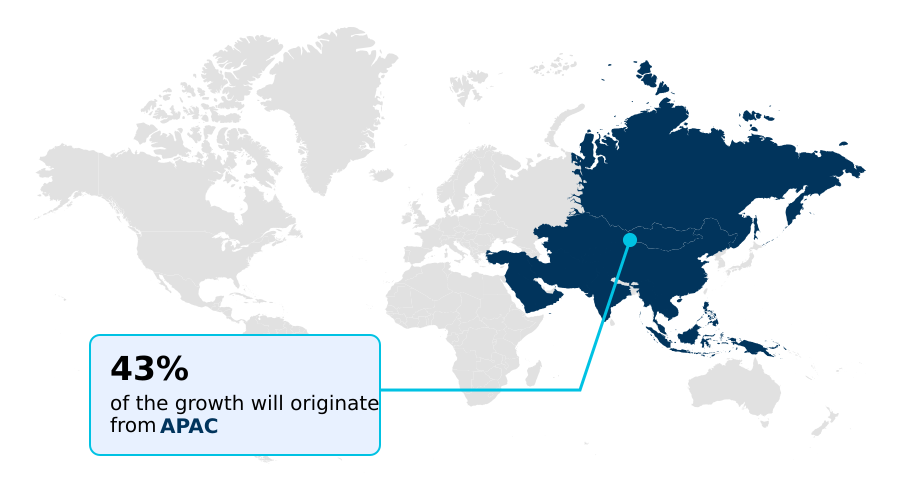
  • APAC dominated the market and accounted for a 43.2% growth during the forecast period.
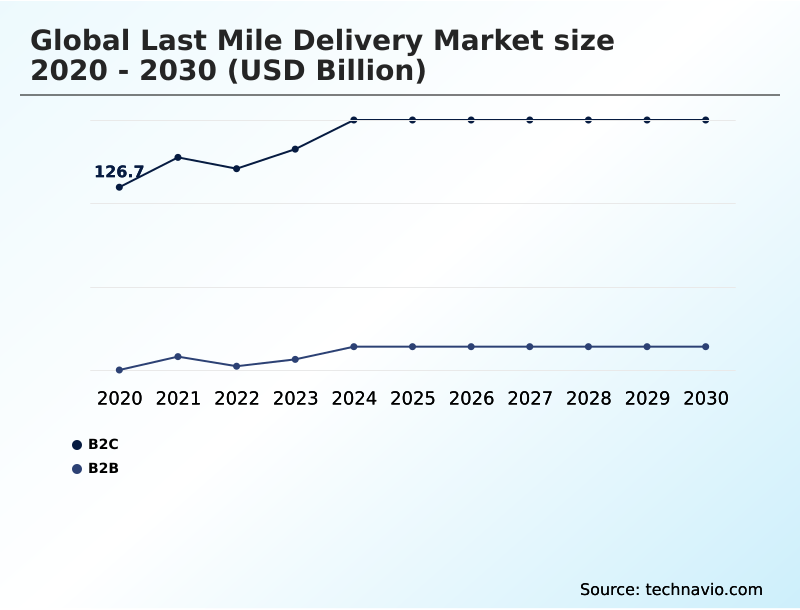
  • By Service - B2C segment was valued at USD 146.3 billion in 2024
  • By Application - FMCG segment accounted for the largest market revenue share in 2024

Market Size & Forecast

  • Market Opportunities: USD 89.5 billion
  • Market Future Opportunities: USD 54.2 billion
  • CAGR from 2025 to 2030 : 4.2%

Market Summary

  • The last mile delivery market is undergoing a significant transformation, driven by the structural shift in consumer purchasing habits toward digital channels. This final, critical stage of the supply chain is defined by a relentless push for greater efficiency, speed, and sustainability.
  • Key trends shaping the landscape include the deployment of last mile delivery automation, such as autonomous delivery robots and automated sorting technology in micro-fulfillment centers, which brings inventory closer to the end consumer.
  • For instance, a retail enterprise can leverage predictive demand forecasting to stock a city-based dark store, then use route optimization software and a fleet of electric delivery vehicles to execute a two-hour delivery promise, directly improving customer retention. This process is supported by real-time tracking systems and geocoding systems for accuracy.
  • However, firms face persistent challenges, including high operational costs, urban congestion, and the complexities of reverse logistics management. Success hinges on balancing investments in sustainable fleet management and delivery management platforms with the need to maintain profitability in a highly competitive environment.

What will be the Size of the Last Mile Delivery Market during the forecast period?

Get Key Insights on Market Forecast (PDF) Request Free Sample

How is the Last Mile Delivery Market Segmented?

The last mile delivery industry research report provides comprehensive data (region-wise segment analysis), with forecasts and estimates in "USD billion" for the period 2026-2030, as well as historical data from 2020-2024 for the following segments.

  • Service
    • B2C
    • B2B
  • Application
    • FMCG
    • E-commerce
    • Retails
    • Others
  • Vehicle type
    • Vans and trucks
    • Two-wheelers
    • Drones
  • Geography
    • APAC
      • China
      • Japan
      • India
    • North America
      • US
      • Canada
      • Mexico
    • Europe
      • Germany
      • UK
      • France
    • Middle East and Africa
      • Saudi Arabia
      • UAE
      • South Africa
    • South America
      • Brazil
      • Argentina
    • Rest of World (ROW)

By Service Insights

The b2c segment is estimated to witness significant growth during the forecast period.

The business-to-consumer segment is propelled by evolving expectations for B2C e-commerce fulfillment, where speed and transparency are paramount. Meeting demand requires sophisticated delivery management platforms and omnichannel fulfillment strategies.

To enhance the customer delivery experience, companies are leveraging hyperlocal distribution hubs and dark store operations to facilitate on-demand delivery services.

Adopting dynamic routing algorithms enables firms to achieve significant operational gains, with some improving on-time delivery accuracy by up to 98%. This focus on efficiency extends to reverse logistics management, which is critical for handling returns and maintaining loyalty.

The integration of contactless delivery methods and electronic proof of delivery has become standard, supported by warehouse management integration and robust inventory management software to ensure seamless final mile transportation from dispatch to doorstep.

Request Free Sample

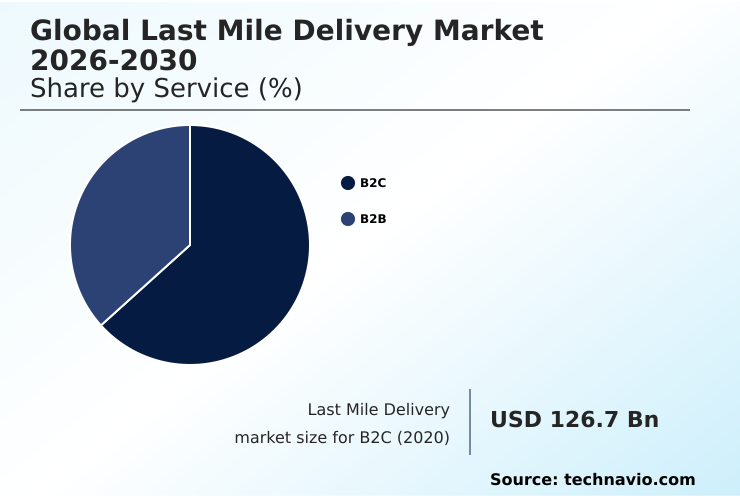
The B2C segment was valued at USD 146.3 billion in 2024 and showed a gradual increase during the forecast period.

Request Free Sample

Regional Analysis

APAC is estimated to contribute 43.2% to the growth of the global market during the forecast period.Technavio’s analysts have elaborately explained the regional trends and drivers that shape the market during the forecast period.

See How Last Mile Delivery Market Demand is Rising in APAC Request Free Sample

The global last mile delivery market exhibits significant regional disparities in maturity and growth dynamics.

APAC is the primary engine of expansion, projected to contribute over 43% of the market's incremental growth, fueled by rapid urbanization and a massive digital commerce shift.

This dynamism fosters innovation in urban logistics solutions and B2B delivery solutions, but also creates regulatory pressures, with some governments mandating a 40% fleet transition to electric vehicles to advance sustainable urban logistics.

In contrast, North America and Europe are mature markets focused on logistics technology integration and supply chain cost optimization through established parcel locker networks and advanced transportation management systems.

These regions prioritize delivery fleet electrification and logistics network design to navigate stringent environmental regulations, showcasing a different set of last mile operational challenges centered on refinement rather than rapid build-out.

Market Dynamics

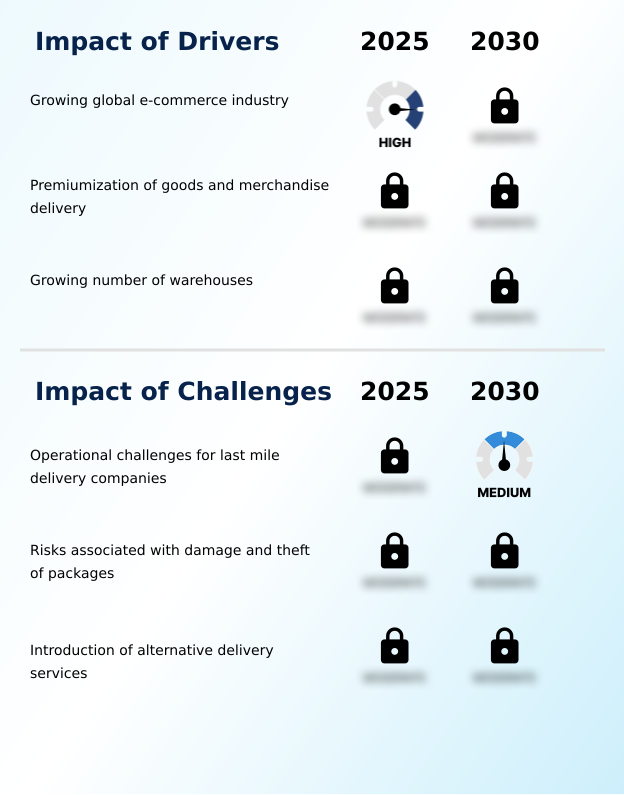
Our researchers analyzed the data with 2025 as the base year, along with the key drivers, trends, and challenges. A holistic analysis of drivers will help companies refine their marketing strategies to gain a competitive advantage.

  • The evolution of the last mile delivery market is defined by a complex interplay between technology, consumer expectations, and operational realities. Optimizing routes for last mile delivery is no longer a simple exercise but a dynamic process involving AI and machine learning to reduce the cost of final mile operations.
  • The technology stack for modern logistics now must include platforms for real-time tracking, predictive analytics, and automated dispatch. Improving urban delivery route efficiency is a critical focus, with companies exploring the strategic differences between last mile vs middle mile logistics to streamline handoffs. Sustainability in last mile operations has become a board-level concern, influencing fleet purchasing decisions and network design.
  • As businesses analyze the future trends in doorstep delivery, they must also perfect the process of managing returns for online retailers, a crucial component of customer satisfaction. The last mile logistics for the retail industry are increasingly specialized, with a growing role of AI in delivery orchestration.
  • Many are now testing the viability of using autonomous robots for packages in controlled environments. The challenges in cross-border e-commerce delivery add another layer of complexity, requiring seamless customs integration. In specialized sectors, standards for white glove delivery are rising, and maintaining cold chain integrity in final mile transit for pharmaceuticals is non-negotiable.
  • Firms that successfully master the benefits of a micro-fulfillment strategy, which can increase delivery density by a double-digit percentage compared to traditional warehousing, are best positioned for success.
  • This requires integrating smart lockers into networks, understanding the best practices for B2B order fulfillment, and leveraging last mile analytics and KPI reporting to navigate the impact of gig workers on delivery and learn how to reduce failed delivery attempts.

What are the key market drivers leading to the rise in the adoption of Last Mile Delivery Industry?

  • The sustained growth of the global e-commerce industry, coupled with rising consumer expectations for rapid and reliable fulfillment, serves as the primary driver for the last mile delivery market.

  • The market's primary driver is the unabated growth of e-commerce, which now accounts for over 20% of total retail sales, creating a structural need for efficient final-mile services.
  • This demand is amplified by the premiumization of delivery, where consumers expect superior services like guaranteed two-hour delivery windows and white-glove services for high-value goods.
  • This trend compels investment in specialized infrastructure like cold chain logistics and secure chain of custody tracking.
  • The expansion of warehouse networks, including micro-fulfillment centers and dark stores, allows companies to position inventory closer to customers, a crucial element for omnichannel fulfillment.
  • This distributed model, supported by predictive demand forecasting and sophisticated fleet management technology, is essential for meeting heightened expectations and managing the complexities of B2C e-commerce fulfillment, including efficient e-commerce returns management.

What are the market trends shaping the Last Mile Delivery Industry?

  • A strong focus on technological advancements is emerging as a primary market trend. This includes the adoption of AI-driven route optimization, automation, and advanced data analytics to enhance efficiency and customer experience.

  • Key market trends are centered on technological advancements aimed at optimizing efficiency and enhancing the customer experience. The adoption of logistics data analytics and route planning AI is paramount, with some operators achieving up to 98% on-time delivery accuracy and a 10% reduction in fuel consumption.
  • This push for efficiency is complemented by a focus on last mile carrier partnerships and automation, including commercial drone delivery and warehouse automation robotics capable of handling significant payloads. The expansion of same-day delivery platforms and specialized services for grocery delivery infrastructure and pharmaceutical logistics underscores the move toward industry-specific solutions.
  • Furthermore, the convergence with digital freight brokerage services enables greater flexibility, while real-time visibility platforms provide the transparency that modern consumers demand, transforming the final delivery into a key competitive differentiator.

What challenges does the Last Mile Delivery Industry face during its growth?

  • Significant operational challenges, including urban congestion, route fragmentation, and labor shortages, present key constraints to the growth and profitability of last-mile delivery companies.

  • Providers face significant last mile operational challenges that directly impact profitability and service quality. Inefficient final-mile operations, stemming from urban delivery efficiency issues and a lack of delivery density optimization, can inflate total logistics costs by over 5%.
  • Competitive pressure is intensifying from alternative models such as third-party logistics (3PL) providers leveraging gig economy logistics and automated parcel delivery via locker networks, which can reduce failed delivery rates by over 90%. Incumbents must navigate these threats by investing in logistics technology integration and embracing multi-modal transportation.
  • Addressing issues like autonomous vehicle regulations and ensuring service consistency across crowd-sourced delivery models are critical for maintaining market position. Furthermore, managing the complexities of heavy goods transportation and cross-border fulfillment adds another layer of operational strain, requiring robust systems and strategic planning.

Exclusive Technavio Analysis on Customer Landscape

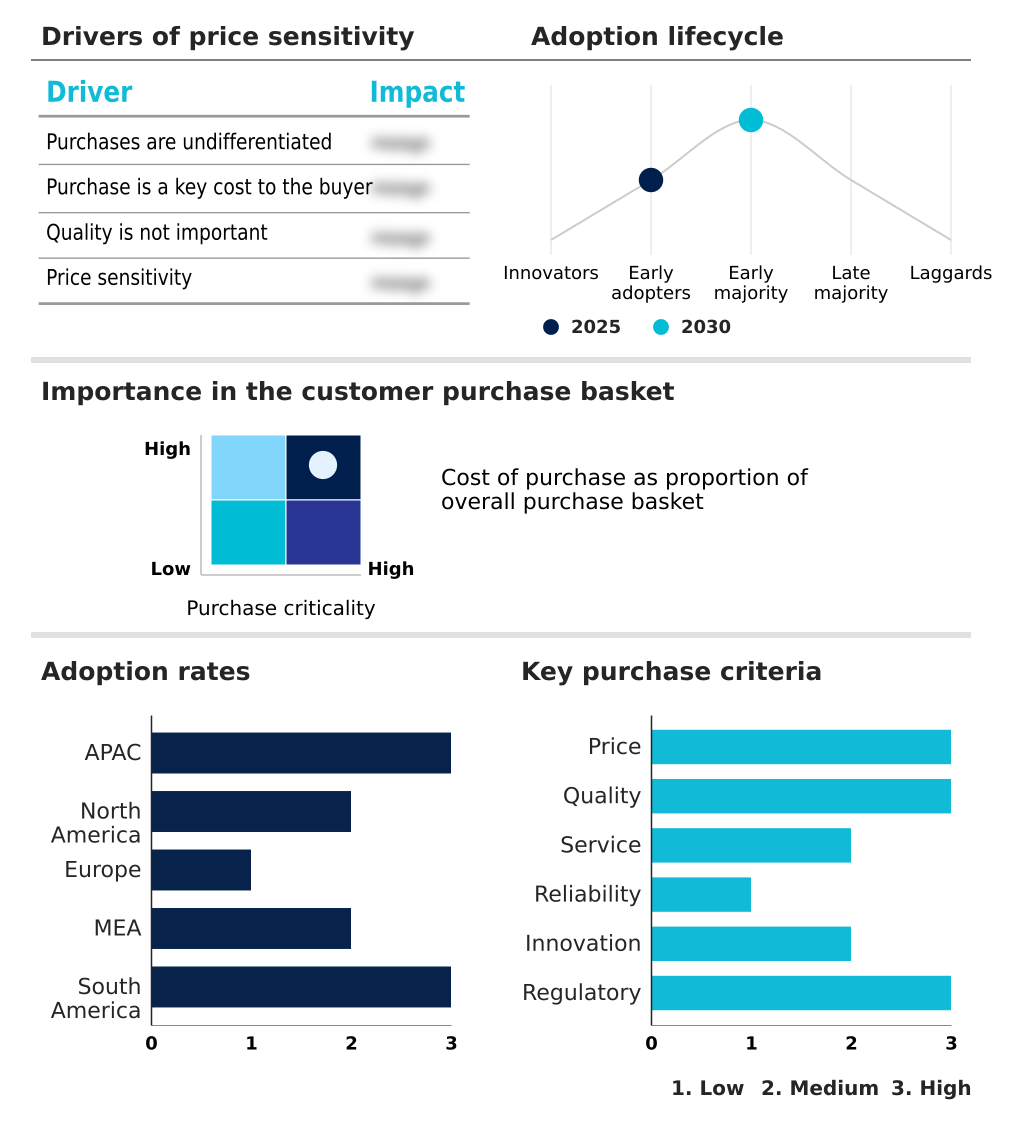
The last mile delivery market forecasting report includes the adoption lifecycle of the market, covering from the innovator’s stage to the laggard’s stage. It focuses on adoption rates in different regions based on penetration. Furthermore, the last mile delivery market report also includes key purchase criteria and drivers of price sensitivity to help companies evaluate and develop their market growth analysis strategies.

Customer Landscape of Last Mile Delivery Industry

Competitive Landscape

Companies are implementing various strategies, such as strategic alliances, last mile delivery market forecast, partnerships, mergers and acquisitions, geographical expansion, and product/service launches, to enhance their presence in the industry.

CMA CGM Group - Offerings center on integrated, end-to-end solutions, including e-commerce fulfillment, urban distribution, and specialized contract logistics designed to optimize supply chain performance.

The industry research and growth report includes detailed analyses of the competitive landscape of the market and information about key companies, including:

  • CMA CGM Group
  • Deutsche Bahn AG
  • Deutsche Post AG
  • DSV AS
  • FarEye Technologies Pvt. Ltd.
  • FedEx Corp.
  • FM Logistic
  • Honeywell International Inc.
  • Infosys Ltd.
  • J.B. Hunt Transport Services
  • Kuehne Nagel Management AG
  • Nippon Express Holdings Inc.
  • Royal Mail Group Ltd.
  • Schneider Electric SE
  • SNCF Group
  • United Parcel Service Inc.
  • Werner Enterprises Inc.
  • XPO Inc.

Qualitative and quantitative analysis of companies has been conducted to help clients understand the wider business environment as well as the strengths and weaknesses of key industry players. Data is qualitatively analyzed to categorize companies as pure play, category-focused, industry-focused, and diversified; it is quantitatively analyzed to categorize companies as dominant, leading, strong, tentative, and weak.

Recent Development and News in Last mile delivery market

  • In May 2025, Nestle launched a hyper-local distribution hub system across Southeast Asia to shorten delivery timelines for its dairy products and guarantee freshness for consumers in dense urban areas.
  • In March 2025, Amazon announced the acquisition of 500 heavy-duty electric trucks in Germany, a move designed to facilitate zero-emission transport between its primary sorting hubs and various city centers.
  • In February 2025, the Brazilian government introduced a digital freight initiative to simplify documentation processes for interstate logistics, which has significantly reduced transit times for goods moving across the country.
  • In September 2024, jewelry brand GIVA launched GIVA GO, a same-day and next-day delivery service in major Indian metropolitan areas, managing the entire logistics process in-house to maintain quality control and speed.

Dive into Technavio’s robust research methodology, blending expert interviews, extensive data synthesis, and validated models for unparalleled Last Mile Delivery Market insights. See full methodology.

Market Scope
Page number 296
Base year 2025
Historic period 2020-2024
Forecast period 2026-2030
Growth momentum & CAGR Accelerate at a CAGR of 4.2%
Market growth 2026-2030 USD 54.2 billion
Market structure Fragmented
YoY growth 2025-2026(%) 4.0%
Key countries China, Japan, India, South Korea, Australia, Indonesia, US, Canada, Mexico, Germany, UK, France, Italy, Spain, The Netherlands, Saudi Arabia, UAE, South Africa, Israel, Turkey, Brazil, Argentina and Chile
Competitive landscape Leading Companies, Market Positioning of Companies, Competitive Strategies, and Industry Risks

Request Free Sample

Research Analyst Overview

  • The last mile delivery market is defined by a strategic pivot toward technology-driven efficiency and sustainability. The core of this evolution lies in last mile delivery automation, where autonomous delivery robots and automated sorting technology are becoming central to urban logistics solutions and B2C e-commerce fulfillment.
  • Deploying dynamic routing algorithms and route optimization software is now standard practice, with platforms demonstrating a capacity to reduce miles driven by 10%. This technological integration, supported by predictive demand forecasting and real-time tracking systems, enables sophisticated final mile transportation.
  • A key trend influencing boardroom strategy is the adoption of sustainable fleet management, involving significant capital expenditure on electric delivery vehicles. This decision balances upfront costs against long-term operational savings and compliance with emissions mandates, representing a critical intersection of financial planning and corporate responsibility.
  • Investments in contactless delivery methods, hyperlocal distribution hubs, and advanced delivery management platforms are no longer optional but essential for maintaining a competitive edge in a market that demands both speed and precision.

What are the Key Data Covered in this Last Mile Delivery Market Research and Growth Report?

  • What is the expected growth of the Last Mile Delivery Market between 2026 and 2030?

    • USD 54.2 billion, at a CAGR of 4.2%

  • What segmentation does the market report cover?

    • The report is segmented by Service (B2C, and B2B), Application (FMCG, E-commerce, Retails, and Others), Vehicle Type (Vans and trucks, Two-wheelers, and Drones) and Geography (APAC, North America, Europe, Middle East and Africa, South America)

  • Which regions are analyzed in the report?

    • APAC, North America, Europe, Middle East and Africa and South America

  • What are the key growth drivers and market challenges?

    • Growing global e-commerce industry, Operational challenges for last mile delivery companies

  • Who are the major players in the Last Mile Delivery Market?

    • CMA CGM Group, Deutsche Bahn AG, Deutsche Post AG, DSV AS, FarEye Technologies Pvt. Ltd., FedEx Corp., FM Logistic, Honeywell International Inc., Infosys Ltd., J.B. Hunt Transport Services, Kuehne Nagel Management AG, Nippon Express Holdings Inc., Royal Mail Group Ltd., Schneider Electric SE, SNCF Group, United Parcel Service Inc., Werner Enterprises Inc. and XPO Inc.

Market Research Insights

  • Market dynamics are increasingly shaped by the pursuit of operational efficiency and an enhanced customer delivery experience. The integration of advanced logistics technology enables measurable performance gains; for example, route planning AI has helped some operators improve on-time accuracy to 98%, while others have seen a 10% reduction in miles driven.
  • Concurrently, the adoption of alternative models like automated parcel delivery through smart lockers has been shown to reduce failed delivery attempts by over 25%, directly impacting supply chain cost optimization.
  • This push for efficiency is balanced by the need for customer-centric logistics, where real-time visibility platforms and flexible final mile carrier selection become key differentiators in a competitive landscape focused on same-day delivery platforms and effective e-commerce returns management.

We can help! Our analysts can customize this last mile delivery market research report to meet your requirements.

Get in touch

1. Executive Summary

1.1 Market overview

Executive Summary - Chart on Market Overview
Executive Summary - Data Table on Market Overview
Executive Summary - Chart on Global Market Characteristics
Executive Summary - Chart on Market by Geography
Executive Summary - Chart on Market Segmentation by Service
Executive Summary - Chart on Market Segmentation by Application
Executive Summary - Chart on Market Segmentation by Vehicle Type
Executive Summary - Chart on Incremental Growth
Executive Summary - Data Table on Incremental Growth
Executive Summary - Chart on Company Market Positioning

2. Technavio Analysis

2.1 Analysis of price sensitivity, lifecycle, customer purchase basket, adoption rates, and purchase criteria

2.2 Criticality of inputs and Factors of differentiation

Chart on Overview on criticality of inputs and factors of differentiation

2.3 Factors of disruption

Chart on Overview on factors of disruption

2.4 Impact of drivers and challenges

Chart on Impact of drivers and challenges in 2025 and 2030

3. Market Landscape

3.1 Market ecosystem

Chart on Parent Market
Data Table on - Parent Market

3.2 Market characteristics

Chart on Market characteristics analysis

3.3 Value chain analysis

Chart on Value chain analysis

4. Market Sizing

4.1 Market definition

Data Table on Offerings of companies included in the market definition

4.2 Market segment analysis

Market segments

4.3 Market size 2025

4.4 Market outlook: Forecast for 2025-2030

Chart on Global - Market size and forecast 2025-2030 ($ billion)
Data Table on Global - Market size and forecast 2025-2030 ($ billion)
Chart on Global Market: Year-over-year growth 2025-2030 (%)
Data Table on Global Market: Year-over-year growth 2025-2030 (%)

5. Historic Market Size

5.1 Global Last Mile Delivery Market 2020 - 2024

Historic Market Size - Data Table on Global Last Mile Delivery Market 2020 - 2024 ($ billion)

5.2 Service segment analysis 2020 - 2024

Historic Market Size - Service Segment 2020 - 2024 ($ billion)

5.3 Application segment analysis 2020 - 2024

Historic Market Size - Application Segment 2020 - 2024 ($ billion)

5.4 Vehicle Type segment analysis 2020 - 2024

Historic Market Size - Vehicle Type Segment 2020 - 2024 ($ billion)

5.5 Geography segment analysis 2020 - 2024

Historic Market Size - Geography Segment 2020 - 2024 ($ billion)

5.6 Country segment analysis 2020 - 2024

Historic Market Size - Country Segment 2020 - 2024 ($ billion)

6. Qualitative Analysis

6.1 The Impact of AI on the Global Last Mile Delivery Market

7. Five Forces Analysis

7.1 Five forces summary

Five forces analysis - Comparison between 2025 and 2030

7.2 Bargaining power of buyers

Bargaining power of buyers - Impact of key factors 2025 and 2030

7.3 Bargaining power of suppliers

Bargaining power of suppliers - Impact of key factors in 2025 and 2030

7.4 Threat of new entrants

Threat of new entrants - Impact of key factors in 2025 and 2030

7.5 Threat of substitutes

Threat of substitutes - Impact of key factors in 2025 and 2030

7.6 Threat of rivalry

Threat of rivalry - Impact of key factors in 2025 and 2030

7.7 Market condition

Chart on Market condition - Five forces 2025 and 2030

8. Market Segmentation by Service

8.1 Market segments

Chart on Service - Market share 2025-2030 (%)
Data Table on Service - Market share 2025-2030 (%)

8.2 Comparison by Service

Chart on Comparison by Service
Data Table on Comparison by Service

8.3 B2C - Market size and forecast 2025-2030

Chart on B2C - Market size and forecast 2025-2030 ($ billion)
Data Table on B2C - Market size and forecast 2025-2030 ($ billion)
Chart on B2C - Year-over-year growth 2025-2030 (%)
Data Table on B2C - Year-over-year growth 2025-2030 (%)

8.4 B2B - Market size and forecast 2025-2030

Chart on B2B - Market size and forecast 2025-2030 ($ billion)
Data Table on B2B - Market size and forecast 2025-2030 ($ billion)
Chart on B2B - Year-over-year growth 2025-2030 (%)
Data Table on B2B - Year-over-year growth 2025-2030 (%)

8.5 Market opportunity by Service

Market opportunity by Service ($ billion)
Data Table on Market opportunity by Service ($ billion)

9. Market Segmentation by Application

9.1 Market segments

Chart on Application - Market share 2025-2030 (%)
Data Table on Application - Market share 2025-2030 (%)

9.2 Comparison by Application

Chart on Comparison by Application
Data Table on Comparison by Application

9.3 FMCG - Market size and forecast 2025-2030

Chart on FMCG - Market size and forecast 2025-2030 ($ billion)
Data Table on FMCG - Market size and forecast 2025-2030 ($ billion)
Chart on FMCG - Year-over-year growth 2025-2030 (%)
Data Table on FMCG - Year-over-year growth 2025-2030 (%)

9.4 E-commerce - Market size and forecast 2025-2030

Chart on E-commerce - Market size and forecast 2025-2030 ($ billion)
Data Table on E-commerce - Market size and forecast 2025-2030 ($ billion)
Chart on E-commerce - Year-over-year growth 2025-2030 (%)
Data Table on E-commerce - Year-over-year growth 2025-2030 (%)

9.5 Retails - Market size and forecast 2025-2030

Chart on Retails - Market size and forecast 2025-2030 ($ billion)
Data Table on Retails - Market size and forecast 2025-2030 ($ billion)
Chart on Retails - Year-over-year growth 2025-2030 (%)
Data Table on Retails - Year-over-year growth 2025-2030 (%)

9.6 Others - Market size and forecast 2025-2030

Chart on Others - Market size and forecast 2025-2030 ($ billion)
Data Table on Others - Market size and forecast 2025-2030 ($ billion)
Chart on Others - Year-over-year growth 2025-2030 (%)
Data Table on Others - Year-over-year growth 2025-2030 (%)

9.7 Market opportunity by Application

Market opportunity by Application ($ billion)
Data Table on Market opportunity by Application ($ billion)

10. Market Segmentation by Vehicle Type

10.1 Market segments

Chart on Vehicle Type - Market share 2025-2030 (%)
Data Table on Vehicle Type - Market share 2025-2030 (%)

10.2 Comparison by Vehicle Type

Chart on Comparison by Vehicle Type
Data Table on Comparison by Vehicle Type

10.3 Vans and trucks - Market size and forecast 2025-2030

Chart on Vans and trucks - Market size and forecast 2025-2030 ($ billion)
Data Table on Vans and trucks - Market size and forecast 2025-2030 ($ billion)
Chart on Vans and trucks - Year-over-year growth 2025-2030 (%)
Data Table on Vans and trucks - Year-over-year growth 2025-2030 (%)

10.4 Two-wheelers - Market size and forecast 2025-2030

Chart on Two-wheelers - Market size and forecast 2025-2030 ($ billion)
Data Table on Two-wheelers - Market size and forecast 2025-2030 ($ billion)
Chart on Two-wheelers - Year-over-year growth 2025-2030 (%)
Data Table on Two-wheelers - Year-over-year growth 2025-2030 (%)

10.5 Drones - Market size and forecast 2025-2030

Chart on Drones - Market size and forecast 2025-2030 ($ billion)
Data Table on Drones - Market size and forecast 2025-2030 ($ billion)
Chart on Drones - Year-over-year growth 2025-2030 (%)
Data Table on Drones - Year-over-year growth 2025-2030 (%)

10.6 Market opportunity by Vehicle Type

Market opportunity by Vehicle Type ($ billion)
Data Table on Market opportunity by Vehicle Type ($ billion)

11. Customer Landscape

11.1 Customer landscape overview

Analysis of price sensitivity, lifecycle, customer purchase basket, adoption rates, and purchase criteria

12. Geographic Landscape

12.1 Geographic segmentation

Chart on Market share by geography 2025-2030 (%)
Data Table on Market share by geography 2025-2030 (%)

12.2 Geographic comparison

Chart on Geographic comparison
Data Table on Geographic comparison

12.3 APAC - Market size and forecast 2025-2030

Chart on APAC - Market size and forecast 2025-2030 ($ billion)
Data Table on APAC - Market size and forecast 2025-2030 ($ billion)
Chart on APAC - Year-over-year growth 2025-2030 (%)
Data Table on APAC - Year-over-year growth 2025-2030 (%)
Chart on Regional Comparison - APAC
Data Table on Regional Comparison - APAC

12.3.1 China - Market size and forecast 2025-2030

Chart on China - Market size and forecast 2025-2030 ($ billion)
Data Table on China - Market size and forecast 2025-2030 ($ billion)
Chart on China - Year-over-year growth 2025-2030 (%)
Data Table on China - Year-over-year growth 2025-2030 (%)

12.3.2 Japan - Market size and forecast 2025-2030

Chart on Japan - Market size and forecast 2025-2030 ($ billion)
Data Table on Japan - Market size and forecast 2025-2030 ($ billion)
Chart on Japan - Year-over-year growth 2025-2030 (%)
Data Table on Japan - Year-over-year growth 2025-2030 (%)

12.3.3 India - Market size and forecast 2025-2030

Chart on India - Market size and forecast 2025-2030 ($ billion)
Data Table on India - Market size and forecast 2025-2030 ($ billion)
Chart on India - Year-over-year growth 2025-2030 (%)
Data Table on India - Year-over-year growth 2025-2030 (%)

12.3.4 South Korea - Market size and forecast 2025-2030

Chart on South Korea - Market size and forecast 2025-2030 ($ billion)
Data Table on South Korea - Market size and forecast 2025-2030 ($ billion)
Chart on South Korea - Year-over-year growth 2025-2030 (%)
Data Table on South Korea - Year-over-year growth 2025-2030 (%)

12.3.5 Australia - Market size and forecast 2025-2030

Chart on Australia - Market size and forecast 2025-2030 ($ billion)
Data Table on Australia - Market size and forecast 2025-2030 ($ billion)
Chart on Australia - Year-over-year growth 2025-2030 (%)
Data Table on Australia - Year-over-year growth 2025-2030 (%)

12.3.6 Indonesia - Market size and forecast 2025-2030

Chart on Indonesia - Market size and forecast 2025-2030 ($ billion)
Data Table on Indonesia - Market size and forecast 2025-2030 ($ billion)
Chart on Indonesia - Year-over-year growth 2025-2030 (%)
Data Table on Indonesia - Year-over-year growth 2025-2030 (%)

12.4 North America - Market size and forecast 2025-2030

Chart on North America - Market size and forecast 2025-2030 ($ billion)
Data Table on North America - Market size and forecast 2025-2030 ($ billion)
Chart on North America - Year-over-year growth 2025-2030 (%)
Data Table on North America - Year-over-year growth 2025-2030 (%)
Chart on Regional Comparison - North America
Data Table on Regional Comparison - North America

12.4.1 US - Market size and forecast 2025-2030

Chart on US - Market size and forecast 2025-2030 ($ billion)
Data Table on US - Market size and forecast 2025-2030 ($ billion)
Chart on US - Year-over-year growth 2025-2030 (%)
Data Table on US - Year-over-year growth 2025-2030 (%)

12.4.2 Canada - Market size and forecast 2025-2030

Chart on Canada - Market size and forecast 2025-2030 ($ billion)
Data Table on Canada - Market size and forecast 2025-2030 ($ billion)
Chart on Canada - Year-over-year growth 2025-2030 (%)
Data Table on Canada - Year-over-year growth 2025-2030 (%)

12.4.3 Mexico - Market size and forecast 2025-2030

Chart on Mexico - Market size and forecast 2025-2030 ($ billion)
Data Table on Mexico - Market size and forecast 2025-2030 ($ billion)
Chart on Mexico - Year-over-year growth 2025-2030 (%)
Data Table on Mexico - Year-over-year growth 2025-2030 (%)

12.5 Europe - Market size and forecast 2025-2030

Chart on Europe - Market size and forecast 2025-2030 ($ billion)
Data Table on Europe - Market size and forecast 2025-2030 ($ billion)
Chart on Europe - Year-over-year growth 2025-2030 (%)
Data Table on Europe - Year-over-year growth 2025-2030 (%)
Chart on Regional Comparison - Europe
Data Table on Regional Comparison - Europe

12.5.1 Germany - Market size and forecast 2025-2030

Chart on Germany - Market size and forecast 2025-2030 ($ billion)
Data Table on Germany - Market size and forecast 2025-2030 ($ billion)
Chart on Germany - Year-over-year growth 2025-2030 (%)
Data Table on Germany - Year-over-year growth 2025-2030 (%)

12.5.2 UK - Market size and forecast 2025-2030

Chart on UK - Market size and forecast 2025-2030 ($ billion)
Data Table on UK - Market size and forecast 2025-2030 ($ billion)
Chart on UK - Year-over-year growth 2025-2030 (%)
Data Table on UK - Year-over-year growth 2025-2030 (%)

12.5.3 France - Market size and forecast 2025-2030

Chart on France - Market size and forecast 2025-2030 ($ billion)
Data Table on France - Market size and forecast 2025-2030 ($ billion)
Chart on France - Year-over-year growth 2025-2030 (%)
Data Table on France - Year-over-year growth 2025-2030 (%)

12.5.4 Italy - Market size and forecast 2025-2030

Chart on Italy - Market size and forecast 2025-2030 ($ billion)
Data Table on Italy - Market size and forecast 2025-2030 ($ billion)
Chart on Italy - Year-over-year growth 2025-2030 (%)
Data Table on Italy - Year-over-year growth 2025-2030 (%)

12.5.5 Spain - Market size and forecast 2025-2030

Chart on Spain - Market size and forecast 2025-2030 ($ billion)
Data Table on Spain - Market size and forecast 2025-2030 ($ billion)
Chart on Spain - Year-over-year growth 2025-2030 (%)
Data Table on Spain - Year-over-year growth 2025-2030 (%)

12.5.6 The Netherlands - Market size and forecast 2025-2030

Chart on The Netherlands - Market size and forecast 2025-2030 ($ billion)
Data Table on The Netherlands - Market size and forecast 2025-2030 ($ billion)
Chart on The Netherlands - Year-over-year growth 2025-2030 (%)
Data Table on The Netherlands - Year-over-year growth 2025-2030 (%)

12.6 Middle East and Africa - Market size and forecast 2025-2030

Chart on Middle East and Africa - Market size and forecast 2025-2030 ($ billion)
Data Table on Middle East and Africa - Market size and forecast 2025-2030 ($ billion)
Chart on Middle East and Africa - Year-over-year growth 2025-2030 (%)
Data Table on Middle East and Africa - Year-over-year growth 2025-2030 (%)
Chart on Regional Comparison - Middle East and Africa
Data Table on Regional Comparison - Middle East and Africa

12.6.1 Saudi Arabia - Market size and forecast 2025-2030

Chart on Saudi Arabia - Market size and forecast 2025-2030 ($ billion)
Data Table on Saudi Arabia - Market size and forecast 2025-2030 ($ billion)
Chart on Saudi Arabia - Year-over-year growth 2025-2030 (%)
Data Table on Saudi Arabia - Year-over-year growth 2025-2030 (%)

12.6.2 UAE - Market size and forecast 2025-2030

Chart on UAE - Market size and forecast 2025-2030 ($ billion)
Data Table on UAE - Market size and forecast 2025-2030 ($ billion)
Chart on UAE - Year-over-year growth 2025-2030 (%)
Data Table on UAE - Year-over-year growth 2025-2030 (%)

12.6.3 South Africa - Market size and forecast 2025-2030

Chart on South Africa - Market size and forecast 2025-2030 ($ billion)
Data Table on South Africa - Market size and forecast 2025-2030 ($ billion)
Chart on South Africa - Year-over-year growth 2025-2030 (%)
Data Table on South Africa - Year-over-year growth 2025-2030 (%)

12.6.4 Israel - Market size and forecast 2025-2030

Chart on Israel - Market size and forecast 2025-2030 ($ billion)
Data Table on Israel - Market size and forecast 2025-2030 ($ billion)
Chart on Israel - Year-over-year growth 2025-2030 (%)
Data Table on Israel - Year-over-year growth 2025-2030 (%)

12.6.5 Turkey - Market size and forecast 2025-2030

Chart on Turkey - Market size and forecast 2025-2030 ($ billion)
Data Table on Turkey - Market size and forecast 2025-2030 ($ billion)
Chart on Turkey - Year-over-year growth 2025-2030 (%)
Data Table on Turkey - Year-over-year growth 2025-2030 (%)

12.7 South America - Market size and forecast 2025-2030

Chart on South America - Market size and forecast 2025-2030 ($ billion)
Data Table on South America - Market size and forecast 2025-2030 ($ billion)
Chart on South America - Year-over-year growth 2025-2030 (%)
Data Table on South America - Year-over-year growth 2025-2030 (%)
Chart on Regional Comparison - South America
Data Table on Regional Comparison - South America

12.7.1 Brazil - Market size and forecast 2025-2030

Chart on Brazil - Market size and forecast 2025-2030 ($ billion)
Data Table on Brazil - Market size and forecast 2025-2030 ($ billion)
Chart on Brazil - Year-over-year growth 2025-2030 (%)
Data Table on Brazil - Year-over-year growth 2025-2030 (%)

12.7.2 Argentina - Market size and forecast 2025-2030

Chart on Argentina - Market size and forecast 2025-2030 ($ billion)
Data Table on Argentina - Market size and forecast 2025-2030 ($ billion)
Chart on Argentina - Year-over-year growth 2025-2030 (%)
Data Table on Argentina - Year-over-year growth 2025-2030 (%)

12.7.3 Chile - Market size and forecast 2025-2030

Chart on Chile - Market size and forecast 2025-2030 ($ billion)
Data Table on Chile - Market size and forecast 2025-2030 ($ billion)
Chart on Chile - Year-over-year growth 2025-2030 (%)
Data Table on Chile - Year-over-year growth 2025-2030 (%)

12.8 Market opportunity by geography

Market opportunity by geography ($ billion)
Data Tables on Market opportunity by geography ($ billion)

13. Drivers, Challenges, and Opportunity

13.1 Market drivers

Growing global e-commerce industry
Premiumization of goods and merchandise delivery
Growing number of warehouses

13.2 Market challenges

Operational challenges for last mile delivery companies
Risks associated with damage and theft of packages
Introduction of alternative delivery services

13.3 Impact of drivers and challenges

Impact of drivers and challenges in 2025 and 2030

13.4 Market opportunities

Strong focus on technological advances
Strong focus on offering services to specific end-user segment
Convergence of last‑mile and CEP networks

14. Competitive Landscape

14.1 Overview

14.2

Overview on criticality of inputs and factors of differentiation

14.3 Landscape disruption

Overview on factors of disruption

14.4 Industry risks

Impact of key risks on business

15. Competitive Analysis

15.1 Companies profiled

Companies covered

15.2 Company ranking index

15.3 Market positioning of companies

Matrix on companies position and classification

15.4 CMA CGM Group

CMA CGM Group - Overview
CMA CGM Group - Product / Service
CMA CGM Group - Key news
CMA CGM Group - Key offerings
SWOT

15.5 Deutsche Bahn AG

Deutsche Bahn AG - Overview
Deutsche Bahn AG - Product / Service
Deutsche Bahn AG - Key offerings
SWOT

15.6 Deutsche Post AG

Deutsche Post AG - Overview
Deutsche Post AG - Business segments
Deutsche Post AG - Key news
Deutsche Post AG - Key offerings
Deutsche Post AG - Segment focus
SWOT

15.7 DSV AS

DSV AS - Overview
DSV AS - Business segments
DSV AS - Key offerings
DSV AS - Segment focus
SWOT

15.8 FedEx Corp.

FedEx Corp. - Overview
FedEx Corp. - Business segments
FedEx Corp. - Key news
FedEx Corp. - Key offerings
FedEx Corp. - Segment focus
SWOT

15.9 FM Logistic

FM Logistic - Overview
FM Logistic - Product / Service
FM Logistic - Key offerings
SWOT

15.10 J.B. Hunt Transport Services

J.B. Hunt Transport Services - Overview
J.B. Hunt Transport Services - Business segments
J.B. Hunt Transport Services - Key offerings
J.B. Hunt Transport Services - Segment focus
SWOT

15.11 Kuehne Nagel Management AG

Kuehne Nagel Management AG - Overview
Kuehne Nagel Management AG - Business segments
Kuehne Nagel Management AG - Key news
Kuehne Nagel Management AG - Key offerings
Kuehne Nagel Management AG - Segment focus
SWOT

15.12 Nippon Express Holdings Inc.

Nippon Express Holdings Inc. - Overview
Nippon Express Holdings Inc. - Business segments
Nippon Express Holdings Inc. - Key news
Nippon Express Holdings Inc. - Key offerings
Nippon Express Holdings Inc. - Segment focus
SWOT

15.13 Royal Mail Group Ltd.

Royal Mail Group Ltd. - Overview
Royal Mail Group Ltd. - Product / Service
Royal Mail Group Ltd. - Key offerings
SWOT

15.14 Schneider Electric SE

Schneider Electric SE - Overview
Schneider Electric SE - Business segments
Schneider Electric SE - Key news
Schneider Electric SE - Key offerings
Schneider Electric SE - Segment focus
SWOT

15.15 SNCF Group

SNCF Group - Overview
SNCF Group - Product / Service
SNCF Group - Key offerings
SWOT

15.16 United Parcel Service Inc.

United Parcel Service Inc. - Overview
United Parcel Service Inc. - Business segments
United Parcel Service Inc. - Key news
United Parcel Service Inc. - Key offerings
United Parcel Service Inc. - Segment focus
SWOT

15.17 Werner Enterprises Inc.

Werner Enterprises Inc. - Overview
Werner Enterprises Inc. - Business segments
Werner Enterprises Inc. - Key offerings
Werner Enterprises Inc. - Segment focus
SWOT

15.18 XPO Inc.

XPO Inc. - Overview
XPO Inc. - Business segments
XPO Inc. - Key news
XPO Inc. - Key offerings
XPO Inc. - Segment focus
SWOT

16. Appendix

16.1 Scope of the report

Market definition
Objectives
Notes and caveats

16.2 Inclusions and exclusions checklist

Inclusions checklist
Exclusions checklist

16.3 Currency conversion rates for US$

16.4 Research methodology

16.5 Data procurement

Information sources

16.6 Data validation

16.7 Validation techniques employed for market sizing

16.8 Data synthesis

16.9 360 degree market analysis

16.10 List of abbreviations

Research Methodology

Technavio presents a detailed picture of the market by way of study, synthesis, and summation of data from multiple sources. The analysts have presented the various facets of the market with a particular focus on identifying the key industry influencers. The data thus presented is comprehensive, reliable, and the result of extensive research, both primary and secondary.

INFORMATION SOURCES

Primary sources

  • Manufacturers and suppliers
  • Channel partners
  • Industry experts
  • Strategic decision makers

Secondary sources

  • Industry journals and periodicals
  • Government data
  • Financial reports of key industry players
  • Historical data
  • Press releases

DATA ANALYSIS

Data Synthesis

  • Collation of data
  • Estimation of key figures
  • Analysis of derived insights

Data Validation

  • Triangulation with data models
  • Reference against proprietary databases
  • Corroboration with industry experts

REPORT WRITING

Qualitative

  • Market drivers
  • Market challenges
  • Market trends
  • Five forces analysis

Quantitative

  • Market size and forecast
  • Market segmentation
  • Geographical insights
  • Competitive landscape

Interested in this report?

Get your sample now to see our research methodology and insights!

Download Now

Frequently Asked Questions

Last Mile Delivery market growth will increase by USD 54.2 billion during 2026-2030.

The Last Mile Delivery market is expected to grow at a CAGR of 4.2% during 2026-2030.

Last Mile Delivery market is segmented by Service (B2C, B2B) Application (FMCG, E-commerce, Retails, Others) Vehicle type (Vans and trucks, Two-wheelers, Drones)

CMA CGM Group, Deutsche Bahn AG, Deutsche Post AG, DSV AS, FarEye Technologies Pvt. Ltd., FedEx Corp., FM Logistic, Honeywell International Inc., Infosys Ltd., J.B. Hunt Transport Services, Kuehne Nagel Management AG, Nippon Express Holdings Inc., Royal Mail Group Ltd., Schneider Electric SE, SNCF Group, United Parcel Service Inc., Werner Enterprises Inc., XPO Inc. are a few of the key vendors in the Last Mile Delivery market.

APAC will register the highest growth rate of 43.2% among the other regions. Therefore, the Last Mile Delivery market in APAC is expected to garner significant business opportunities for the vendors during the forecast period.

China, Japan, India, South Korea, Australia, Indonesia, US, Canada, Mexico, Germany, UK, France, Italy, Spain, The Netherlands, Saudi Arabia, UAE, South Africa, Israel, Turkey, Brazil, Argentina, Chile

  • Growing global e-commerce industry is the driving factor this market.

The Last Mile Delivery market vendors should focus on grabbing business opportunities from the Service segment as it accounted for the largest market share in the base year.
RIA - Research AI Assistant
Ask RIA