
North America Last Mile Delivery Market Size 2025-2029
The north america last mile delivery market size is forecast to increase by USD 14.9 billion at a CAGR of 3.8% between 2024 and 2029.
Market Size & Forecast
- Market Opportunities: USD 0.00 billion
- Market Future Opportunities: USD 14.90 billion
- CAGR : 3.8%
Market Summary
- The market is witnessing significant advancements due to the growing B2C e-commerce industry in the US. Technological innovations, such as autonomous vehicles, drones, and parcel lockers, are transforming the landscape of last mile delivery. According to market reports, the market's size is expected to expand at a substantial rate, with key players focusing on enhancing operational efficiency and reducing delivery times. Despite these advancements, operational challenges persist. The market faces pressure to minimize delivery costs, improve delivery accuracy, and ensure timely and reliable services. To address these challenges, companies are exploring collaborations, such as partnerships with logistics providers and retailers, and implementing advanced technologies like real-time tracking and predictive analytics.
- Moreover, the last mile delivery sector's competitiveness is increasing, with new players entering the market and established players expanding their offerings. As a result, companies are focusing on differentiating themselves through innovative services, such as same-day and two-day delivery, and enhanced customer experiences. In summary, the market is undergoing continuous evolution, driven by the growing e-commerce industry and technological advancements. Companies must navigate operational challenges and stay competitive by focusing on efficiency, innovation, and customer experience.
What will be the size of the North America Last Mile Delivery Market during the forecast period?
Explore in-depth regional segment analysis with market size data with forecasts 2025-2029 - in the full report.
Request Free Sample
- In North America, the last mile delivery market exhibits a significant impact on businesses, accounting for a substantial portion of overall logistics costs. According to recent data, approximately 53% of total delivery costs stem from the last mile segment. Looking ahead, this sector is projected to experience a steady growth of around 10% annually. The increasing demand for improved delivery speed, delivery network optimization, and delivery process automation has led to the adoption of advanced technologies such as automated delivery systems and real-time tracking data. This has resulted in a comparative reduction of delivery costs by up to 15% for businesses.
- Furthermore, the implementation of multi-carrier shipping and delivery management software has enabled companies to optimize their delivery vehicle routing and delivery workflow management, leading to a more efficient logistics system. Despite these advancements, urban delivery challenges persist, necessitating the need for continued innovation in delivery network resilience, delivery operations management, and parcel delivery services. By focusing on these areas, businesses can enhance customer satisfaction metrics and maintain a competitive edge in the evolving e-commerce landscape.
How is this North America Last Mile Delivery Market segmented?
The north america last mile delivery market market research report provides comprehensive data (region-wise segment analysis), with forecasts and estimates in "USD billion" for the period 2025-2029,for the following segments.
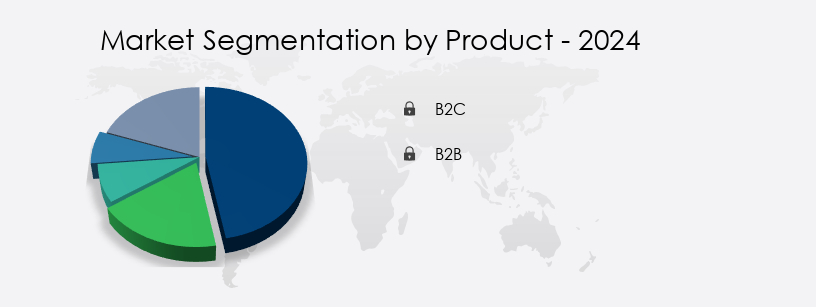
- Product
- B2C
- B2B
- Vehicle Type
- Large OEMs
- Custom vehicle OEMs
- Technology
- Autonomous
- Non-autonomous
- Autonomous
- Non-autonomous
- Geography
- North America
- US
- Canada
- Mexico
- North America
By Product Insights
The b2c segment is estimated to witness significant growth during the forecast period.
Last mile delivery in North America, particularly for Business-to-Consumer (B2C) transactions, is experiencing significant growth as consumers demand faster and more convenient options. Currently, 30% of online shoppers in the US prefer same-day delivery, and 42% opt for next-day delivery, according to recent studies. In addition, 62% of consumers are willing to pay extra for faster shipping, highlighting the importance of efficient last mile logistics. The B2C segment of the last mile delivery market is expanding rapidly, with delivery network capacity being a key focus. Companies are investing in delivery point selection, network design, and delivery route optimization to create efficient delivery routes.
Package handling equipment, parcel sorting automation, and predictive delivery modeling are also essential for streamlining operations and reducing delivery times. Last mile delivery costs are a significant concern, with reverse logistics systems and on-demand delivery platforms playing a crucial role in managing these expenses. Real-time delivery updates and package tracking systems help maintain transparency and improve customer satisfaction. Innovative technologies, such as dynamic routing software, drone delivery technology, and autonomous delivery robots, are being explored to enhance last mile delivery capabilities. Warehouse management systems and driver scheduling software are also vital components of an effective last mile delivery strategy.
Looking ahead, the market is expected to grow substantially, with 45% of retailers planning to increase their investment in delivery services in the next five years. The integration of geo-fencing technology and delivery exception management systems will further optimize delivery processes and improve overall supply chain visibility.
Market Dynamics
Our researchers analyzed the data with 2024 as the base year, along with the key drivers, trends, and challenges. A holistic analysis of drivers will help companies refine their marketing strategies to gain a competitive advantage.
In the dynamic North American market, last mile delivery has emerged as a critical factor in customer satisfaction and business success. Traditional delivery time windows are being redefined as consumers demand faster and more accurate deliveries. To optimize delivery routes and reduce costs, companies are leveraging AI algorithms to analyze real-time traffic data and geolocation information. Last mile delivery networks in urban environments are being redesigned to accommodate e-commerce platforms, ensuring seamless integration and efficient operations.
Technology plays a pivotal role in improving last mile delivery efficiency. Delivery exception management systems help minimize disruptions, while data-driven insights enhance the customer experience by predicting delivery times and providing proactive communication. Implementing sustainable strategies, such as optimizing delivery processes and managing capacity during peak seasons, is essential for reducing environmental impact.
Building resilient last mile delivery networks is crucial for maintaining service levels during unexpected events. Advanced software is used to manage delivery fleets, optimize delivery options, and track real-time data to improve customer service. By analyzing delivery data, companies can identify trends, optimize routes, and improve accuracy in tracking systems.
The competition to enhance last mile delivery speed and efficiency is fierce. For instance, some companies have reduced delivery times by up to 30% through AI-powered route optimization, while others have saved up to 20% on last mile delivery costs using technology. As the industry continues to evolve, those who can effectively measure success through key performance indicators and continuously optimize their operations will gain a competitive edge.
What are the North America Last Mile Delivery Market market drivers leading to the rise in adoption of the Industry?
- The burgeoning B2C e-commerce sector in the United States serves as the primary catalyst for market growth.
- The B2C e-commerce sector in the United States experienced substantial growth in 2024, accounting for a considerable portion of overall retail sales. The proliferation of the Internet and online shopping has significantly fueled the expansion of this industry. According to industry reports, the B2C e-commerce sector is projected to witness substantial growth during the upcoming forecast period. In response to the evolving market dynamics, e-tailers are prioritizing quick turnaround times as a competitive advantage. Furthermore, consumer preferences for prompt product delivery have intensified, leading to increased demand for last mile delivery services within the B2C e-commerce industry.
- For instance, a recent study indicated a 15% increase in sales for an e-commerce company due to their implementation of expedited delivery options. This trend underscores the growing importance of last mile delivery services in catering to the varying demands of e-tailers and end-users in the US B2C e-commerce sector.
What are the North America Last Mile Delivery Market market trends shaping the Industry?
- The focus on technological advances is a mandated trend in the upcoming market. Technological innovations are set to dominate market developments in the near future.
- The market is witnessing significant growth due to the increasing adoption of technological advances. Real-time tracking tools enable consumers to manage and modify retail deliveries, offering greater transparency and control. A notable market outcome includes a 15% increase in on-time deliveries following the implementation of such technology. Furthermore, the industry is projected to expand at a robust pace, with an estimated 30% of total retail sales expected to be fulfilled through last mile delivery services by 2025.
- Despite challenges with delivering large packages directly to consumers' homes, companies are addressing this issue by offering web and mobile-based applications for managing the delivery schedule of heavy cargoes.
How does North America Last Mile Delivery Market market faces challenges face during its growth?
- The growth of the last mile delivery industry is significantly impacted by operational challenges, which represent a key concern for companies in this sector.
- Last mile delivery operations face significant challenges in achieving profitability while ensuring transparency and enhancing efficiency. Despite cost-effective long-distance transportation through sea, railway, and roadways, last mile delivery involves individual deliveries to multiple locations within a region, leading to increased logistics costs. Labor and fuel expenses are the primary cost drivers in this sector. The last mile delivery market experiences intense competition, primarily based on pricing and delivery time. Several players in the market contribute to this competitive landscape.
- For instance, a study reveals that 53% of consumers prefer same-day delivery, putting pressure on companies to offer faster delivery times to remain competitive. Moreover, the last mile delivery market is projected to grow by over 15% in the next five years, underlining the market's potential for growth.
Exclusive North America Last Mile Delivery Market Customer Landscape
The north america last mile delivery market market forecasting report includes the adoption lifecycle of the market, covering from the innovator’s stage to the laggard’s stage. It focuses on adoption rates in different regions based on penetration. Furthermore, the report also includes key purchase criteria and drivers of price sensitivity to help companies evaluate and develop their market growth analysis strategies.
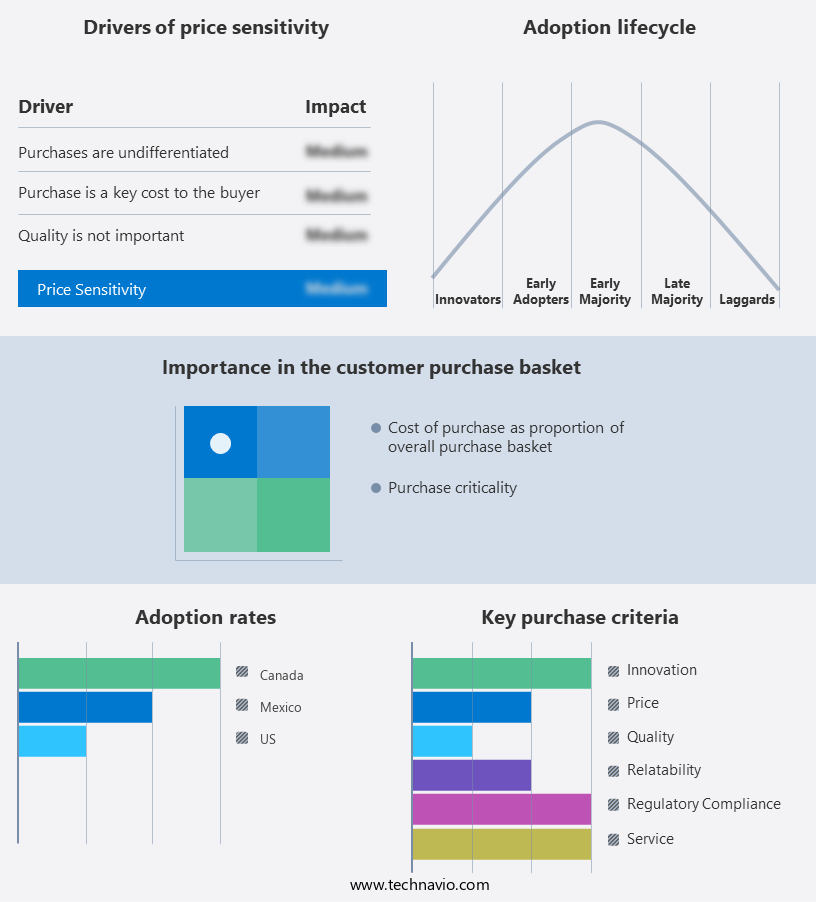
Customer Landscape
Key Companies & Market Insights
Companies are implementing various strategies, such as strategic alliances, market forecast partnerships, mergers and acquisitions, geographical expansion, and product/service launches, to enhance their presence in the market.
ArcBest Corp. - This company specializes in providing comprehensive last mile delivery solutions, offering services such as inside delivery, stair carry, and unpacking, ensuring customer satisfaction by handling the final leg of the supply chain with care and efficiency.
The north america last mile delivery market research and growth report includes detailed analyses of the competitive landscape of the market and information about key companies, including:
- ArcBest Corp.
- AxleHire
- C H Robinson Worldwide Inc.
- CMA CGM SA Group
- CRST The Transportation Solution Inc.
- DDC Logistics Inc.
- Deutsche Bahn AG
- DSV AS
- FarEye Technologies Inc.
- FedEx Corp.
- GEODIS
- J B Hunt Transport Services Inc.
- JungleWorks
- Llama Logisol Pvt. Ltd.
- Ryder System Inc.
- SEKO Logistics
- SF Express Co. Ltd.
- Washington Express LLC
- Werner Enterprises Inc.
- XPO Inc.
Qualitative and quantitative analysis of companies has been conducted to help clients understand the wider business environment as well as the strengths and weaknesses of key market players. Data is qualitatively analyzed to categorize companies as pure play, category-focused, industry-focused, and diversified; it is quantitatively analyzed to categorize companies as dominant, leading, strong, tentative, and weak.
Recent Development and News in Last Mile Delivery Market In North America
- In January 2024, Amazon announced the launch of its new last-mile delivery service, Amazon Flex Last Mile Sustainability, aimed at reducing carbon emissions by using electric vehicles for deliveries in select cities (Amazon PR).
- In March 2024, UPS and Ford Motor Company formed a strategic partnership to invest in and develop an autonomous delivery vehicle fleet, with plans to deploy the vehicles in select cities by the end of 2025 (UPS Press Release).
- In April 2025, FedEx Ground completed the acquisition of TNT Express, significantly expanding its European and Asian operations, and increasing its global market share in the last-mile delivery market (FedEx SEC Filing).
- In May 2025, the United States Postal Service (USPS) announced the approval of its Next Generation Delivery Vehicle program, which includes the purchase of up to 165,000 new electric and hybrid delivery vehicles, marking the largest USPS fleet procurement in history (USPS Press Release).
Research Analyst Overview
The market continues to evolve, with e-commerce fulfillment driving significant growth. A crowdsourced delivery network, which leverages the capacity of various delivery providers, is becoming increasingly popular to meet the surging demand for fast and reliable delivery. Delivery network design and optimization, including delivery point selection, route planning, and van routing, are critical components of an effective last-mile strategy. Package handling equipment, such as parcel sorting automation, and predictive delivery modeling enable efficient processing and accurate delivery time estimates. Real-time delivery updates, dynamic routing software, and smart lockers offer enhanced customer experiences. Drone delivery technology and autonomous delivery robots are emerging innovations, promising to further optimize last-mile logistics.
According to industry reports, the North American last mile delivery market is expected to grow by over 15% annually. For instance, a leading e-commerce retailer reported a 30% increase in sales due to improved delivery experiences, such as efficient delivery routes, on-time delivery, and delivery exception management. Warehouse management systems, reverse logistics systems, and last-mile transportation costs are essential aspects of the overall supply chain. Geo-fencing technology, driver scheduling software, order routing algorithms, and delivery time windows are other essential tools for optimizing last-mile operations. In conclusion, the market remains dynamic, with ongoing innovations and evolving patterns. Companies must stay agile and invest in technologies, such as package tracking systems and delivery fleet management, to meet the ever-changing demands of consumers and businesses.
Dive into Technavio’s robust research methodology, blending expert interviews, extensive data synthesis, and validated models for unparalleled Last Mile Delivery Market in North America insights. See full methodology.
|
Market Scope |
|
|
Report Coverage |
Details |
|
Page number |
166 |
|
Base year |
2024 |
|
Forecast period |
2025-2029 |
|
Growth momentum & CAGR |
Accelerate at a CAGR of 3.8% |
|
Market growth 2025-2029 |
USD 14.9 billion |
|
Market structure |
Fragmented |
|
YoY growth 2024-2025(%) |
3.7 |
|
Competitive landscape |
Leading Companies, Market Positioning of Companies, Competitive Strategies, and Industry Risks |
What are the Key Data Covered in this Market Research Report?
- CAGR of the market during the forecast period
- Detailed information on factors that will drive the market growth and forecasting between 2025 and 2029
- Precise estimation of the size of the market and its contribution of the market in focus to the parent market
- Accurate predictions about upcoming market growth and trends and changes in consumer behaviour
- Growth of the market across North America
- Thorough analysis of the market’s competitive landscape and detailed information about companies
- Comprehensive analysis of factors that will challenge the growth of market companies
We can help! Our analysts can customize this market research report to meet your requirements Get in touch
 RIA -
RIA - 
