Leather Tanning Machinery Market Analysis, Size, and Forecast 2026-2030: North America (US, Canada, and Mexico), Europe (Germany, UK, and France), APAC (China, Japan, and India), South America (Brazil and Argentina), Middle East and Africa (Saudi Arabia, UAE, and South Africa), and Rest of World (ROW)

Leather Tanning Machinery Market Analysis, Size, and Forecast 2026-2030:
North America (US, Canada, and Mexico), Europe (Germany, UK, and France), APAC (China, Japan, and India), South America (Brazil and Argentina), Middle East and Africa (Saudi Arabia, UAE, and South Africa), and Rest of World (ROW)

Published: Apr 2026 286 Pages SKU: IRTNTR77062

Market Overview at a Glance

$18.36 Mn
Market Opportunity
3.4%
CAGR 2025 - 2030
33.1%
Europe Growth
$88.38 Mn
Light leather tanning machinery segment 2024

Leather Tanning Machinery Market Size 2026-2030

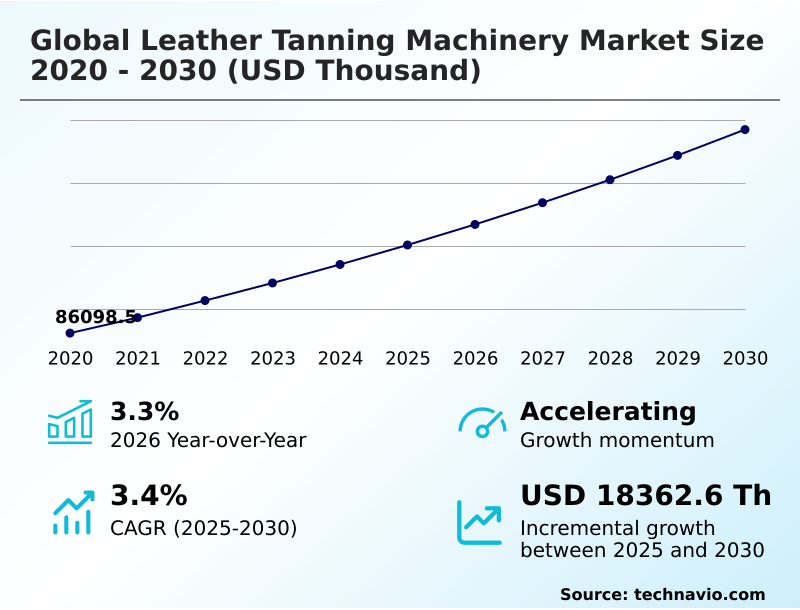
The leather tanning machinery market size is valued to increase by USD 18.36 million, at a CAGR of 3.4% from 2025 to 2030. Escalation of environmental regulations and sustainable processing technologies will drive the leather tanning machinery market.

Major Market Trends & Insights

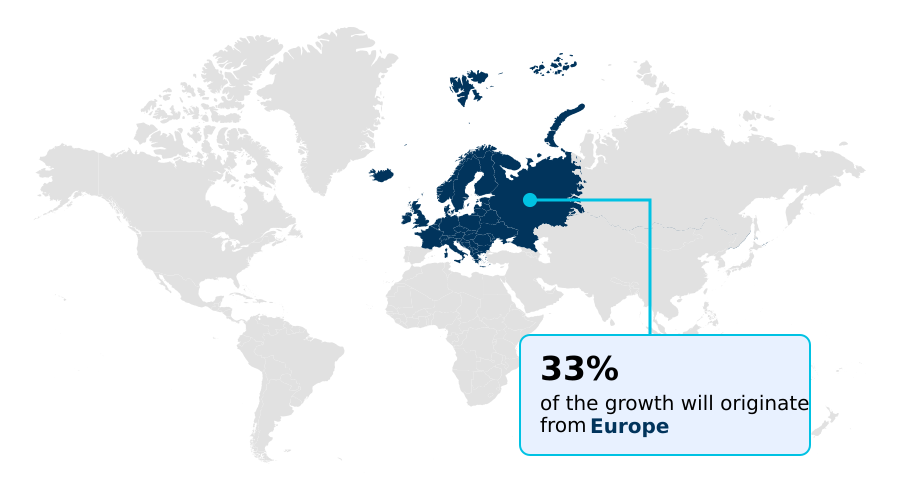
  • Europe dominated the market and accounted for a 33.1% growth during the forecast period.
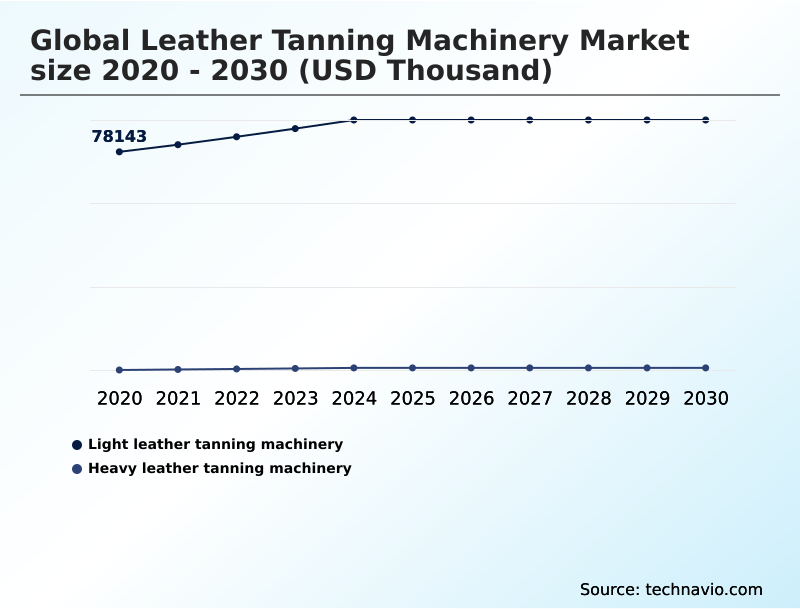
  • By Type - Light leather tanning machinery segment was valued at USD 88.38 million in 2024
  • By Application - Footwear segment accounted for the largest market revenue share in 2024

Market Size & Forecast

  • Market Opportunities:
  • Market Future Opportunities: USD 18.36 million
  • CAGR from 2025 to 2030 : 3.4%

Market Summary

  • The leather tanning machinery market is undergoing a significant transformation, driven by the dual pressures of regulatory compliance and the demand for sustainable production. The industry is moving away from traditional, resource-intensive equipment toward automated, efficient architectures that minimize environmental impact.
  • This evolution is characterized by the integration of advanced technologies such as IoT sensors for real-time monitoring and AI for process optimization. A key application is in the automotive sector, where manufacturers require machinery capable of producing consistently high-quality leather with minimal defects.
  • For instance, a modern tannery supplying this sector might use a closed-loop system where automated tanning drums adjust chemical dosing in real-time based on sensor feedback, reducing water consumption by over 30% and ensuring compliance with discharge regulations. This focus on intelligent, resource-efficient systems, including advanced fleshing machines, vacuum dryers, and comprehensive leather finishing systems, defines the current competitive landscape.
  • The ability to adopt these technologies is becoming critical for maintaining market position and meeting the demands of high-value end-user industries like luxury goods and footwear.

What will be the Size of the Leather Tanning Machinery Market during the forecast period?

Get Key Insights on Market Forecast (PDF) Request Free Sample

How is the Leather Tanning Machinery Market Segmented?

The leather tanning machinery industry research report provides comprehensive data (region-wise segment analysis), with forecasts and estimates in "USD thousand" for the period 2026-2030, as well as historical data from 2020-2024 for the following segments.

  • Type
    • Light leather tanning machinery
    • Heavy leather tanning machinery
  • Application
    • Footwear
    • Leather goods
    • Automotive
    • Garments
    • Others
  • Product type
    • Manual
    • Semi-automatic
    • Fully automatic
  • Geography
    • North America
      • US
      • Canada
      • Mexico
    • Europe
      • Germany
      • UK
      • France
    • APAC
      • China
      • Japan
      • India
    • South America
      • Brazil
      • Argentina
    • Middle East and Africa
      • Saudi Arabia
      • UAE
      • South Africa
    • Rest of World (ROW)

By Type Insights

The light leather tanning machinery segment is estimated to witness significant growth during the forecast period.

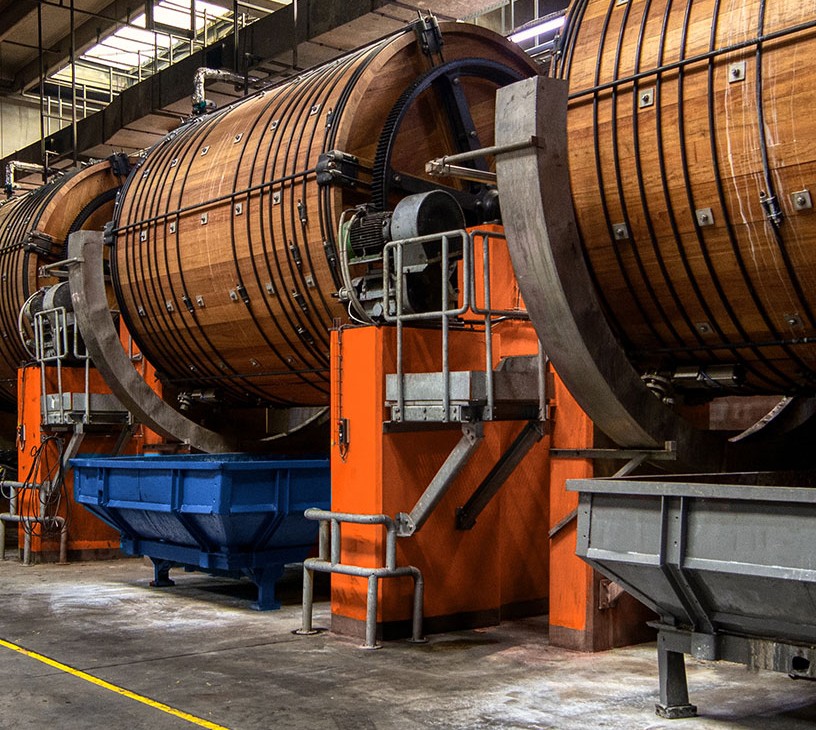
The light leather tanning machinery segment is essential for producing materials for high-end fashion and footwear. This category includes advanced finishing machinery engineered for precision, utilizing automated spray booths for even application of tanning agents.

The evolution of this segment is driven by the integration of digital printing solutions and sophisticated process control automation, which ensure uniformity and quality.

Tanneries are adopting resource-efficient architectures to reduce waste, with some achieving a 15% reduction in material loss through computer aided design integration.

This technological shift, combining advanced surface finishing technologies and leather handling automation, is critical for meeting demand for luxury goods.

Request Free Sample

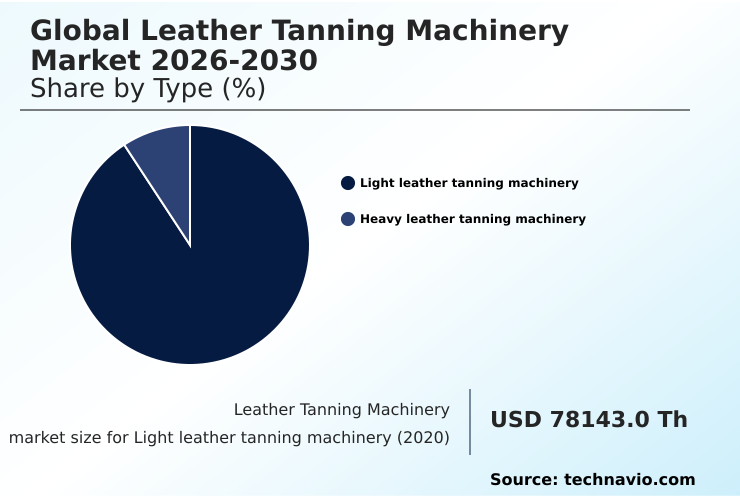
The Light leather tanning machinery segment was valued at USD 88.38 million in 2024 and showed a gradual increase during the forecast period.

Request Free Sample

Regional Analysis

Europe is estimated to contribute 33.1% to the growth of the global market during the forecast period.Technavio’s analysts have elaborately explained the regional trends and drivers that shape the market during the forecast period.

See How Leather Tanning Machinery Market Demand is Rising in Europe Request Free Sample

Europe accounts for the largest market opportunity, representing 33.1% of the potential incremental growth, driven by stringent regulations and the luxury goods sector. In this region, there is a strong focus on advanced leather finishing systems and high-precision machines.

North America is also a key market, prioritizing automated leather processing machinery, including robotic automation systems for tasks like skiving and polishing.

In contrast, the APAC region is rapidly modernizing, adopting new hydraulic presses and precision cutting equipment to meet export standards.

The use of digital twin technologies to model and optimize tannery layouts is gaining traction globally, aiming to enhance efficiency and reduce the environmental footprint across all regions.

Market Dynamics

Our researchers analyzed the data with 2025 as the base year, along with the key drivers, trends, and challenges. A holistic analysis of drivers will help companies refine their marketing strategies to gain a competitive advantage.

  • Strategic decision-making in the global leather tanning machinery market 2026-2030 is increasingly influenced by detailed operational and financial assessments. Evaluating tanning machinery environmental compliance costs is now a critical step for tanneries aiming to operate in regulated markets like Europe.
  • The focus on automation in leather finishing systems is driven by the need for higher quality and consistency, with facilities reporting significant reductions in rework rates. Similarly, understanding the long-term chrome-free tanning machinery benefits, such as reduced wastewater treatment expenses, informs capital investment plans.
  • A key area of analysis is vacuum drying energy efficiency, where newer models offer substantial operational savings compared to legacy equipment. The strategic deployment of iot sensors for wet-end processing provides granular control over chemical uptake, directly impacting material yield.
  • A direct comparison of manual versus automated fleshing machines often reveals that automation can improve hide consistency by over 20%, justifying the higher initial cost.
  • Other critical considerations include modular micro-tannery system design for flexible production, the role of robotic automation in leather handling to reduce labor dependency, implementing ai for leather defect detection, and investing in sustainable vegetable tanning equipment to appeal to eco-conscious consumers.

What are the key market drivers leading to the rise in the adoption of Leather Tanning Machinery Industry?

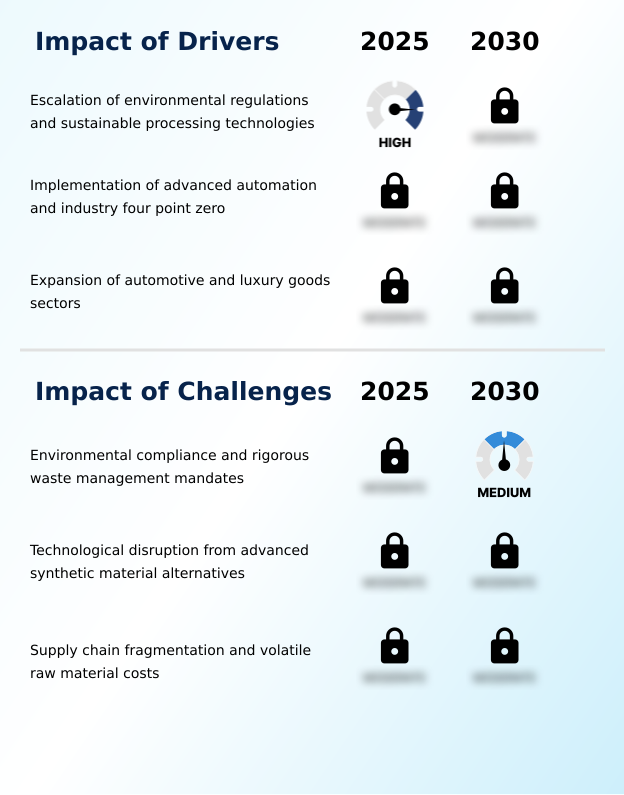
  • The escalation of environmental regulations and the adoption of sustainable processing technologies are primary drivers for the global leather tanning machinery market.

  • Intensifying environmental regulations are compelling the adoption of machinery that supports chrome-free tanning and incorporates advanced water recycling systems.
  • Demand is high for automated tanning drums and efficient fleshing machines equipped with energy-efficient motors, which can lower operational costs by up to 15%.
  • The implementation of Industry 4.0 principles is another key driver, with robotic automation systems and industrial automation equipment becoming standard.
  • Machine learning applications are being deployed for predictive maintenance and defect detection in roller coating machines, with some users reporting a 30% reduction in final product defects.
  • These automated solutions enable tanneries to meet stringent compliance standards while improving overall productivity.

What are the market trends shaping the Leather Tanning Machinery Industry?

  • A key market trend is the rise of decentralized and modular micro-tanneries. This shift is driven by a growing demand for localized production and a reduction in supply chain carbon emissions.

  • The market is witnessing a shift toward modular micro-tanning units, supporting localized and sustainable processing. This trend involves compact systems integrating all stages, including wet-end processing with advanced tanning drums and staking machines. The incorporation of IoT sensors allows for real-time monitoring, improving process efficiency by over 20% in some pilot projects.
  • Innovation in vacuum dryers now includes heat recovery systems that cut energy consumption significantly, with some systems demonstrating a 25% reduction. Furthermore, the push for a circular economy is driving the development of hardware capable of chrome recovery and facilitating the use of bio-based processing agents, making the entire production cycle more environmentally sound.

What challenges does the Leather Tanning Machinery Industry face during its growth?

  • A significant challenge affecting industry growth is the need for stringent environmental compliance and adherence to rigorous waste management mandates.

  • A primary challenge is the high capital expenditure required for advanced machinery compliant with environmental mandates. Many small to medium-sized enterprises find it prohibitive to invest in high-precision machines such as new splitting machines or shaving machines that feature integrated closed-loop systems for chemical management.
  • These upgrades can increase initial investment costs by as much as 50% compared to traditional equipment. The cost of upgrading legacy buffing machines, dedusting machines, and sammying machines adds to the financial strain. Furthermore, the market faces disruption from synthetic alternatives that bypass traditional processing.
  • The use of digital twin technologies to de-risk these expensive upgrades is becoming more common, yet the initial investment remains a significant hurdle.

Exclusive Technavio Analysis on Customer Landscape

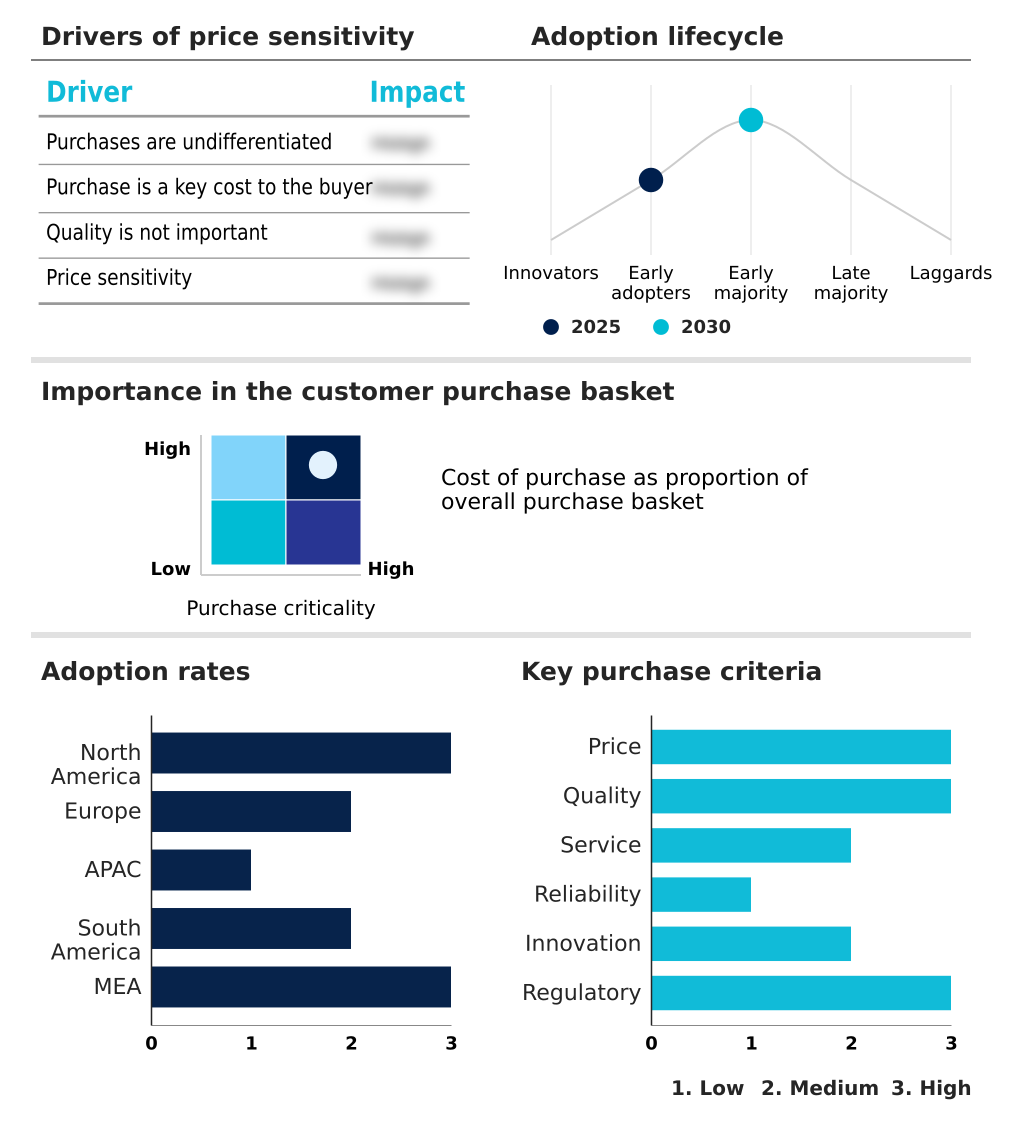
The leather tanning machinery market forecasting report includes the adoption lifecycle of the market, covering from the innovator’s stage to the laggard’s stage. It focuses on adoption rates in different regions based on penetration. Furthermore, the leather tanning machinery market report also includes key purchase criteria and drivers of price sensitivity to help companies evaluate and develop their market growth analysis strategies.

Customer Landscape of Leather Tanning Machinery Industry

Competitive Landscape

Companies are implementing various strategies, such as strategic alliances, leather tanning machinery market forecast, partnerships, mergers and acquisitions, geographical expansion, and product/service launches, to enhance their presence in the industry.

BERGI s.p.a - Specialized machinery for tanning, dyeing, and finishing stages enhances leather processing and quality control, supporting various industrial applications.

The industry research and growth report includes detailed analyses of the competitive landscape of the market and information about key companies, including:

  • BERGI s.p.a
  • Carlessi S.r.l.
  • Comerio Ercole S.p.A.
  • DMS Group S.r.l.
  • Fabbri Tech S.r.l.
  • Fortuna Spezialmaschinen GmbH
  • Gozzini S.r.l.
  • Matic S.r.l.
  • Mec Man S.r.l.
  • Officine di Cartigliano S.p.A
  • Olcina Group
  • Poletto S.r.l.
  • Rizzi S.r.l.
  • Rota Guido S.r.l.
  • S.C. Costruzioni Meccaniche
  • Sandi Macchine S.r.l.
  • Sicom S.r.l.
  • Svit S.r.l.
  • TFL Ledertechnik GmbH
  • Turner S.p.A.

Qualitative and quantitative analysis of companies has been conducted to help clients understand the wider business environment as well as the strengths and weaknesses of key industry players. Data is qualitatively analyzed to categorize companies as pure play, category-focused, industry-focused, and diversified; it is quantitatively analyzed to categorize companies as dominant, leading, strong, tentative, and weak.

Recent Development and News in Leather tanning machinery market

  • In September, 2024, TanneryTech Solutions launched its 'Eco-Drum 5000', a series of automated tanning drums featuring integrated water recycling systems designed to reduce water consumption by up to 40%.
  • In November, 2024, Precision Finish Corp. announced a strategic partnership with VisionAI Inc. to integrate AI-powered defect detection modules into its line of roller coating machines, improving quality control and reducing waste.
  • In February, 2025, Global Leather Systems acquired Italian machinery specialist Finitura S.p.A. in a deal valued at EUR 50 million, aiming to consolidate its portfolio of high-performance leather finishing systems.
  • In May, 2025, The European Chemicals Agency (ECHA) proposed stricter limits on the use of certain tanning agents, a move expected to accelerate the market shift towards chrome-free tanning machinery and alternative processing technologies.

Dive into Technavio’s robust research methodology, blending expert interviews, extensive data synthesis, and validated models for unparalleled Leather Tanning Machinery Market insights. See full methodology.

Market Scope
Page number 286
Base year 2025
Historic period 2020-2024
Forecast period 2026-2030
Growth momentum & CAGR Accelerate at a CAGR of 3.4%
Market growth 2026-2030 USD 18362.6 thousand
Market structure Fragmented
YoY growth 2025-2026(%) 3.3%
Key countries US, Canada, Mexico, Germany, UK, France, Italy, Spain, The Netherlands, China, Japan, India, South Korea, Indonesia, Australia, Brazil, Argentina, Chile, Saudi Arabia, UAE, South Africa, Turkey and Israel
Competitive landscape Leading Companies, Market Positioning of Companies, Competitive Strategies, and Industry Risks

Request Free Sample

Research Analyst Overview

  • The global leather tanning machinery market 2026-2030 is characterized by a definitive shift toward automated, sustainable, and data-driven operations. Core equipment, including fleshing machines, splitting machines, and sophisticated finishing machinery, is being re-engineered to incorporate advanced process control automation. This transition addresses the industry's need for greater efficiency and compliance with environmental regulations.
  • For boardroom consideration, the adoption of chrome-free tanning technologies is no longer optional but a strategic imperative for accessing key export markets. Companies that have integrated water recycling systems into their wet-end processing have achieved a verifiable 40% reduction in water consumption, directly impacting operational costs and sustainability metrics.
  • The market is defined by the integration of machinery like automated tanning drums, staking machines, and vacuum dryers into unified leather processing machinery platforms. Innovations in roller coating machines and sammying machines further enhance quality, while robust heat recovery systems and new tanning agents contribute to a smaller environmental footprint, solidifying the industry's move toward circular economy principles.

What are the Key Data Covered in this Leather Tanning Machinery Market Research and Growth Report?

  • What is the expected growth of the Leather Tanning Machinery Market between 2026 and 2030?

    • USD 18.36 million, at a CAGR of 3.4%

  • What segmentation does the market report cover?

    • The report is segmented by Type (Light leather tanning machinery, and Heavy leather tanning machinery), Application (Footwear, Leather goods, Automotive, Garments, and Others), Product Type (Manual, Semi-automatic, and Fully automatic) and Geography (North America, Europe, APAC, South America, Middle East and Africa)

  • Which regions are analyzed in the report?

    • North America, Europe, APAC, South America and Middle East and Africa

  • What are the key growth drivers and market challenges?

    • Escalation of environmental regulations and sustainable processing technologies, Environmental compliance and rigorous waste management mandates

  • Who are the major players in the Leather Tanning Machinery Market?

    • BERGI s.p.a, Carlessi S.r.l., Comerio Ercole S.p.A., DMS Group S.r.l., Fabbri Tech S.r.l., Fortuna Spezialmaschinen GmbH, Gozzini S.r.l., Matic S.r.l., Mec Man S.r.l., Officine di Cartigliano S.p.A, Olcina Group, Poletto S.r.l., Rizzi S.r.l., Rota Guido S.r.l., S.C. Costruzioni Meccaniche, Sandi Macchine S.r.l., Sicom S.r.l., Svit S.r.l., TFL Ledertechnik GmbH and Turner S.p.A.

Market Research Insights

  • Market dynamics are shaped by a strategic pivot toward intelligent and sustainable manufacturing. The adoption of robotic automation systems in leather handling has led to a 25% increase in operational throughput for early adopters. Advanced chemical management protocols, enabled by sophisticated industrial automation equipment, are central to meeting new environmental standards.
  • Furthermore, the integration of digital twin technologies allows for the virtual prototyping of tannery layouts, which has been shown to reduce facility commissioning times by up to 15%. This emphasis on resource-efficient architectures is not just a compliance measure but a competitive differentiator, as it directly impacts operational costs and production quality.
  • The ability to deploy these interconnected systems effectively is becoming the primary determinant of success in the industry.

We can help! Our analysts can customize this leather tanning machinery market research report to meet your requirements.

Get in touch

1. Executive Summary

1.1 Market overview

Executive Summary - Chart on Market Overview
Executive Summary - Data Table on Market Overview
Executive Summary - Chart on Global Market Characteristics
Executive Summary - Chart on Market by Geography
Executive Summary - Chart on Market Segmentation by Type
Executive Summary - Chart on Market Segmentation by Application
Executive Summary - Chart on Market Segmentation by Product Type
Executive Summary - Chart on Incremental Growth
Executive Summary - Data Table on Incremental Growth
Executive Summary - Chart on Company Market Positioning

2. Technavio Analysis

2.1 Analysis of price sensitivity, lifecycle, customer purchase basket, adoption rates, and purchase criteria

2.2 Criticality of inputs and Factors of differentiation

Chart on Overview on criticality of inputs and factors of differentiation

2.3 Factors of disruption

Chart on Overview on factors of disruption

2.4 Impact of drivers and challenges

Chart on Impact of drivers and challenges in 2025 and 2030

3. Market Landscape

3.1 Market ecosystem

Chart on Parent Market
Data Table on - Parent Market

3.2 Market characteristics

Chart on Market characteristics analysis

3.3 Value chain analysis

Chart on Value chain analysis

4. Market Sizing

4.1 Market definition

Data Table on Offerings of companies included in the market definition

4.2 Market segment analysis

Market segments

4.3 Market size 2025

4.4 Market outlook: Forecast for 2025-2030

Chart on Global - Market size and forecast 2025-2030 ($ thousand)
Data Table on Global - Market size and forecast 2025-2030 ($ thousand)
Chart on Global Market: Year-over-year growth 2025-2030 (%)
Data Table on Global Market: Year-over-year growth 2025-2030 (%)

5. Historic Market Size

5.1 Global Leather Tanning Machinery Market 2020 - 2024

Historic Market Size - Data Table on Global Leather Tanning Machinery Market 2020 - 2024 ($ thousand)

5.2 Type segment analysis 2020 - 2024

Historic Market Size - Type Segment 2020 - 2024 ($ thousand)

5.3 Application segment analysis 2020 - 2024

Historic Market Size - Application Segment 2020 - 2024 ($ thousand)

5.4 Product Type segment analysis 2020 - 2024

Historic Market Size - Product Type Segment 2020 - 2024 ($ thousand)

5.5 Geography segment analysis 2020 - 2024

Historic Market Size - Geography Segment 2020 - 2024 ($ thousand)

5.6 Country segment analysis 2020 - 2024

Historic Market Size - Country Segment 2020 - 2024 ($ thousand)

6. Qualitative Analysis

6.1 Impact of AI in global leather tanning machinery market

6.2 Impact of geopolitical conflict on global leather tanning machinery market

7. Five Forces Analysis

7.1 Five forces summary

Five forces analysis - Comparison between 2025 and 2030

7.2 Bargaining power of buyers

Bargaining power of buyers - Impact of key factors 2025 and 2030

7.3 Bargaining power of suppliers

Bargaining power of suppliers - Impact of key factors in 2025 and 2030

7.4 Threat of new entrants

Threat of new entrants - Impact of key factors in 2025 and 2030

7.5 Threat of substitutes

Threat of substitutes - Impact of key factors in 2025 and 2030

7.6 Threat of rivalry

Threat of rivalry - Impact of key factors in 2025 and 2030

7.7 Market condition

Chart on Market condition - Five forces 2025 and 2030

8. Market Segmentation by Type

8.1 Market segments

Chart on Type - Market share 2025-2030 (%)
Data Table on Type - Market share 2025-2030 (%)

8.2 Comparison by Type

Chart on Comparison by Type
Data Table on Comparison by Type

8.3 Light leather tanning machinery - Market size and forecast 2025-2030

Chart on Light leather tanning machinery - Market size and forecast 2025-2030 ($ thousand)
Data Table on Light leather tanning machinery - Market size and forecast 2025-2030 ($ thousand)
Chart on Light leather tanning machinery - Year-over-year growth 2025-2030 (%)
Data Table on Light leather tanning machinery - Year-over-year growth 2025-2030 (%)

8.4 Heavy leather tanning machinery - Market size and forecast 2025-2030

Chart on Heavy leather tanning machinery - Market size and forecast 2025-2030 ($ thousand)
Data Table on Heavy leather tanning machinery - Market size and forecast 2025-2030 ($ thousand)
Chart on Heavy leather tanning machinery - Year-over-year growth 2025-2030 (%)
Data Table on Heavy leather tanning machinery - Year-over-year growth 2025-2030 (%)

8.5 Market opportunity by Type

Market opportunity by Type ($ thousand)
Data Table on Market opportunity by Type ($ thousand)

9. Market Segmentation by Application

9.1 Market segments

Chart on Application - Market share 2025-2030 (%)
Data Table on Application - Market share 2025-2030 (%)

9.2 Comparison by Application

Chart on Comparison by Application
Data Table on Comparison by Application

9.3 Footwear - Market size and forecast 2025-2030

Chart on Footwear - Market size and forecast 2025-2030 ($ thousand)
Data Table on Footwear - Market size and forecast 2025-2030 ($ thousand)
Chart on Footwear - Year-over-year growth 2025-2030 (%)
Data Table on Footwear - Year-over-year growth 2025-2030 (%)

9.4 Leather goods - Market size and forecast 2025-2030

Chart on Leather goods - Market size and forecast 2025-2030 ($ thousand)
Data Table on Leather goods - Market size and forecast 2025-2030 ($ thousand)
Chart on Leather goods - Year-over-year growth 2025-2030 (%)
Data Table on Leather goods - Year-over-year growth 2025-2030 (%)

9.5 Automotive - Market size and forecast 2025-2030

Chart on Automotive - Market size and forecast 2025-2030 ($ thousand)
Data Table on Automotive - Market size and forecast 2025-2030 ($ thousand)
Chart on Automotive - Year-over-year growth 2025-2030 (%)
Data Table on Automotive - Year-over-year growth 2025-2030 (%)

9.6 Garments - Market size and forecast 2025-2030

Chart on Garments - Market size and forecast 2025-2030 ($ thousand)
Data Table on Garments - Market size and forecast 2025-2030 ($ thousand)
Chart on Garments - Year-over-year growth 2025-2030 (%)
Data Table on Garments - Year-over-year growth 2025-2030 (%)

9.7 Others - Market size and forecast 2025-2030

Chart on Others - Market size and forecast 2025-2030 ($ thousand)
Data Table on Others - Market size and forecast 2025-2030 ($ thousand)
Chart on Others - Year-over-year growth 2025-2030 (%)
Data Table on Others - Year-over-year growth 2025-2030 (%)

9.8 Market opportunity by Application

Market opportunity by Application ($ thousand)
Data Table on Market opportunity by Application ($ thousand)

10. Market Segmentation by Product Type

10.1 Market segments

Chart on Product Type - Market share 2025-2030 (%)
Data Table on Product Type - Market share 2025-2030 (%)

10.2 Comparison by Product Type

Chart on Comparison by Product Type
Data Table on Comparison by Product Type

10.3 Manual - Market size and forecast 2025-2030

Chart on Manual - Market size and forecast 2025-2030 ($ thousand)
Data Table on Manual - Market size and forecast 2025-2030 ($ thousand)
Chart on Manual - Year-over-year growth 2025-2030 (%)
Data Table on Manual - Year-over-year growth 2025-2030 (%)

10.4 Semi-automatic - Market size and forecast 2025-2030

Chart on Semi-automatic - Market size and forecast 2025-2030 ($ thousand)
Data Table on Semi-automatic - Market size and forecast 2025-2030 ($ thousand)
Chart on Semi-automatic - Year-over-year growth 2025-2030 (%)
Data Table on Semi-automatic - Year-over-year growth 2025-2030 (%)

10.5 Fully automatic - Market size and forecast 2025-2030

Chart on Fully automatic - Market size and forecast 2025-2030 ($ thousand)
Data Table on Fully automatic - Market size and forecast 2025-2030 ($ thousand)
Chart on Fully automatic - Year-over-year growth 2025-2030 (%)
Data Table on Fully automatic - Year-over-year growth 2025-2030 (%)

10.6 Market opportunity by Product Type

Market opportunity by Product Type ($ thousand)
Data Table on Market opportunity by Product Type ($ thousand)

11. Customer Landscape

11.1 Customer landscape overview

Analysis of price sensitivity, lifecycle, customer purchase basket, adoption rates, and purchase criteria

12. Geographic Landscape

12.1 Geographic segmentation

Chart on Market share by geography 2025-2030 (%)
Data Table on Market share by geography 2025-2030 (%)

12.2 Geographic comparison

Chart on Geographic comparison
Data Table on Geographic comparison

12.3 North America - Market size and forecast 2025-2030

Chart on North America - Market size and forecast 2025-2030 ($ thousand)
Data Table on North America - Market size and forecast 2025-2030 ($ thousand)
Chart on North America - Year-over-year growth 2025-2030 (%)
Data Table on North America - Year-over-year growth 2025-2030 (%)
Chart on Regional Comparison - North America
Data Table on Regional Comparison - North America

12.3.1 US - Market size and forecast 2025-2030

Chart on US - Market size and forecast 2025-2030 ($ thousand)
Data Table on US - Market size and forecast 2025-2030 ($ thousand)
Chart on US - Year-over-year growth 2025-2030 (%)
Data Table on US - Year-over-year growth 2025-2030 (%)

12.3.2 Canada - Market size and forecast 2025-2030

Chart on Canada - Market size and forecast 2025-2030 ($ thousand)
Data Table on Canada - Market size and forecast 2025-2030 ($ thousand)
Chart on Canada - Year-over-year growth 2025-2030 (%)
Data Table on Canada - Year-over-year growth 2025-2030 (%)

12.3.3 Mexico - Market size and forecast 2025-2030

Chart on Mexico - Market size and forecast 2025-2030 ($ thousand)
Data Table on Mexico - Market size and forecast 2025-2030 ($ thousand)
Chart on Mexico - Year-over-year growth 2025-2030 (%)
Data Table on Mexico - Year-over-year growth 2025-2030 (%)

12.4 Europe - Market size and forecast 2025-2030

Chart on Europe - Market size and forecast 2025-2030 ($ thousand)
Data Table on Europe - Market size and forecast 2025-2030 ($ thousand)
Chart on Europe - Year-over-year growth 2025-2030 (%)
Data Table on Europe - Year-over-year growth 2025-2030 (%)
Chart on Regional Comparison - Europe
Data Table on Regional Comparison - Europe

12.4.1 Germany - Market size and forecast 2025-2030

Chart on Germany - Market size and forecast 2025-2030 ($ thousand)
Data Table on Germany - Market size and forecast 2025-2030 ($ thousand)
Chart on Germany - Year-over-year growth 2025-2030 (%)
Data Table on Germany - Year-over-year growth 2025-2030 (%)

12.4.2 UK - Market size and forecast 2025-2030

Chart on UK - Market size and forecast 2025-2030 ($ thousand)
Data Table on UK - Market size and forecast 2025-2030 ($ thousand)
Chart on UK - Year-over-year growth 2025-2030 (%)
Data Table on UK - Year-over-year growth 2025-2030 (%)

12.4.3 France - Market size and forecast 2025-2030

Chart on France - Market size and forecast 2025-2030 ($ thousand)
Data Table on France - Market size and forecast 2025-2030 ($ thousand)
Chart on France - Year-over-year growth 2025-2030 (%)
Data Table on France - Year-over-year growth 2025-2030 (%)

12.4.4 Italy - Market size and forecast 2025-2030

Chart on Italy - Market size and forecast 2025-2030 ($ thousand)
Data Table on Italy - Market size and forecast 2025-2030 ($ thousand)
Chart on Italy - Year-over-year growth 2025-2030 (%)
Data Table on Italy - Year-over-year growth 2025-2030 (%)

12.4.5 Spain - Market size and forecast 2025-2030

Chart on Spain - Market size and forecast 2025-2030 ($ thousand)
Data Table on Spain - Market size and forecast 2025-2030 ($ thousand)
Chart on Spain - Year-over-year growth 2025-2030 (%)
Data Table on Spain - Year-over-year growth 2025-2030 (%)

12.4.6 The Netherlands - Market size and forecast 2025-2030

Chart on The Netherlands - Market size and forecast 2025-2030 ($ thousand)
Data Table on The Netherlands - Market size and forecast 2025-2030 ($ thousand)
Chart on The Netherlands - Year-over-year growth 2025-2030 (%)
Data Table on The Netherlands - Year-over-year growth 2025-2030 (%)

12.5 APAC - Market size and forecast 2025-2030

Chart on APAC - Market size and forecast 2025-2030 ($ thousand)
Data Table on APAC - Market size and forecast 2025-2030 ($ thousand)
Chart on APAC - Year-over-year growth 2025-2030 (%)
Data Table on APAC - Year-over-year growth 2025-2030 (%)
Chart on Regional Comparison - APAC
Data Table on Regional Comparison - APAC

12.5.1 China - Market size and forecast 2025-2030

Chart on China - Market size and forecast 2025-2030 ($ thousand)
Data Table on China - Market size and forecast 2025-2030 ($ thousand)
Chart on China - Year-over-year growth 2025-2030 (%)
Data Table on China - Year-over-year growth 2025-2030 (%)

12.5.2 Japan - Market size and forecast 2025-2030

Chart on Japan - Market size and forecast 2025-2030 ($ thousand)
Data Table on Japan - Market size and forecast 2025-2030 ($ thousand)
Chart on Japan - Year-over-year growth 2025-2030 (%)
Data Table on Japan - Year-over-year growth 2025-2030 (%)

12.5.3 India - Market size and forecast 2025-2030

Chart on India - Market size and forecast 2025-2030 ($ thousand)
Data Table on India - Market size and forecast 2025-2030 ($ thousand)
Chart on India - Year-over-year growth 2025-2030 (%)
Data Table on India - Year-over-year growth 2025-2030 (%)

12.5.4 South Korea - Market size and forecast 2025-2030

Chart on South Korea - Market size and forecast 2025-2030 ($ thousand)
Data Table on South Korea - Market size and forecast 2025-2030 ($ thousand)
Chart on South Korea - Year-over-year growth 2025-2030 (%)
Data Table on South Korea - Year-over-year growth 2025-2030 (%)

12.5.5 Indonesia - Market size and forecast 2025-2030

Chart on Indonesia - Market size and forecast 2025-2030 ($ thousand)
Data Table on Indonesia - Market size and forecast 2025-2030 ($ thousand)
Chart on Indonesia - Year-over-year growth 2025-2030 (%)
Data Table on Indonesia - Year-over-year growth 2025-2030 (%)

12.5.6 Australia - Market size and forecast 2025-2030

Chart on Australia - Market size and forecast 2025-2030 ($ thousand)
Data Table on Australia - Market size and forecast 2025-2030 ($ thousand)
Chart on Australia - Year-over-year growth 2025-2030 (%)
Data Table on Australia - Year-over-year growth 2025-2030 (%)

12.6 South America - Market size and forecast 2025-2030

Chart on South America - Market size and forecast 2025-2030 ($ thousand)
Data Table on South America - Market size and forecast 2025-2030 ($ thousand)
Chart on South America - Year-over-year growth 2025-2030 (%)
Data Table on South America - Year-over-year growth 2025-2030 (%)
Chart on Regional Comparison - South America
Data Table on Regional Comparison - South America

12.6.1 Brazil - Market size and forecast 2025-2030

Chart on Brazil - Market size and forecast 2025-2030 ($ thousand)
Data Table on Brazil - Market size and forecast 2025-2030 ($ thousand)
Chart on Brazil - Year-over-year growth 2025-2030 (%)
Data Table on Brazil - Year-over-year growth 2025-2030 (%)

12.6.2 Argentina - Market size and forecast 2025-2030

Chart on Argentina - Market size and forecast 2025-2030 ($ thousand)
Data Table on Argentina - Market size and forecast 2025-2030 ($ thousand)
Chart on Argentina - Year-over-year growth 2025-2030 (%)
Data Table on Argentina - Year-over-year growth 2025-2030 (%)

12.6.3 Chile - Market size and forecast 2025-2030

Chart on Chile - Market size and forecast 2025-2030 ($ thousand)
Data Table on Chile - Market size and forecast 2025-2030 ($ thousand)
Chart on Chile - Year-over-year growth 2025-2030 (%)
Data Table on Chile - Year-over-year growth 2025-2030 (%)

12.7 Middle East and Africa - Market size and forecast 2025-2030

Chart on Middle East and Africa - Market size and forecast 2025-2030 ($ thousand)
Data Table on Middle East and Africa - Market size and forecast 2025-2030 ($ thousand)
Chart on Middle East and Africa - Year-over-year growth 2025-2030 (%)
Data Table on Middle East and Africa - Year-over-year growth 2025-2030 (%)
Chart on Regional Comparison - Middle East and Africa
Data Table on Regional Comparison - Middle East and Africa

12.7.1 Saudi Arabia - Market size and forecast 2025-2030

Chart on Saudi Arabia - Market size and forecast 2025-2030 ($ thousand)
Data Table on Saudi Arabia - Market size and forecast 2025-2030 ($ thousand)
Chart on Saudi Arabia - Year-over-year growth 2025-2030 (%)
Data Table on Saudi Arabia - Year-over-year growth 2025-2030 (%)

12.7.2 UAE - Market size and forecast 2025-2030

Chart on UAE - Market size and forecast 2025-2030 ($ thousand)
Data Table on UAE - Market size and forecast 2025-2030 ($ thousand)
Chart on UAE - Year-over-year growth 2025-2030 (%)
Data Table on UAE - Year-over-year growth 2025-2030 (%)

12.7.3 South Africa - Market size and forecast 2025-2030

Chart on South Africa - Market size and forecast 2025-2030 ($ thousand)
Data Table on South Africa - Market size and forecast 2025-2030 ($ thousand)
Chart on South Africa - Year-over-year growth 2025-2030 (%)
Data Table on South Africa - Year-over-year growth 2025-2030 (%)

12.7.4 Turkey - Market size and forecast 2025-2030

Chart on Turkey - Market size and forecast 2025-2030 ($ thousand)
Data Table on Turkey - Market size and forecast 2025-2030 ($ thousand)
Chart on Turkey - Year-over-year growth 2025-2030 (%)
Data Table on Turkey - Year-over-year growth 2025-2030 (%)

12.7.5 Israel - Market size and forecast 2025-2030

Chart on Israel - Market size and forecast 2025-2030 ($ thousand)
Data Table on Israel - Market size and forecast 2025-2030 ($ thousand)
Chart on Israel - Year-over-year growth 2025-2030 (%)
Data Table on Israel - Year-over-year growth 2025-2030 (%)

12.8 Market opportunity by geography

Market opportunity by geography ($ thousand)
Data Tables on Market opportunity by geography ($ thousand)

13. Drivers, Challenges, and Opportunity

13.1 Market drivers

Escalation of environmental regulations and sustainable processing technologies
Implementation of advanced automation and industry four point zero
Expansion of automotive and luxury goods sectors

13.2 Market challenges

Environmental compliance and rigorous waste management mandates
Technological disruption from advanced synthetic material alternatives
Supply chain fragmentation and volatile raw material costs

13.3 Impact of drivers and challenges

Impact of drivers and challenges in 2025 and 2030

13.4 Market opportunities

Rise of decentralized and modular micro-tanneries
Proliferation of carbon dioxide tanning technologies
Integration of intelligent bio-based processing machinery

14. Competitive Landscape

14.1 Overview

14.2

Overview on criticality of inputs and factors of differentiation

14.3 Landscape disruption

Overview on factors of disruption

14.4 Industry risks

Impact of key risks on business

15. Competitive Analysis

15.1 Companies profiled

Companies covered

15.2 Company ranking index

15.3 Market positioning of companies

Matrix on companies position and classification

15.4 BERGI s.p.a

BERGI s.p.a - Overview
BERGI s.p.a - Product / Service
BERGI s.p.a - Key offerings
SWOT

15.5 Comerio Ercole S.p.A.

Comerio Ercole S.p.A. - Overview
Comerio Ercole S.p.A. - Product / Service
Comerio Ercole S.p.A. - Key offerings
SWOT

15.6 DMS Group S.r.l.

DMS Group S.r.l. - Overview
DMS Group S.r.l. - Product / Service
DMS Group S.r.l. - Key offerings
SWOT

15.7 Fabbri Tech S.r.l.

Fabbri Tech S.r.l. - Overview
Fabbri Tech S.r.l. - Product / Service
Fabbri Tech S.r.l. - Key offerings
SWOT

15.8 Fortuna Spezialmaschinen GmbH

Fortuna Spezialmaschinen GmbH - Overview
Fortuna Spezialmaschinen GmbH - Product / Service
Fortuna Spezialmaschinen GmbH - Key offerings
SWOT

15.9 Matic S.r.l.

Matic S.r.l. - Overview
Matic S.r.l. - Product / Service
Matic S.r.l. - Key offerings
SWOT

15.10 Mec Man S.r.l.

Mec Man S.r.l. - Overview
Mec Man S.r.l. - Product / Service
Mec Man S.r.l. - Key offerings
SWOT

15.11 Officine di Cartigliano S.p.A

Officine di Cartigliano S.p.A - Overview
Officine di Cartigliano S.p.A - Product / Service
Officine di Cartigliano S.p.A - Key offerings
SWOT

15.12 Olcina Group

Olcina Group - Overview
Olcina Group - Product / Service
Olcina Group - Key offerings
SWOT

15.13 Rizzi S.r.l.

Rizzi S.r.l. - Overview
Rizzi S.r.l. - Product / Service
Rizzi S.r.l. - Key offerings
SWOT

15.14 S.C. Costruzioni Meccaniche

S.C. Costruzioni Meccaniche - Overview
S.C. Costruzioni Meccaniche - Product / Service
S.C. Costruzioni Meccaniche - Key offerings
SWOT

15.15 Sandi Macchine S.r.l.

Sandi Macchine S.r.l. - Overview
Sandi Macchine S.r.l. - Product / Service
Sandi Macchine S.r.l. - Key offerings
SWOT

15.16 Sicom S.r.l.

Sicom S.r.l. - Overview
Sicom S.r.l. - Product / Service
Sicom S.r.l. - Key offerings
SWOT

15.17 TFL Ledertechnik GmbH

TFL Ledertechnik GmbH - Overview
TFL Ledertechnik GmbH - Product / Service
TFL Ledertechnik GmbH - Key offerings
SWOT

15.18 Turner S.p.A.

Turner S.p.A. - Overview
Turner S.p.A. - Product / Service
Turner S.p.A. - Key offerings
SWOT

16. Appendix

16.1 Scope of the report

Market definition
Objectives
Notes and caveats

16.2 Inclusions and exclusions checklist

Inclusions checklist
Exclusions checklist

16.3 Currency conversion rates for US$

16.4 Research methodology

16.5 Data procurement

Information sources

16.6 Data validation

16.7 Validation techniques employed for market sizing

16.8 Data synthesis

16.9 360 degree market analysis

16.10 List of abbreviations

Research Methodology

Technavio presents a detailed picture of the market by way of study, synthesis, and summation of data from multiple sources. The analysts have presented the various facets of the market with a particular focus on identifying the key industry influencers. The data thus presented is comprehensive, reliable, and the result of extensive research, both primary and secondary.

INFORMATION SOURCES

Primary sources

  • Manufacturers and suppliers
  • Channel partners
  • Industry experts
  • Strategic decision makers

Secondary sources

  • Industry journals and periodicals
  • Government data
  • Financial reports of key industry players
  • Historical data
  • Press releases

DATA ANALYSIS

Data Synthesis

  • Collation of data
  • Estimation of key figures
  • Analysis of derived insights

Data Validation

  • Triangulation with data models
  • Reference against proprietary databases
  • Corroboration with industry experts

REPORT WRITING

Qualitative

  • Market drivers
  • Market challenges
  • Market trends
  • Five forces analysis

Quantitative

  • Market size and forecast
  • Market segmentation
  • Geographical insights
  • Competitive landscape

Interested in this report?

Get your sample now to see our research methodology and insights!

Download Now

Frequently Asked Questions

Leather Tanning Machinery market growth will increase by USD 18362.6 thousand thousand during 2026-2030.

The Leather Tanning Machinery market is expected to grow at a CAGR of 3.4% during 2026-2030.

Leather Tanning Machinery market is segmented by Type (Light leather tanning machinery, Heavy leather tanning machinery) Application (Footwear, Leather goods, Automotive, Garments, Others) Product type (Manual, Semi-automatic, Fully automatic)

BERGI s.p.a, Carlessi S.r.l., Comerio Ercole S.p.A., DMS Group S.r.l., Fabbri Tech S.r.l., Fortuna Spezialmaschinen GmbH, Gozzini S.r.l., Matic S.r.l., Mec Man S.r.l., Officine di Cartigliano S.p.A, Olcina Group, Poletto S.r.l., Rizzi S.r.l., Rota Guido S.r.l., S.C. Costruzioni Meccaniche, Sandi Macchine S.r.l., Sicom S.r.l., Svit S.r.l., TFL Ledertechnik GmbH, Turner S.p.A. are a few of the key vendors in the Leather Tanning Machinery market.

Europe will register the highest growth rate of 33.1% among the other regions. Therefore, the Leather Tanning Machinery market in Europe is expected to garner significant business opportunities for the vendors during the forecast period.

US, Canada, Mexico, Germany, UK, France, Italy, Spain, The Netherlands, China, Japan, India, South Korea, Indonesia, Australia, Brazil, Argentina, Chile, Saudi Arabia, UAE, South Africa, Turkey, Israel

  • Escalation of environmental regulations and sustainable processing technologies is the driving factor this market.

The Leather Tanning Machinery market vendors should focus on grabbing business opportunities from the Type segment as it accounted for the largest market share in the base year.
RIA - Research AI Assistant
Ask RIA