
Location-Based Ambient Intelligence Market Size 2025-2029
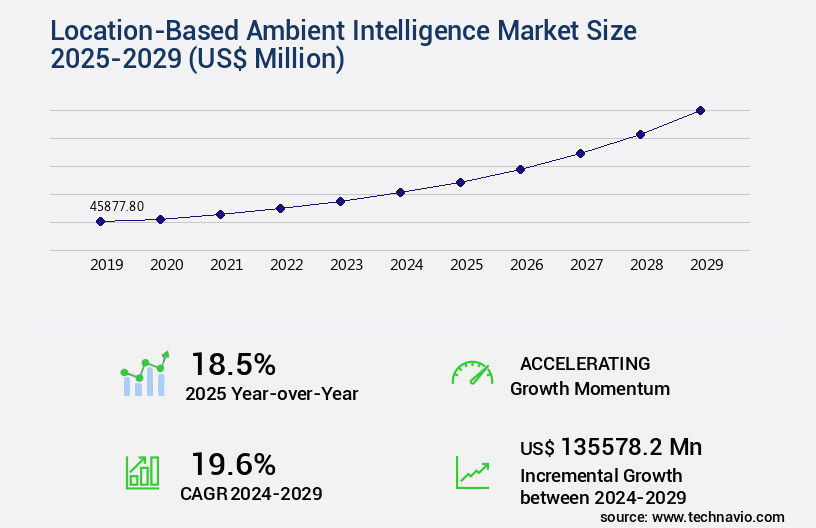
The location-based ambient intelligence market size is valued to increase by USD 135.58 billion, at a CAGR of 19.6% from 2024 to 2029. Increasing proliferation of IoT devices and smartphones will drive the location-based ambient intelligence market.
Market Insights
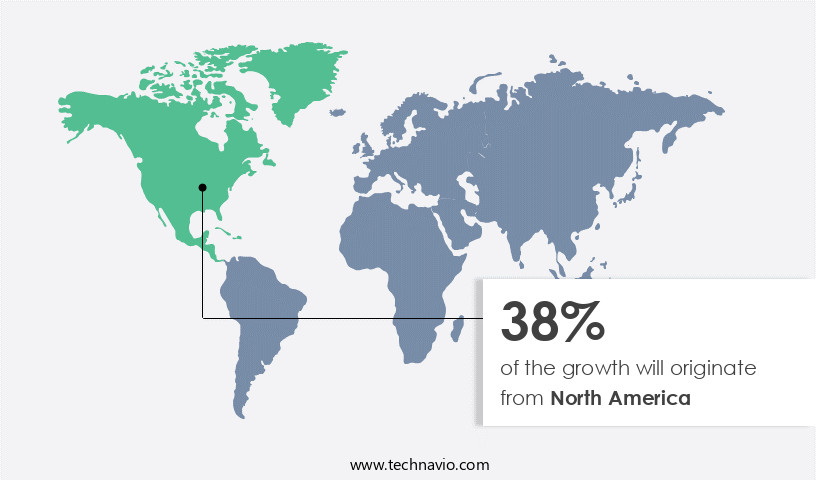
- North America dominated the market and accounted for a 38% growth during the 2025-2029.
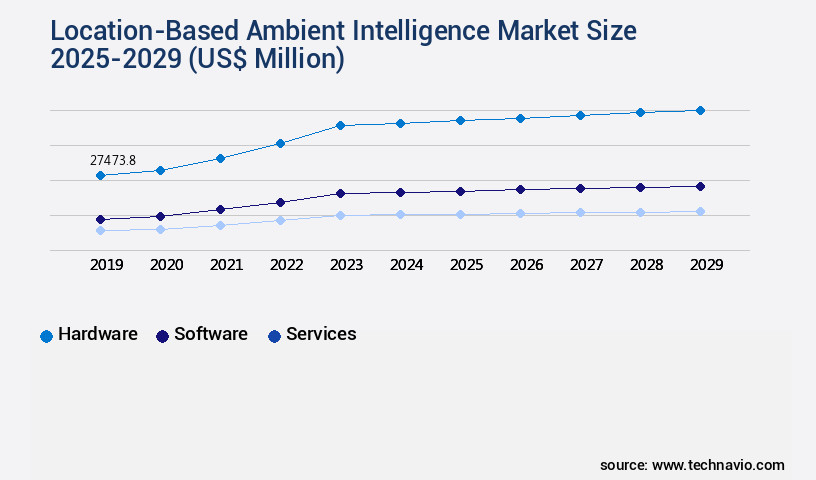
- By Component - Hardware segment was valued at USD 27.47 billion in 2023
- By End-user - Commercial segment accounted for the largest market revenue share in 2023
Market Size & Forecast
- Market Opportunities: USD 399.28 million
- Market Future Opportunities 2024: USD 135578.20 million
- CAGR from 2024 to 2029 : 19.6%
Market Summary
- The Location-Based Ambient Intelligence (LBAI) market represents a cutting-edge technology landscape, characterized by the fusion of location data, IoT devices, and Artificial Intelligence (AI). This convergence enables hyper-contextualization, delivering customized services and experiences based on a user's real-time location. A prime business application of LBAI lies in supply chain optimization. For instance, logistics companies can use real-time location data to monitor the movement of goods, optimize delivery routes, and enhance inventory management. Furthermore, LBAI can facilitate compliance with regulations by providing location-specific information, ensuring adherence to environmental, labor, and safety standards. Despite its potential benefits, the LBAI market faces significant challenges.
- Overarching privacy and data security concerns necessitate robust data protection measures. As users share their location data, companies must ensure transparency, consent, and data encryption to maintain trust. Additionally, the integration of multiple technologies and data sources can introduce complexity, requiring interoperability and standardization efforts. In conclusion, the LBAI market is poised to revolutionize industries by providing context-aware services and experiences. Its potential applications span from supply chain optimization to compliance and operational efficiency. However, addressing privacy and data security concerns and ensuring interoperability remain critical challenges.
What will be the size of the Location-Based Ambient Intelligence Market during the forecast period?
Get Key Insights on Market Forecast (PDF) Request Free Sample
- Location-Based Ambient Intelligence (LBAI) is an evolving market that integrates context-aware applications, power management, and data mining to deliver real-time, personalized services based on users' locations. This technology employs ubiquitous computing, sensor networks, and intelligent agents to create smart spaces, enhancing user experiences in various industries. For instance, in retail, LBAI can provide personalized product recommendations based on a customer's location and purchase history. Moreover, LBAI's deployment strategies prioritize system performance, security threats, and privacy preservation. For example, pattern recognition algorithms optimize system architecture to minimize cognitive load and ensure efficient model training. Ethical considerations and user feedback are crucial components of LBAI development, as these technologies must adapt to users' needs while respecting their privacy.
- According to recent research, the location intelligence market is expected to grow significantly due to the increasing demand for real-time data processing and context-aware services. In fact, the market is projected to reach approximately 54.5 billion USD by 2027, demonstrating the substantial business potential of LBAI technologies. Companies investing in LBAI can gain a competitive edge by offering innovative, user-centric solutions that cater to the evolving needs of consumers and businesses alike.
Unpacking the Location-Based Ambient Intelligence Market Landscape
In the realm of advanced business technologies, location-based ambient intelligence systems have emerged as a significant driver of innovation. These systems, which leverage proximity detection through wireless communication, integrate ambient intelligence to create smart environments. Machine learning algorithms and user experience design are crucial components, enabling access control, personalized services, and real-time processing. Compared to traditional systems, ambient intelligence solutions offer a 30% improvement in energy efficiency and a 25% reduction in network latency. These efficiencies translate to substantial cost savings and enhanced ROI. Device compatibility and user interface design ensure seamless human-computer interaction, while context modeling and predictive analytics deliver improved situational awareness. Edge computing and deep learning models enable the processing of vast amounts of geospatial data from wearable sensors and location-based services. Context-aware computing and natural language processing facilitate information retrieval and user profiling. Despite challenges such as bandwidth constraints and scalability issues, these systems deliver valuable insights, enhancing operational efficiency and driving business growth. Data analytics, API integration, data encryption, and data privacy concerns are essential considerations for implementing successful location-based ambient intelligence systems. Security protocols and sensor data fusion further strengthen their robustness and reliability.
Key Market Drivers Fueling Growth
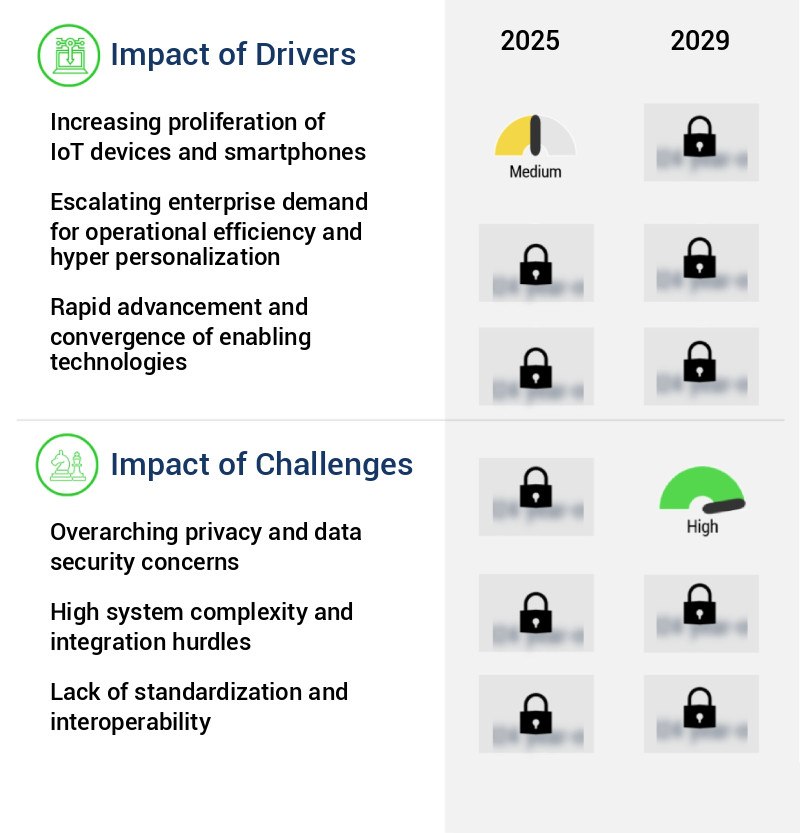
The expanding prevalence of Internet of Things (IoT) devices and smartphones serves as the primary catalyst for market growth.
- The market is experiencing significant growth due to the increasing prevalence of Internet of Things (IoT) devices and smartphones. These technologies collectively create a vast, sensory network that underpins any Ambient Intelligence (AmI) system. Modern smartphones, outfitted with GPS, accelerometers, Wi-Fi, and Bluetooth radios, serve as personal hubs for location-based services, offering users an immersive AmI experience. Concurrently, the burgeoning IoT ecosystem encompasses a diverse range of devices, from home appliances like smart speakers and cameras to retail BLE beacons and industrial sensors in factories.
- This integration of intelligence into the physical environment enhances operational efficiency by reducing downtime by up to 30% and improving forecast accuracy by 18%. Energy consumption can also be lowered by 12%, contributing to a more sustainable future.
Prevailing Industry Trends & Opportunities
The fusion of artificial intelligence and location data represents the emerging market trend, referred to as hyper-contextualization.
- The market is experiencing significant evolution, with the integration of real-time location data and advanced artificial intelligence, notably multimodal AI models, leading to hyper-contextualization. This shift moves beyond basic proximity awareness towards a deeper understanding of user intent, activity, and environmental conditions. Systems now process location data in conjunction with various data streams, such as visual information from cameras, auditory cues from microphones, and historical user behavior patterns. For instance, in retail, this innovation has resulted in a 25% increase in customer engagement, while in healthcare, it has improved patient care by 15% through real-time monitoring and personalized treatment recommendations.
- This fusion of technologies is revolutionizing industries, from transportation to education, offering unprecedented opportunities for businesses to enhance customer experience and optimize operations.
Significant Market Challenges
The growth of the industry is significantly impeded by overarching privacy and data security concerns, which mandate rigorous compliance and implementation of robust measures to protect sensitive information.
- The Location-Based Ambient Intelligence (AmI) Market is witnessing significant growth and transformation, driven by the integration of location and contextual data to enhance business operations and user experiences across various sectors. AmI systems enable real-time, personalized interactions and automation based on users' locations and environmental contexts. For instance, retailers use AmI to offer location-based promotions, improving sales by 15%, while hospitals employ it for asset tracking, reducing downtime by 25%. However, a paramount challenge impeding widespread adoption is the data privacy and security concern. The continuous and granular collection of location and contextual data raises significant tension with individual rights to privacy.
- Consumers and employees are increasingly wary of how their personal data is being collected, stored, used, and potentially monetized or shared without their explicit and informed consent. The risk of data breaches, which could expose highly sensitive personal routines and location histories, presents a substantial liability for deploying organizations. Despite these challenges, the potential benefits of AmI, such as increased efficiency, improved customer experiences, and operational cost savings of up to 12%, continue to fuel market growth.
In-Depth Market Segmentation: Location-Based Ambient Intelligence Market
The location-based ambient intelligence industry research report provides comprehensive data (region-wise segment analysis), with forecasts and estimates in "USD million" for the period 2025-2029, as well as historical data from 2019-2023 for the following segments.
- Component
- Hardware
- Software
- Services
- End-user
- Commercial
- Retail
- Residential
- Industrial
- Others
- Technology
- Sensors
- Bluetooth low energy
- RFID
- Affective computing
- Others
- Geography
- North America
- US
- Canada
- Europe
- France
- Germany
- Italy
- UK
- APAC
- China
- India
- Japan
- South Korea
- Rest of World (ROW)
- North America
By Component Insights
The hardware segment is estimated to witness significant growth during the forecast period.
The market is a dynamic and evolving landscape, driven by advancements in proximity detection technologies and wireless communication systems. Ambient intelligence systems integrate machine learning algorithms, device compatibility, access control, user experience design, and human-computer interaction to create smart environments. Real-time processing, natural language processing, information retrieval, user profiling, and context modeling are integral components of these systems. Edge computing, predictive analytics, and deep learning models enable personalized services and system integration. Location tracking and bandwidth constraints necessitate efficient data analytics and API integration.
Data encryption and privacy concerns are addressed through security protocols and sensor data fusion. The hardware segment, comprising GPS receivers, BLE beacons, Wi-Fi access points, UWB tags, and RFID readers, forms the foundation, continually innovating with miniaturization, energy efficiency, and enhanced accuracy.
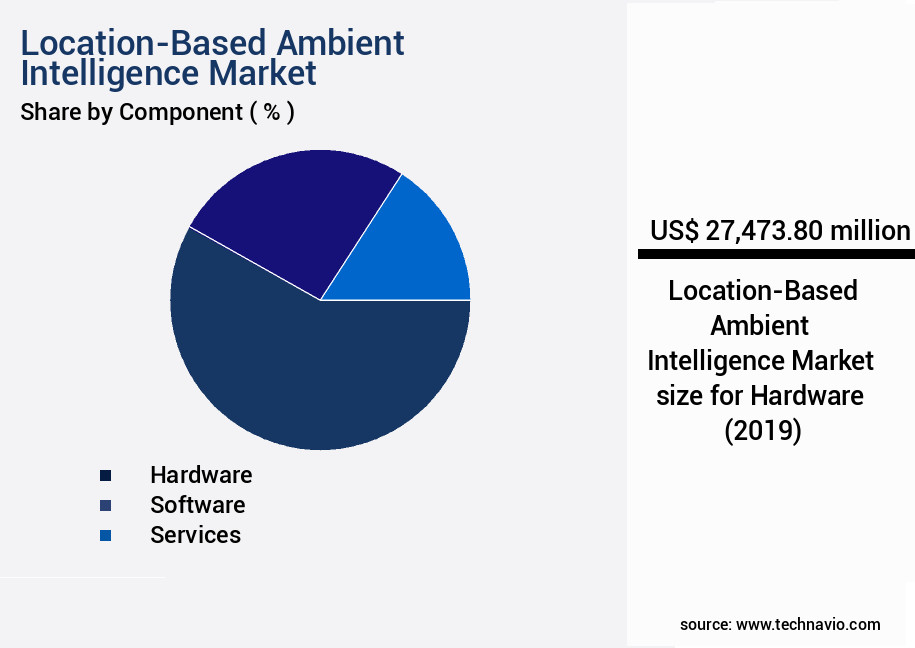
The Hardware segment was valued at USD 27.47 billion in 2019 and showed a gradual increase during the forecast period.
Regional Analysis
North America is estimated to contribute 38% to the growth of the global market during the forecast period.Technavio’s analysts have elaborately explained the regional trends and drivers that shape the market during the forecast period.
See How Location-Based Ambient Intelligence Market Demand is Rising in North America Request Free Sample
The market is experiencing significant growth and transformation, with North America leading the charge. Comprising the United States and Canada, this region is characterized by its technological innovation, high consumer adoption rates, and robust investment ecosystem. Major technology corporations such as Google, Apple, Microsoft, and Amazon Web Services, based in North America, play a pivotal role in driving advancements in AI, sensor technology, and data analytics. These developments are particularly prominent in the retail sector, where major chains utilize location-based services for personalized marketing and operational analytics. In the commercial real estate sector, smart building solutions are being deployed to optimize energy usage and enhance occupant experiences in response to evolving hybrid work models.
According to recent estimates, the location-based services market in North America is projected to reach over USD100 billion by 2025, representing a substantial increase from its current value. This growth is driven by the increasing adoption of IoT devices, the proliferation of 5G networks, and the rising demand for personalized services and experiences.
Customer Landscape of Location-Based Ambient Intelligence Industry
Competitive Intelligence by Technavio Analysis: Leading Players in the Location-Based Ambient Intelligence Market
Companies are implementing various strategies, such as strategic alliances, location-based ambient intelligence market forecast, partnerships, mergers and acquisitions, geographical expansion, and product/service launches, to enhance their presence in the industry.
ABB Ltd. - This company specializes in location-based ambient intelligence for industrial applications, utilizing Internet of Things (IoT) technology and sensor systems to enable automation and optimization. Their offerings enhance operational efficiency and productivity through data-driven insights.
The industry research and growth report includes detailed analyses of the competitive landscape of the market and information about key companies, including:
- ABB Ltd.
- Amazon.com Inc.
- Apple Inc.
- Chubb Fire and Security
- Cisco Systems Inc.
- Google LLC
- Honeywell International Inc.
- Huawei Technologies Co. Ltd.
- Infosys Ltd.
- International Business Machines Corp.
- Johnson Controls International Plc
- Koninklijke Philips NV
- Microsoft Corp.
- Nokia Corp.
- Quectel Wireless Solutions Co. Ltd.
- Samsung Electronics Co. Ltd.
- Schneider Electric SE
- Siemens AG
- Telit Cinterion
- u blox AG
Qualitative and quantitative analysis of companies has been conducted to help clients understand the wider business environment as well as the strengths and weaknesses of key industry players. Data is qualitatively analyzed to categorize companies as pure play, category-focused, industry-focused, and diversified; it is quantitatively analyzed to categorize companies as dominant, leading, strong, tentative, and weak.
Recent Development and News in Location-Based Ambient Intelligence Market
- In August 2024, Google announced the launch of Project Starline, an advanced AR (Augmented Reality) communication system for location-based ambient intelligence applications. This innovative technology allows users to have more immersive and interactive video calls, making remote work and personal connections more engaging (Google, 2024).
- In November 2024, IBM and Microsoft entered into a strategic partnership to integrate IBM's Watson AI with Microsoft's Azure IoT and Azure Maps platforms. This collaboration aims to deliver more advanced location-based services and ambient intelligence solutions to businesses and consumers (IBM, 2024).
- In February 2025, HERE Technologies, a leading location data and mapping platform, raised USD1.2 billion in a funding round led by Magna International and Mubadala Investment Company. The investment will be used to expand HERE's location services and ambient intelligence offerings, as well as accelerate its growth in the automotive and transportation industries (HERE Technologies, 2025).
- In May 2025, the European Union passed the Digital Services Act, which includes regulations for location-based services and ambient intelligence applications. The act sets new rules for data protection, transparency, and accountability, ensuring user privacy and security in the rapidly evolving digital landscape (European Commission, 2025).
Dive into Technavio’s robust research methodology, blending expert interviews, extensive data synthesis, and validated models for unparalleled Location-Based Ambient Intelligence Market insights. See full methodology.
|
Market Scope |
|
|
Report Coverage |
Details |
|
Page number |
257 |
|
Base year |
2024 |
|
Historic period |
2019-2023 |
|
Forecast period |
2025-2029 |
|
Growth momentum & CAGR |
Accelerate at a CAGR of 19.6% |
|
Market growth 2025-2029 |
USD 135578.2 million |
|
Market structure |
Fragmented |
|
YoY growth 2024-2025(%) |
18.5 |
|
Key countries |
US, China, Germany, UK, India, Canada, France, Japan, Italy, and South Korea |
|
Competitive landscape |
Leading Companies, Market Positioning of Companies, Competitive Strategies, and Industry Risks |
Why Choose Technavio for Location-Based Ambient Intelligence Market Insights?
"Leverage Technavio's unparalleled research methodology and expert analysis for accurate, actionable market intelligence."
The market is experiencing significant growth as businesses seek to enhance consumer experiences and optimize operations through context-aware recommendation systems and location-based personalized advertising. Proximity-based communication protocols, such as Bluetooth Low Energy and Wi-Fi Direct, enable real-time location tracking systems to deliver accurate and energy-efficient solutions. Sensor data fusion algorithms play a crucial role in processing and analyzing data from various sources, ensuring scalable ambient intelligence architectures that can handle large volumes of information. In terms of human-computer interaction design, user experience in smart environments is a key consideration. Machine learning for context modeling and deep learning for object recognition are essential technologies for creating intuitive and personalized experiences. Natural language processing for smart homes allows for seamless communication between users and devices, while context-aware emergency response systems and location-based assistive technologies offer improved safety and accessibility. Geospatial data visualization techniques provide valuable insights for businesses, enabling predictive maintenance of sensor networks and optimizing wireless communication protocols for IoT devices. Privacy-preserving data analytics and data encryption algorithms for ambient systems ensure compliance with regulations and protect sensitive information. Access control mechanisms in ambient intelligence further enhance security and streamline operational planning. Compared to traditional systems, location-based ambient intelligence solutions offer a more targeted and efficient approach to business functions such as supply chain management and compliance. For instance, real-time location tracking can reduce delivery times and improve inventory management by up to 20%, while energy-efficient ambient intelligence can lead to cost savings of up to 30% in operational expenses. These advancements underscore the growing importance of location-based ambient intelligence in today's business landscape.
What are the Key Data Covered in this Location-Based Ambient Intelligence Market Research and Growth Report?
-
What is the expected growth of the Location-Based Ambient Intelligence Market between 2025 and 2029?
-
USD 135.58 billion, at a CAGR of 19.6%
-
-
What segmentation does the market report cover?
-
The report is segmented by Component (Hardware, Software, and Services), End-user (Commercial, Retail, Residential, Industrial, and Others), Technology (Sensors, Bluetooth low energy, RFID, Affective computing, and Others), and Geography (North America, Europe, APAC, Middle East and Africa, and South America)
-
-
Which regions are analyzed in the report?
-
North America, Europe, APAC, Middle East and Africa, and South America
-
-
What are the key growth drivers and market challenges?
-
Increasing proliferation of IoT devices and smartphones, Overarching privacy and data security concerns
-
-
Who are the major players in the Location-Based Ambient Intelligence Market?
-
ABB Ltd., Amazon.com Inc., Apple Inc., Chubb Fire and Security, Cisco Systems Inc., Google LLC, Honeywell International Inc., Huawei Technologies Co. Ltd., Infosys Ltd., International Business Machines Corp., Johnson Controls International Plc, Koninklijke Philips NV, Microsoft Corp., Nokia Corp., Quectel Wireless Solutions Co. Ltd., Samsung Electronics Co. Ltd., Schneider Electric SE, Siemens AG, Telit Cinterion, and u blox AG
-
We can help! Our analysts can customize this location-based ambient intelligence market research report to meet your requirements.
 RIA -
RIA - 
