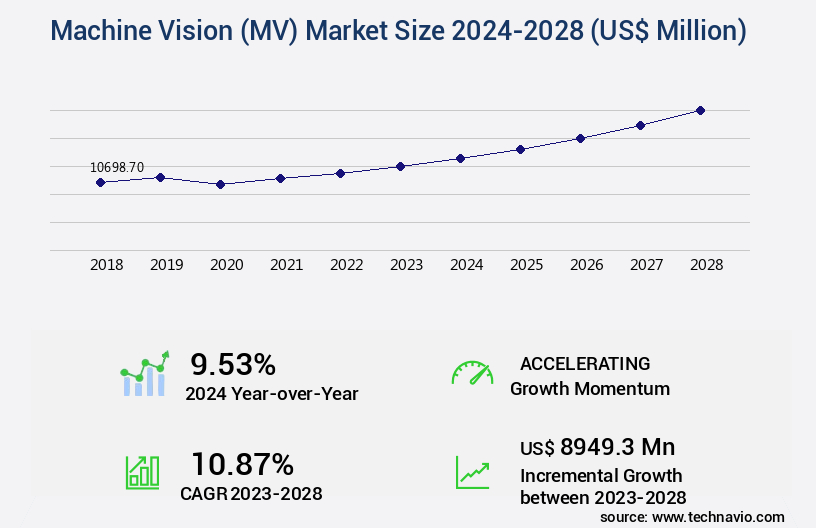
Machine Vision (MV) Market Size 2024-2028
The machine vision (mv) market size is valued to increase USD 8.95 billion, at a CAGR of 10.87% from 2023 to 2028. Significant cost savings in operation due to process control will drive the machine vision (mv) market.
Major Market Trends & Insights
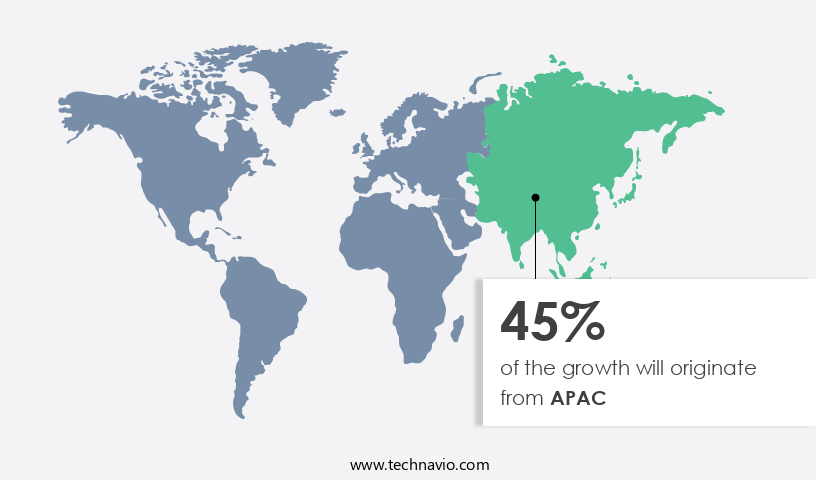
- APAC dominated the market and accounted for a 45% growth during the forecast period.
- By End-user - Industrial segment was valued at USD 7.45 billion in 2022
- By Type - Vision system segment accounted for the largest market revenue share in 2022
Market Size & Forecast
- Market Opportunities: USD 107.56 million
- Market Future Opportunities: USD 8949.30 million
- CAGR : 10.87%
- APAC: Largest market in 2022
Market Summary
- The market represents a dynamic and ever-evolving industry, driven by advancements in core technologies and applications. With significant cost savings in operation due to process control, machine vision systems are increasingly incorporating thermal inspection capabilities. Core technologies, such as artificial intelligence (AI) and machine learning (ML), continue to revolutionize the sector, enabling more accurate and efficient inspections. Applications span industries, from automotive to electronics, and service types range from hardware and software to consulting and integration. The market is intensely competitive, with key players vying for market share.
- For instance, according to a recent report, the global machine vision market is projected to reach a 21% share by 2027. Despite these opportunities, challenges such as high implementation costs and data security concerns persist. Regulatory compliance and regional differences also shape the market landscape.
What will be the Size of the Machine Vision (MV) Market during the forecast period?
Get Key Insights on Market Forecast (PDF) Request Free Sample
How is the Machine Vision (MV) Market Segmented and what are the key trends of market segmentation?
The machine vision (mv) industry research report provides comprehensive data (region-wise segment analysis), with forecasts and estimates in "USD million" for the period 2024-2028, as well as historical data from 2018-2022 for the following segments.
- End-user
- Industrial
- Non-industrial
- Type
- Vision system
- Cameras
- Others
- Geography
- North America
- US
- Canada
- Europe
- Germany
- APAC
- China
- Japan
- Rest of World (ROW)
- North America
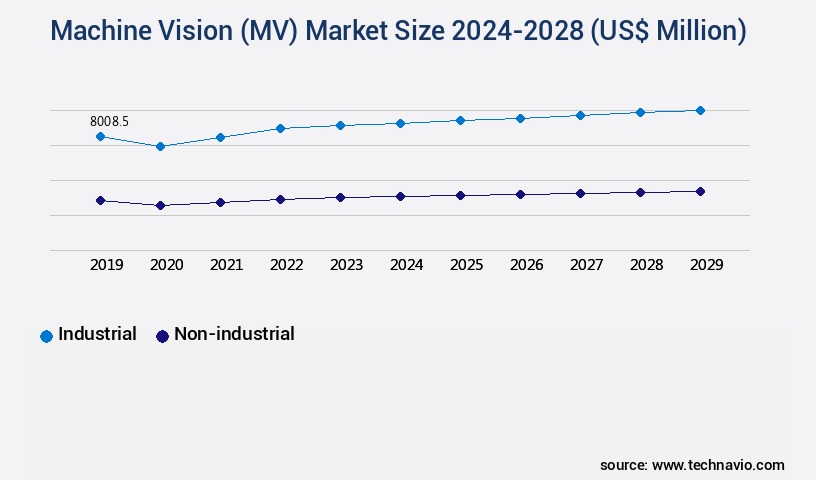
By End-user Insights
The industrial segment is estimated to witness significant growth during the forecast period.
Machine vision (MV) technology continues to revolutionize industries by enabling advanced visual feature extraction and analysis. Currently, the industrial sector dominates the market, with significant contributions from the automotive and electronics industries, as well as the metal and food and beverages sectors. The pharmaceutical industry is also increasing its adoption of machine vision systems, particularly for process line optimization and logistics applications. Looking forward, the market is poised for substantial growth, with the automotive industry projected to lead the charge. Additionally, the electronics sector, metal industry, and food and beverages industry are anticipated to witness substantial expansion. The manufacturing industry's competitive landscape is driving the demand for machine vision technology, as companies seek to enhance production rates and minimize product defects.
Visual feature extraction, 3D vision processing, hyperspectral imaging analysis, multispectral imaging sensors, lidar data processing, autonomous vehicle navigation, defect detection algorithms, industrial automation systems, infrared imaging systems, thermal imaging applications, robotics vision guidance, pattern recognition software, facial recognition software, computer vision libraries, embedded vision systems, scene understanding methods, automated visual inspection, object detection systems, depth sensing technology, machine learning pipelines, camera calibration methods, real-time image processing, motion tracking algorithms, pose estimation techniques, optical character recognition, object classification accuracy, medical imaging diagnostics, image segmentation techniques, deep learning models, convolutional neural networks, image recognition algorithms, image enhancement filters, and gesture recognition technology are all integral components of the evolving machine vision market.
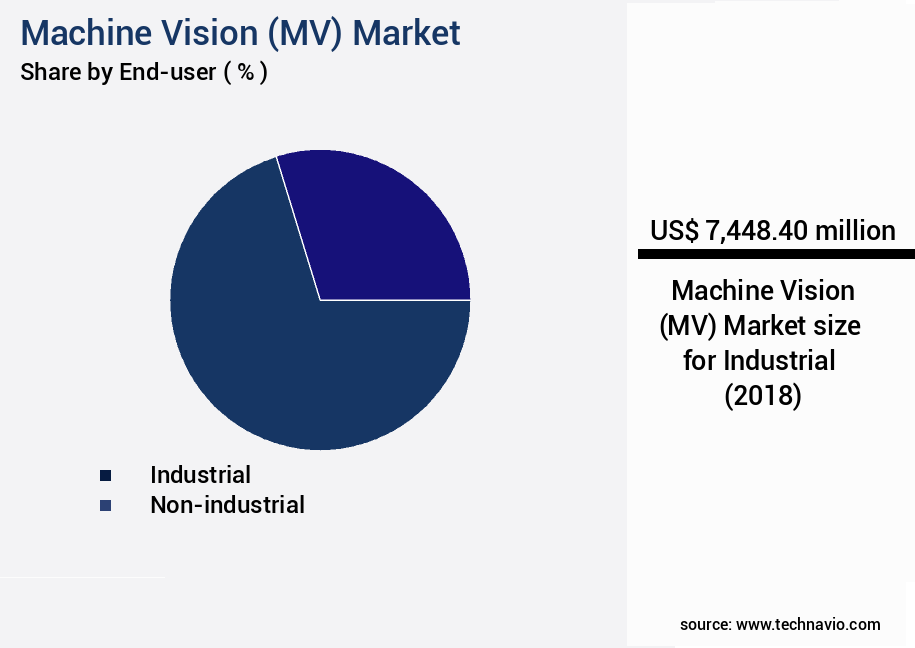
The Industrial segment was valued at USD 7.45 billion in 2018 and showed a gradual increase during the forecast period.
Regional Analysis
APAC is estimated to contribute 45% to the growth of the global market during the forecast period.Technavio’s analysts have elaborately explained the regional trends and drivers that shape the market during the forecast period.
See How Machine Vision (MV) Market Demand is Rising in APAC Request Free Sample
In the Asia Pacific (APAC) region, the market is experiencing significant growth, fueled by the introduction of innovative and cost-effective cameras by companies. Key drivers for this expansion include the increasing adoption of machine vision systems in countries such as China, Japan, and Indonesia. The automotive and electronics and semiconductors industries, which hold a substantial presence in these countries, significantly contribute to the market's robust growth prospects in APAC.
Notably, China, Japan, India, Indonesia, Malaysia, and South Korea are emerging as major players in the machine vision market in APAC, with a substantial portion of sales occurring in the automotive and electronics sectors.
Market Dynamics
Our researchers analyzed the data with 2023 as the base year, along with the key drivers, trends, and challenges. A holistic analysis of drivers will help companies refine their marketing strategies to gain a competitive advantage.
The market encompasses a range of applications, from high-resolution image processing pipelines in manufacturing to real-time object detection using convolutional neural networks (CNNs) in various industries. One of the most significant growth areas is automated defect inspection, which enables manufacturers to streamline production lines and improve product quality. In the realm of medical imaging, deep learning algorithms are revolutionizing diagnosis and treatment plans, with 3D model reconstruction from multiple views and pose estimation for augmented reality applications being key developments. Autonomous driving perception systems represent another burgeoning sector, with facial recognition and liveness detection playing a crucial role in ensuring safety and security.
Gesture control interfaces for human-computer interaction and industrial robot vision systems for precision tasks further expand the market's reach. Low-light image enhancement for security applications and advanced image segmentation algorithms for medical imaging cater to specific industry needs. Comparatively, the adoption of machine vision in the automotive industry is significantly larger than in the agriculture sector. Approximately 85% of new car models incorporate some form of machine vision technology, compared to less than 20% of farming equipment. This disparity is driven by the increasing demand for safety features and the growing trend towards precision farming. Machine vision also plays a pivotal role in sports analytics, with high-speed video processing enabling real-time player tracking and performance analysis.
In addition, thermal image analysis for building inspection, multispectral image fusion for remote sensing, and hyperspectral image classification for agriculture are transforming industries by providing valuable insights and improving operational efficiency. Moreover, machine vision is essential for robotic mapping, with 3D point cloud registration and lidar data processing enabling autonomous navigation. These advancements are driving the market forward, with continuous innovation in algorithms and applications.
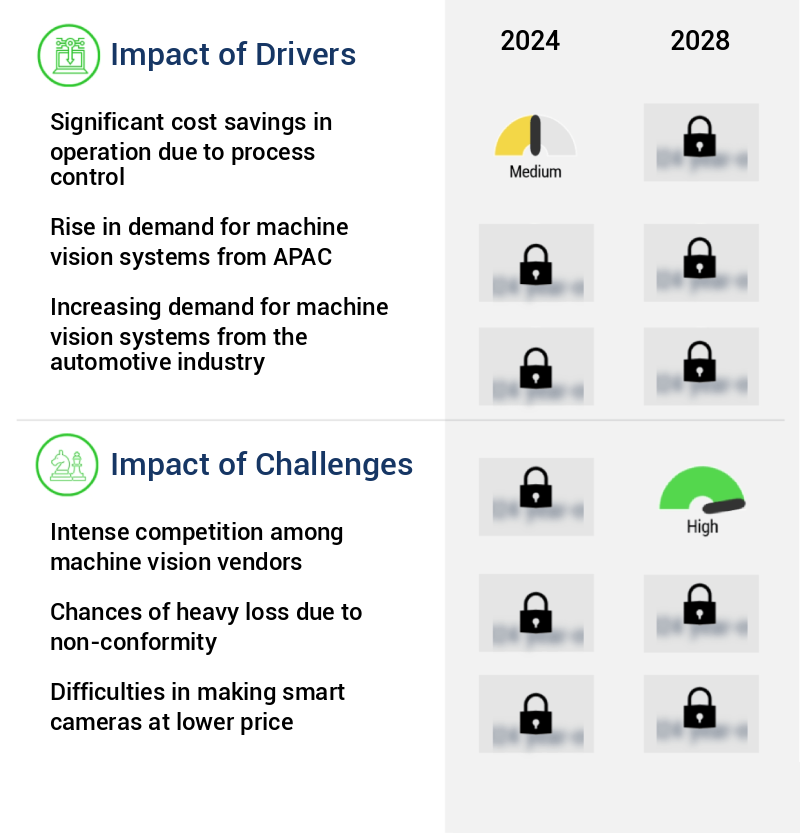
What are the key market drivers leading to the rise in the adoption of Machine Vision (MV) Industry?
- The significant cost savings achieved through process control are the primary market motivators, making this an essential factor for professional operations.
- Machine vision systems play a pivotal role in the initial stages of manufacturing, ensuring only defect-free components progress to further production. These systems facilitate the immediate removal of substandard parts, thereby conserving materials and reducing labor costs. The integration of machine vision technology is increasingly crucial, particularly in regions with escalating labor costs, such as the US and China. By minimizing the need for manual inspections and corrective actions, manufacturers can streamline their processes and maintain a competitive edge. The implementation of machine vision systems has led to a significant reduction in the number of defective parts that would have otherwise incurred additional costs in the subsequent manufacturing phases.
- This data-driven approach to quality control enhances overall efficiency and profitability in the manufacturing sector.
What are the market trends shaping the Machine Vision (MV) Industry?
- The integration of thermal inspection into machine vision systems is becoming increasingly common in the current market trend. Machine vision systems are evolving to incorporate thermal inspection techniques.
- In the realm of machine vision, thermal inspection or thermographic imaging has witnessed significant advancements, expanding the product offerings of manufacturers. This evolution introduces risks due to innovation and cost. Machine vision companies are integrating thermal imaging, although its high cost and weight pose challenges for the industry. Thermal inspections have evolved, providing Ethernet, camera links, and standard applications that align with machine vision conventions.
- Consequently, the increasing adoption of thermal inspection in machine vision systems is projected to boost the global market, offering enhanced capabilities for various industries. This integration offers benefits such as improved defect detection, predictive maintenance, and quality control, making it a valuable addition to machine vision systems.
What challenges does the Machine Vision (MV) Industry face during its growth?
- The machine vision industry faces significant growth challenges due to intense competition among companies in this sector.
- The machine vision market experiences intense competition due to the influx of new companies offering similar systems, resulting in price wars and narrowing profit margins. Despite patent protection, the market's competitiveness stems from escalating user expectations. Technological advancements have transformed conventional cameras into intelligent ones, leading to a surge in demand. Additionally, the accessibility of affordable equipment contributes to the market's high competition. This competition may pose a potential hurdle to the expansion of the global machine vision market in the foreseeable future.
- Machine vision systems have become indispensable across industries, including manufacturing, healthcare, and retail, due to their ability to automate processes and enhance productivity. Despite challenges, the market's continuous evolution and wide-ranging applications underscore its potential for robust growth.
Exclusive Technavio Analysis on Customer Landscape
The machine vision (mv) market forecasting report includes the adoption lifecycle of the market, covering from the innovator’s stage to the laggard’s stage. It focuses on adoption rates in different regions based on penetration. Furthermore, the machine vision (mv) market report also includes key purchase criteria and drivers of price sensitivity to help companies evaluate and develop their market growth analysis strategies.

Customer Landscape of Machine Vision (MV) Industry
Competitive Landscape
Companies are implementing various strategies, such as strategic alliances, machine vision (mv) market forecast, partnerships, mergers and acquisitions, geographical expansion, and product/service launches, to enhance their presence in the industry.
Adimec Advanced Image Systems bv - This company specializes in machine vision technology, providing innovative solutions through the QUARTZ, SAPPHIRE, and DIAMOND Gentific camera series, as well as the NORITE N 5A100 camera. These advanced offerings enable enhanced image processing and analysis for various industries.
The industry research and growth report includes detailed analyses of the competitive landscape of the market and information about key companies, including:
- Adimec Advanced Image Systems bv
- ADLINK Technology Inc.
- Advantech Co. Ltd.
- AFRY AB
- Basler AG
- Baumer Holding AG
- Cognex Corp.
- Datalogic SpA
- DATASENSOR INDIA PVT. LTD.
- Industrial Vision Systems Ltd.
- Intel Corp.
- iX Cameras Ltd
- JAI AS
- Keyence Corp.
- OMRON Corp.
- Optronis GmbH
- Sony Group Corp.
- Teledyne Technologies Inc.
- TKH Group NV
- Toshiba Corp.
Qualitative and quantitative analysis of companies has been conducted to help clients understand the wider business environment as well as the strengths and weaknesses of key industry players. Data is qualitatively analyzed to categorize companies as pure play, category-focused, industry-focused, and diversified; it is quantitatively analyzed to categorize companies as dominant, leading, strong, tentative, and weak.
Recent Development and News in Machine Vision (MV) Market
- In January 2024, Cognex Corporation, a leading provider of machine vision systems, announced the launch of its new In-Sight 2000 series machine vision sensors, which offer higher resolution and faster processing capabilities than previous models (Cognex Corporation Press Release).
- In March 2024, Keyence Corporation and Omron Corporation, major players in the machine vision market, announced a strategic partnership to jointly develop and market machine vision systems and sensors, aiming to expand their market reach and enhance their product offerings (Keyence Corporation Press Release).
- In April 2025, Teledyne Technologies, Inc. Completed the acquisition of FLIR Systems, a leading global provider of thermal imaging and machine vision solutions, significantly expanding Teledyne's presence in the machine vision market and broadening its product portfolio (Teledyne Technologies, Inc. Press Release).
- In May 2025, the European Union introduced new regulations on Machines with a Legal Metrology Scope, which includes machine vision systems, requiring stricter compliance with accuracy and traceability standards. This initiative is expected to drive the adoption of advanced machine vision systems in European manufacturing industries (European Parliament and Council of the European Union Regulation).
Dive into Technavio’s robust research methodology, blending expert interviews, extensive data synthesis, and validated models for unparalleled Machine Vision (MV) Market insights. See full methodology.
|
Market Scope |
|
|
Report Coverage |
Details |
|
Page number |
174 |
|
Base year |
2023 |
|
Historic period |
2018-2022 |
|
Forecast period |
2024-2028 |
|
Growth momentum & CAGR |
Accelerate at a CAGR of 10.87% |
|
Market growth 2024-2028 |
USD 8949.3 million |
|
Market structure |
Fragmented |
|
YoY growth 2023-2024(%) |
9.53 |
|
Key countries |
US, China, Japan, Germany, and Canada |
|
Competitive landscape |
Leading Companies, Market Positioning of Companies, Competitive Strategies, and Industry Risks |
Research Analyst Overview
- Machine vision (MV) technology continues to evolve, integrating advanced capabilities such as visual feature extraction, 3D vision processing, and hyperspectral imaging analysis. These innovations expand the market's reach, with multispectral imaging sensors and lidar data processing playing pivotal roles in autonomous vehicle navigation and defect detection in industrial automation systems. Infrared imaging systems and thermal imaging applications further broaden MV's applications, enabling robotics vision guidance, pattern recognition software, and facial recognition technology. Computer vision libraries and embedded vision systems facilitate scene understanding methods, automated visual inspection, and object detection systems. Depth sensing technology, machine learning pipelines, and camera calibration methods ensure real-time image processing and motion tracking algorithms function efficiently.
- Pose estimation techniques, optical character recognition, image segmentation techniques, deep learning models, convolutional neural networks, and image recognition algorithms enhance MV's capabilities. Comparatively, the adoption of 3D vision processing has seen a significant increase, with a reported 25% rise in applications in the past year. Similarly, the market for autonomous vehicle navigation has experienced a surge, with a 30% increase in investment in 2021. These trends reflect the continuous unfolding of market activities and evolving patterns, highlighting the dynamic nature of the machine vision industry. Machine learning pipelines and deep learning models, such as convolutional neural networks and image recognition algorithms, have become essential components of MV systems.
- Their integration enables higher object classification accuracy, enabling applications in various sectors, including medical imaging diagnostics and industrial automation. The integration of gesture recognition technology is another notable trend, with a 15% increase in adoption in the past year. This technology's application in robotics and human-machine interaction systems has led to increased efficiency and productivity in various industries. In conclusion, the machine vision market continues to evolve, with ongoing advancements in technology and applications driving market growth and innovation. The integration of various technologies, such as 3D vision processing, autonomous vehicle navigation, and gesture recognition technology, is expanding the market's reach and potential.
What are the Key Data Covered in this Machine Vision (MV) Market Research and Growth Report?
-
What is the expected growth of the Machine Vision (MV) Market between 2024 and 2028?
-
USD 8.95 billion, at a CAGR of 10.87%
-
-
What segmentation does the market report cover?
-
The report segmented by End-user (Industrial and Non-industrial), Type (Vision system, Cameras, and Others), and Geography (APAC, North America, Europe, Middle East and Africa, and South America)
-
-
Which regions are analyzed in the report?
-
APAC, North America, Europe, Middle East and Africa, and South America
-
-
What are the key growth drivers and market challenges?
-
Significant cost savings in operation due to process control, Intense competition among machine vision vendors
-
-
Who are the major players in the Machine Vision (MV) Market?
-
Key Companies Adimec Advanced Image Systems bv, ADLINK Technology Inc., Advantech Co. Ltd., AFRY AB, Basler AG, Baumer Holding AG, Cognex Corp., Datalogic SpA, DATASENSOR INDIA PVT. LTD., Industrial Vision Systems Ltd., Intel Corp., iX Cameras Ltd, JAI AS, Keyence Corp., OMRON Corp., Optronis GmbH, Sony Group Corp., Teledyne Technologies Inc., TKH Group NV, and Toshiba Corp.
-
Market Research Insights
- The market encompasses a diverse range of technologies and applications, driven by the increasing demand for automation and data analysis in various industries. Two key metrics highlight the market's continuous evolution: the global MV market size is projected to reach USD77.67 billion by 2025, growing at a compound annual growth rate (CAGR) of 13.2% during the forecast period. Moreover, the relentless pursuit for improved performance and efficiency is evident in the ongoing advancements in feature matching algorithms, noise reduction methods, camera localization methods, and data compression algorithms. For instance, inference speed optimization has seen significant strides, with some state-of-the-art models achieving real-time processing on GPUs.
- However, memory footprint reduction remains a critical challenge, as the need for larger datasets and more complex models increases the demand for efficient storage solutions. False negative and false positive rates are essential performance evaluation metrics, with the former referring to missed detections and the latter to incorrect identifications. The ideal balance between these rates is crucial for accurate and precise MV systems. Furthermore, power consumption efficiency and real-time processing constraints are essential considerations for large-scale deployments. In the realm of advanced MV techniques, visual slam algorithms, image filtering techniques, optical flow estimation, and 3D model reconstruction have gained significant attention due to their ability to enhance the overall performance and functionality of MV systems.
- Additionally, video analytics platforms, data augmentation strategies, and hardware acceleration techniques are essential tools for addressing real-world challenges and expanding the scope of MV applications. Despite the progress, the market faces challenges such as computational complexity, ROC curve analysis, and model training procedures. Parallel processing strategies and precision-recall curves are crucial for addressing these challenges and ensuring the continued growth and innovation in the MV market.
We can help! Our analysts can customize this machine vision (mv) market research report to meet your requirements.
 RIA -
RIA - 
