Mass Beauty Care Market Analysis APAC, Europe, North America, South America, Middle East and Africa - US, China, Japan, India, South Korea - Size and Forecast 2024-2028

Mass Beauty Care Market Analysis APAC, Europe, North America, South America, Middle East and Africa - US, China, Japan, India, South Korea - Size and Forecast 2024-2028

Published: Aug 2024 145 Pages SKU: IRTNTR72386

Market Overview at a Glance

$112.7 B
Market Opportunity
4.5%
CAGR
4.23
YoY growth 2023-2024(%)

Mass Beauty Care Market Size 2024-2028

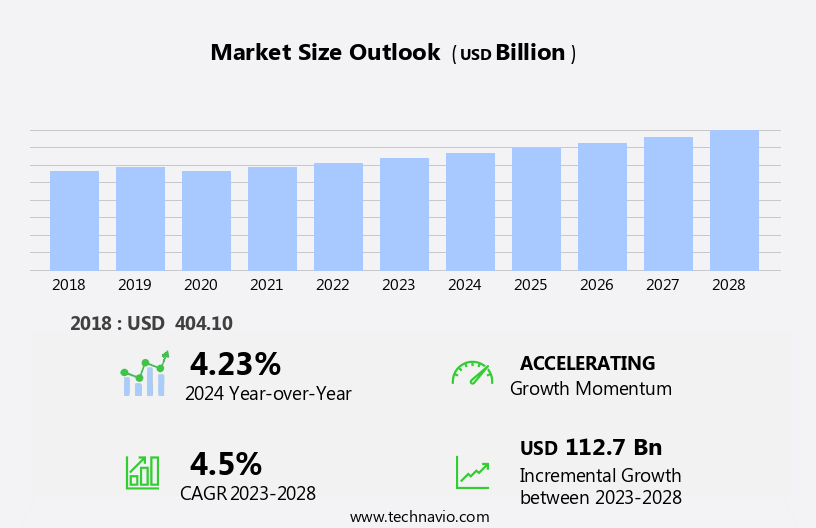
The mass beauty care market size is forecast to increase by USD 112.7 billion, at a CAGR of 4.5% between 2023 and 2028.

  • The market is experiencing significant growth, driven by modern-day lifestyle changes and the increasing prevalence of facial skin issues. Consumers are seeking effective solutions to address these concerns, leading to a surge in demand for advanced skincare products. A key trend in this market is the introduction of multifunctional products, which cater to multiple skin concerns and offer convenience to consumers. However, this market also faces challenges, including the easy availability of counterfeit products. These counterfeits not only undermine brand reputation but also pose a risk to consumer safety.
  • Companies must prioritize authenticity and transparency to build trust with their customers and differentiate themselves from competitors. To capitalize on market opportunities and navigate challenges effectively, businesses should focus on product innovation, robust supply chain management, and effective brand protection strategies.

What will be the Size of the Mass Beauty Care Market during the forecast period?

Mass Beauty Care Market Size

Explore in-depth regional segment analysis with market size data - historical 2018-2022 and forecasts 2024-2028 - in the full report.  
Request Free Sample

The market continues to evolve, driven by advancements in research and development across various sectors. One notable area of focus is the scalp microbiome balance, with clinical trial methodologies exploring its impact on hair health. Natural cosmetic ingredients, organically certified, are gaining popularity, as consumers seek safer alternatives. Collagen synthesis stimulation through dermatological testing methods is another trend, with an anticipated industry growth of 5% annually. An antioxidant delivery system, for instance, enhances the efficacy of skincare products. Exfoliation techniques, such as chemical peels or microdermabrasion, offer improved skin hydration assessment, while transdermal drug delivery systems ensure active ingredients penetrate deeper.

Sebum production regulation and UVA/UVB protection efficacy are essential components of modern formulations. Skin brightening agents, personalized skincare regimens, and cosmetic ingredient efficacy assessments are also critical. Hyaluronic acid retention, ceramide replenishment systems, and hair follicle stimulation contribute to healthier hair. Skin elasticity measurement, dermatological formulation development, and consumer product safety are ongoing concerns. Acne treatment protocols, cruelty-free cosmetics, and skin microbiome analysis are increasingly important. Product formulation stability, anti-aging peptide technology, and ingredient sourcing traceability are also key considerations. Melanin synthesis inhibition, hair shaft strengthening, and wrinkle reduction methods continue to be in demand.

How is this Mass Beauty Care Industry segmented?

The mass beauty care industry research report provides comprehensive data (region-wise segment analysis), with forecasts and estimates in "USD billion" for the period 2024-2028, as well as historical data from 2018-2022 for the following segments.

  • Distribution Channel
    • Offline
    • Online
  • Geography
    • North America
      • US
    • APAC
      • China
      • India
      • Japan
      • South Korea
    • Rest of World (ROW)

By Distribution Channel Insights

The offline segment is estimated to witness significant growth during the forecast period.

The market is experiencing significant growth, with a projected increase of 5% annually. This expansion is driven by various trends and advancements in the industry. The balance of the scalp microbiome is gaining attention, leading to the development of products that promote this harmony. Clinical trial methodology ensures the efficacy of natural cosmetic ingredients, which are increasingly preferred due to organic certification standards. Collagen synthesis stimulation and dermatological testing methods are crucial for creating effective skincare solutions. An antioxidant delivery system is essential for protecting the skin from environmental stressors. Exfoliation techniques, skin hydration assessment, and transdermal drug delivery are improving product performance.

Sebum production regulation and UVA/UVB protection efficacy are key concerns for consumers. Skin brightening agents, personalized skincare regimens, and cosmetic ingredient efficacy are essential for catering to diverse consumer needs. Hyaluronic acid retention, hair follicle stimulation, and ceramide replenishment systems are essential for maintaining healthy hair. The hair growth cycle, skin elasticity measurement, and dermatological formulation development are critical aspects of the industry. Consumer product safety, acne treatment protocols, cruelty-free cosmetics, and skin microbiome analysis are essential for building trust and loyalty. Product formulation stability, anti-aging peptide technology, and ingredient sourcing traceability are vital for ensuring quality and sustainability.

One specific example of innovation in the market is the development of a skincare line that uses probiotics to maintain scalp microbiome balance, resulting in a 30% increase in sales within the first year. These trends and advancements demonstrate the evolving dynamics and growing sophistication of the market.

Mass Beauty Care Market Size

Request Free Sample

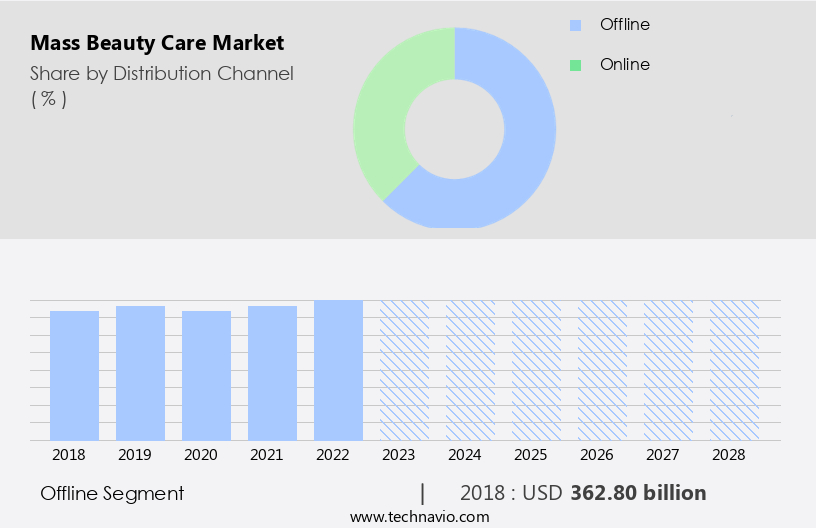
The Offline segment was valued at USD 362.80 billion in 2018 and showed a gradual increase during the forecast period.

Regional Analysis

APAC is estimated to contribute 50% to the growth of the global market during the forecast period.Technavio's analysts have elaborately explained the regional trends and drivers that shape the market during the forecast period.

Mass Beauty Care Market Share by Geography

 Request Free Sample

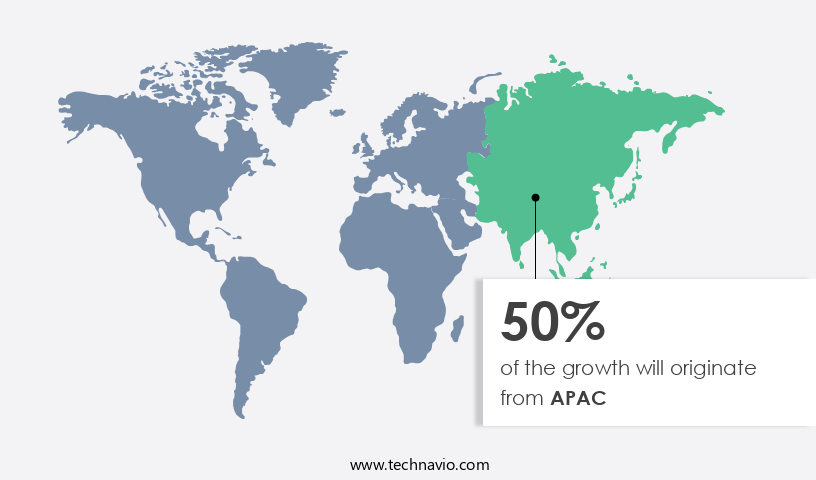
The market is experiencing significant growth, particularly in the Asia Pacific (APAC) region. The presence of a large population base, including a considerable number of middle- and low-income consumers, fuels the demand for affordable mass beauty care products in APAC. Personal grooming is increasingly seen as a necessity, rather than a luxury, driving the market's expansion. Clinical trial methodologies and dermatological testing ensure the efficacy of natural cosmetic ingredients, which are gaining popularity due to their organic certification standards. Collagen synthesis stimulation and skin hydration assessment are essential considerations in product development, as consumers seek to maintain healthy, youthful-looking skin.

Transdermal drug delivery and sebum production regulation are advanced technologies used to create effective formulations. UV protection efficacy and skin brightening agents cater to consumers' concerns for sun damage and uneven skin tone. Personalized skincare regimens, driven by cosmetic ingredient efficacy and hyaluronic acid retention, cater to individual needs. Hair care innovations include ceramide replenishment systems for hair follicle stimulation and hair growth cycle management. Skin elasticity measurement and anti-aging peptide technology address the aging process. Consumer product safety, acne treatment protocols, cruelty-free cosmetics, and skin microbiome analysis are essential considerations for companies. Product formulation stability, ingredient sourcing traceability, and skin barrier function are crucial aspects of the industry's evolution.

Melanin synthesis inhibition, hair shaft strengthening, and wrinkle reduction methods are key areas of research and development. According to a recent study, The market is projected to grow by 5% annually. For instance, sales of mass beauty care products in APAC increased by 7% last year, driven by celebrity endorsements, social media influencers, and diverse product offerings.

Market Dynamics

Our researchers analyzed the data with 2023 as the base year, along with the key drivers, trends, and challenges. A holistic analysis of drivers will help companies refine their marketing strategies to gain a competitive advantage.

What are the key market drivers leading to the rise in the adoption of Mass Beauty Care Industry?

  • The increasing prevalence of modern-day lifestyle factors leading to various facial skin concerns serves as the primary market driver. 
  • The beauty care market in the modern world is experiencing significant growth due to various lifestyle factors that contribute to an increasing prevalence of skin issues. Physically inactive lifestyles can lead to insulin resistance, which in turn increases androgen levels, causing sebum production and acne development. Lack of sleep, stress, smoking, drug abuse, and alcohol consumption are also triggers for acne, affecting both teenagers and adults. These factors can also lead to other health problems, such as diabetes, thyroid issues, polycystic ovary syndrome (PCOS), digestive imbalances, and metabolism complications. These health concerns can further exacerbate skin issues and accelerate the aging process, leading to an earlier appearance of wrinkles.
  • According to a study, the global acne treatments market is expected to grow by 6.5% annually, driven by the increasing prevalence of acne and the growing awareness of skin health\.

What are the market trends shaping the Mass Beauty Care Industry?

  • The introduction of multifunctional products is a significant market trend, reflecting consumers' increasing demand for convenience and efficiency. These products offer multiple benefits in one package, streamlining daily routines and reducing clutter.
  • In the US beauty care market, consumers prioritize facial care products that cater to both fundamental and ancillary needs, such as hydration and anti-oxidation. This preference is reflected in the increasing demand for advanced products, like Olay's anti-aging line, Olay Regenerist, despite their premium pricing. The market is expected to expand as companies introduce new multi-functional products to cater to this growing demand, contributing positively to the industry's growth.
  • For instance, Dermalogica's offerings, which promise to restore skin luminosity and enhance skin tone, are gaining popularity. According to recent studies, the US beauty care market is projected to grow by 3% in the upcoming year, underscoring the robust demand for innovative and effective products.

What challenges does the Mass Beauty Care Industry face during its growth?

  • The proliferation of counterfeit products poses a significant challenge to industry growth, requiring heightened vigilance and effective measures to ensure consumer trust and market integrity. 
  • The market faces a significant challenge from the proliferation of counterfeit products, particularly through online channels. This issue negatively impacts the sales of major companies, damaging their reputation and consumer trust. The production cost savings associated with counterfeit manufacturing, which often involves the use of substandard ingredients like petrochemicals and other harmful chemicals, fuels this trend. In regions such as Asia Pacific and the Middle East, including countries like China, India, Thailand, the UAE, Saudi Arabia, and Qatar, consumers are frequently deceived by counterfeit products that mimic the packaging and branding of established players.
  • According to industry reports, the global beauty industry is expected to grow by over 5% annually in the coming years, presenting both opportunities and challenges for market participants. For instance, a leading cosmetics company reported a 15% increase in sales after implementing stricter anti-counterfeit measures.

Exclusive Customer Landscape

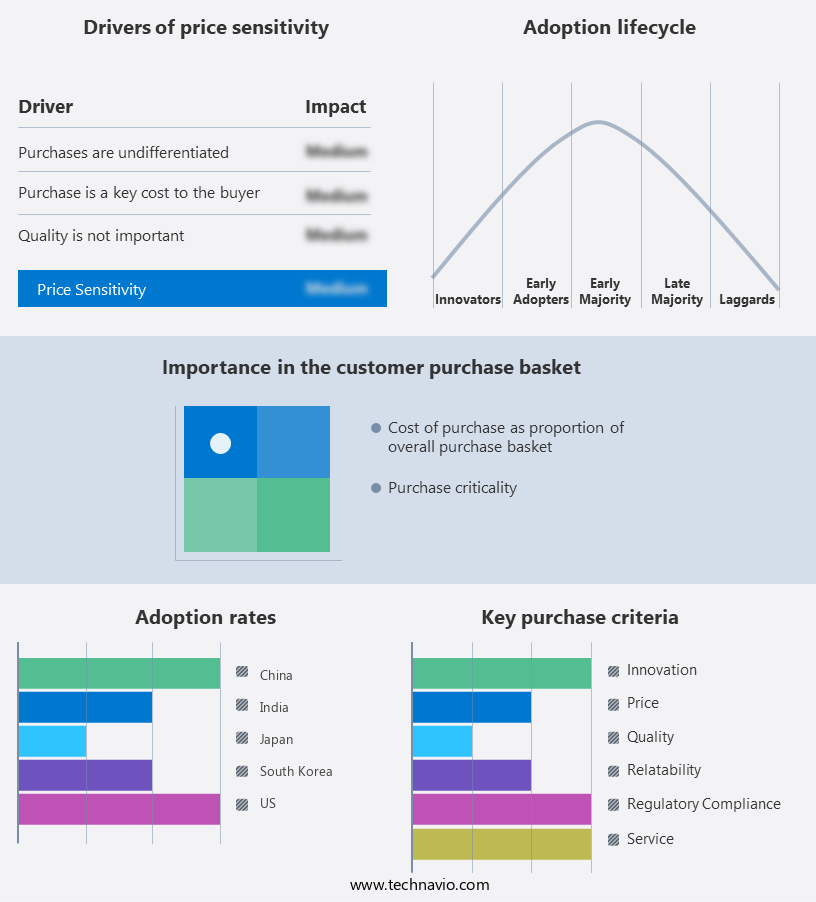
The mass beauty care market forecasting report includes the adoption lifecycle of the market, covering from the innovator's stage to the laggard's stage. It focuses on adoption rates in different regions based on penetration. Furthermore, the mass beauty care market report also includes key purchase criteria and drivers of price sensitivity to help companies evaluate and develop their market growth analysis strategies.

Mass Beauty Care Market Share by Geography

 Customer Landscape

Key Companies & Market Insights

Companies are implementing various strategies, such as strategic alliances, mass beauty care market forecast, partnerships, mergers and acquisitions, geographical expansion, and product/service launches, to enhance their presence in the industry.

Amorepacific Corp. - This company specializes in providing a diverse range of beauty care solutions, including Nivea Body shop and face care lines. 

The industry research and growth report includes detailed analyses of the competitive landscape of the market and information about key companies, including:

  • Amorepacific Corp.
  • Beiersdorf AG
  • Colgate Palmolive Co.
  • Coty Inc.
  • Emami Ltd
  • Henkel AG and Co. KGaA
  • Himalaya Global Holdings Ltd.
  • Johnson and Johnson Services Inc.
  • Kao Corp.
  • Kose Corp.
  • Loccitane International SA
  • LOreal SA
  • Natura and Co Holding SA
  • Shiseido Co. Ltd.
  • SUGAR Cosmetics
  • The Estee Lauder Companies Inc.
  • The Procter and Gamble Co.
  • Unilever PLC

Qualitative and quantitative analysis of companies has been conducted to help clients understand the wider business environment as well as the strengths and weaknesses of key industry players. Data is qualitatively analyzed to categorize companies as pure play, category-focused, industry-focused, and diversified; it is quantitatively analyzed to categorize companies as dominant, leading, strong, tentative, and weak.

Recent Development and News in Mass Beauty Care Market

  • In January 2024, L'Oréal, the world's leading cosmetics company, launched its innovative skincare product line, "Revitalift Derm-Intensives," featuring advanced hyaluronic acid technology. This launch marked a significant expansion of L'Oréal's skincare portfolio, aiming to cater to the growing demand for anti-aging products (Source: L'Oréal Press Release).
  • In March 2024, Unilever, a leading player in the market, announced a strategic partnership with Memphis Meats, a leading cellular agriculture company. The partnership aimed to explore the potential of producing sustainable, animal-free ingredients for cosmetics and personal care products (Source: Unilever Press Release).
  • In May 2024, Procter & Gamble completed the acquisition of Billie, a direct-to-consumer shaving brand, for USD 300 million. This acquisition was a strategic move to strengthen P&G's presence in the growing DTC market and expand its offerings in the women's shaving category (Source: Wall Street Journal).
  • In January 2025, the European Union approved the use of microbeads in cosmetics, reversing a previous ban due to new research showing that biodegradable microbeads could be an environmentally friendly alternative. This approval marked a significant policy change for the European market (Source: European Commission Press Release).

Research Analyst Overview

  • The market for mass beauty care continues to evolve, with innovations in postbiotic skincare, photoaging prevention, and cosmetic ingredient safety gaining significant attention. For instance, the use of prebiotics in skincare has seen a 15% increase in sales in the past year, as consumers seek products that support the skin microbiome. Moreover, the identification and mitigation of allergens is a priority, with a growing number of companies investing in sensory evaluation methods and skin sensitivity assessment. Regulatory compliance, skin aging biomarkers, and product stability testing are also crucial aspects of the industry, as consumer preference studies indicate a demand for safe, effective, and sustainable products.
  • The market is expected to grow at a steady pace, with a projected increase of 5% annually, driven by advancements in active cosmetic ingredients, skin barrier repair, and UV radiation damage prevention. Additionally, the integration of nanoparticle delivery, formulation optimization, and skin penetration enhancers is revolutionizing the industry, enabling the development of more effective and efficient skincare solutions. However, challenges such as inflammation reduction, irritant contact dermatitis, and dermatological conditions persist, necessitating ongoing research and innovation in the field. Sustainable manufacturing practices and UV radiation damage prevention are also critical areas of focus, as consumers increasingly demand eco-friendly and protective solutions.
  • Overall, the market remains a dynamic and evolving landscape, driven by consumer preferences, scientific discoveries, and regulatory requirements.

Dive into Technavio's robust research methodology, blending expert interviews, extensive data synthesis, and validated models for unparalleled Mass Beauty Care Market insights. See full methodology.

Market Scope

Report Coverage

Details

Page number

145

Base year

2023

Historic period

2018-2022

Forecast period

2024-2028

Growth momentum & CAGR

Accelerate at a CAGR of 4.5%

Market growth 2024-2028

USD 112.7 billion

Market structure

Fragmented

YoY growth 2023-2024(%)

4.23

Key countries

US, China, Japan, India, and South Korea

Competitive landscape

Leading Companies, Market Positioning of Companies, Competitive Strategies, and Industry Risks

Request Free Sample

What are the Key Data Covered in this Mass Beauty Care Market Research and Growth Report?

  • CAGR of the Mass Beauty Care industry during the forecast period
  • Detailed information on factors that will drive the growth and forecasting between 2024 and 2028
  • Precise estimation of the size of the market and its contribution of the industry in focus to the parent market
  • Accurate predictions about upcoming growth and trends and changes in consumer behaviour
  • Growth of the market across APAC, Europe, North America, South America, and Middle East and Africa
  • Thorough analysis of the market's competitive landscape and detailed information about companies
  • Comprehensive analysis of factors that will challenge the mass beauty care market growth of industry companies

We can help! Our analysts can customize this mass beauty care market research report to meet your requirements.

Get in touch

1 Executive Summary

  • 1.1 Market overview
    • Executive Summary - Chart on Market Overview
    • Executive Summary - Data Table on Market Overview
    • Executive Summary - Chart on Global Market Characteristics
    • Executive Summary - Chart on Market by Geography
    • Executive Summary - Chart on Market Segmentation by Distribution Channel
    • Executive Summary - Chart on Incremental Growth
    • Executive Summary - Data Table on Incremental Growth
    • Executive Summary - Chart on Company Market Positioning

2 Market Landscape

  • 2.1 Market ecosystem
    • Parent Market
    • Data Table on - Parent Market
  • 2.2 Market characteristics
    • Market characteristics analysis
  • 2.3 Value chain analysis
    • Value Chain Analysis

3 Market Sizing

  • 3.1 Market definition
    • Offerings of companies included in the market definition
  • 3.2 Market segment analysis
    • Market segments
  • 3.3 Market size 2023
    • 3.4 Market outlook: Forecast for 2023-2028
      • Chart on Global - Market size and forecast 2023-2028 ($ billion)
      • Data Table on Global - Market size and forecast 2023-2028 ($ billion)
      • Chart on Global Market: Year-over-year growth 2023-2028 (%)
      • Data Table on Global Market: Year-over-year growth 2023-2028 (%)

    4 Historic Market Size

    • 4.1 Global Mass Beauty Care Market 2018 - 2022
      • Historic Market Size - Data Table on Global Mass Beauty Care Market 2018 - 2022 ($ billion)
    • 4.2 Distribution Channel segment analysis 2018 - 2022
      • Historic Market Size - Distribution Channel Segment 2018 - 2022 ($ billion)
    • 4.3 Geography segment analysis 2018 - 2022
      • Historic Market Size - Geography Segment 2018 - 2022 ($ billion)
    • 4.4 Country segment analysis 2018 - 2022
      • Historic Market Size - Country Segment 2018 - 2022 ($ billion)

    5 Five Forces Analysis

    • 5.1 Five forces summary
      • Five forces analysis - Comparison between 2023 and 2028
    • 5.2 Bargaining power of buyers
      • Bargaining power of buyers - Impact of key factors 2023 and 2028
    • 5.3 Bargaining power of suppliers
      • Bargaining power of suppliers - Impact of key factors in 2023 and 2028
    • 5.4 Threat of new entrants
      • Threat of new entrants - Impact of key factors in 2023 and 2028
    • 5.5 Threat of substitutes
      • Threat of substitutes - Impact of key factors in 2023 and 2028
    • 5.6 Threat of rivalry
      • Threat of rivalry - Impact of key factors in 2023 and 2028
    • 5.7 Market condition
      • Chart on Market condition - Five forces 2023 and 2028

    6 Market Segmentation by Distribution Channel

    • 6.1 Market segments
      • Chart on Distribution Channel - Market share 2023-2028 (%)
      • Data Table on Distribution Channel - Market share 2023-2028 (%)
    • 6.2 Comparison by Distribution Channel
      • Chart on Comparison by Distribution Channel
      • Data Table on Comparison by Distribution Channel
    • 6.3 Offline - Market size and forecast 2023-2028
      • Chart on Offline - Market size and forecast 2023-2028 ($ billion)
      • Data Table on Offline - Market size and forecast 2023-2028 ($ billion)
      • Chart on Offline - Year-over-year growth 2023-2028 (%)
      • Data Table on Offline - Year-over-year growth 2023-2028 (%)
    • 6.4 Online - Market size and forecast 2023-2028
      • Chart on Online - Market size and forecast 2023-2028 ($ billion)
      • Data Table on Online - Market size and forecast 2023-2028 ($ billion)
      • Chart on Online - Year-over-year growth 2023-2028 (%)
      • Data Table on Online - Year-over-year growth 2023-2028 (%)
    • 6.5 Market opportunity by Distribution Channel
      • Market opportunity by Distribution Channel ($ billion)
      • Data Table on Market opportunity by Distribution Channel ($ billion)

    7 Customer Landscape

    • 7.1 Customer landscape overview
      • Analysis of price sensitivity, lifecycle, customer purchase basket, adoption rates, and purchase criteria

    8 Geographic Landscape

    • 8.1 Geographic segmentation
      • Chart on Market share by geography 2023-2028 (%)
      • Data Table on Market share by geography 2023-2028 (%)
    • 8.2 Geographic comparison
      • Chart on Geographic comparison
      • Data Table on Geographic comparison
    • 8.3 APAC - Market size and forecast 2023-2028
      • Chart on APAC - Market size and forecast 2023-2028 ($ billion)
      • Data Table on APAC - Market size and forecast 2023-2028 ($ billion)
      • Chart on APAC - Year-over-year growth 2023-2028 (%)
      • Data Table on APAC - Year-over-year growth 2023-2028 (%)
    • 8.4 Europe - Market size and forecast 2023-2028
      • Chart on Europe - Market size and forecast 2023-2028 ($ billion)
      • Data Table on Europe - Market size and forecast 2023-2028 ($ billion)
      • Chart on Europe - Year-over-year growth 2023-2028 (%)
      • Data Table on Europe - Year-over-year growth 2023-2028 (%)
    • 8.5 North America - Market size and forecast 2023-2028
      • Chart on North America - Market size and forecast 2023-2028 ($ billion)
      • Data Table on North America - Market size and forecast 2023-2028 ($ billion)
      • Chart on North America - Year-over-year growth 2023-2028 (%)
      • Data Table on North America - Year-over-year growth 2023-2028 (%)
    • 8.6 South America - Market size and forecast 2023-2028
      • Chart on South America - Market size and forecast 2023-2028 ($ billion)
      • Data Table on South America - Market size and forecast 2023-2028 ($ billion)
      • Chart on South America - Year-over-year growth 2023-2028 (%)
      • Data Table on South America - Year-over-year growth 2023-2028 (%)
    • 8.7 Middle East and Africa - Market size and forecast 2023-2028
      • Chart on Middle East and Africa - Market size and forecast 2023-2028 ($ billion)
      • Data Table on Middle East and Africa - Market size and forecast 2023-2028 ($ billion)
      • Chart on Middle East and Africa - Year-over-year growth 2023-2028 (%)
      • Data Table on Middle East and Africa - Year-over-year growth 2023-2028 (%)
    • 8.8 US - Market size and forecast 2023-2028
      • Chart on US - Market size and forecast 2023-2028 ($ billion)
      • Data Table on US - Market size and forecast 2023-2028 ($ billion)
      • Chart on US - Year-over-year growth 2023-2028 (%)
      • Data Table on US - Year-over-year growth 2023-2028 (%)
    • 8.9 China - Market size and forecast 2023-2028
      • Chart on China - Market size and forecast 2023-2028 ($ billion)
      • Data Table on China - Market size and forecast 2023-2028 ($ billion)
      • Chart on China - Year-over-year growth 2023-2028 (%)
      • Data Table on China - Year-over-year growth 2023-2028 (%)
    • 8.10 Japan - Market size and forecast 2023-2028
      • Chart on Japan - Market size and forecast 2023-2028 ($ billion)
      • Data Table on Japan - Market size and forecast 2023-2028 ($ billion)
      • Chart on Japan - Year-over-year growth 2023-2028 (%)
      • Data Table on Japan - Year-over-year growth 2023-2028 (%)
    • 8.11 India - Market size and forecast 2023-2028
      • Chart on India - Market size and forecast 2023-2028 ($ billion)
      • Data Table on India - Market size and forecast 2023-2028 ($ billion)
      • Chart on India - Year-over-year growth 2023-2028 (%)
      • Data Table on India - Year-over-year growth 2023-2028 (%)
    • 8.12 South Korea - Market size and forecast 2023-2028
      • Chart on South Korea - Market size and forecast 2023-2028 ($ billion)
      • Data Table on South Korea - Market size and forecast 2023-2028 ($ billion)
      • Chart on South Korea - Year-over-year growth 2023-2028 (%)
      • Data Table on South Korea - Year-over-year growth 2023-2028 (%)
    • 8.13 Market opportunity by geography
      • Market opportunity by geography ($ billion)
      • Data Tables on Market opportunity by geography ($ billion)

    9 Drivers, Challenges, and Opportunity/Restraints

    • 9.1 Market drivers
      • 9.2 Market challenges
        • 9.3 Impact of drivers and challenges
          • Impact of drivers and challenges in 2023 and 2028
        • 9.4 Market opportunities/restraints

          10 Competitive Landscape

          • 10.1 Overview
            • 10.2 Competitive Landscape
              • Overview on criticality of inputs and factors of differentiation
            • 10.3 Landscape disruption
              • Overview on factors of disruption
            • 10.4 Industry risks
              • Impact of key risks on business

            11 Competitive Analysis

            • 11.1 Companies profiled
              • Companies covered
            • 11.2 Market positioning of companies
              • Matrix on companies position and classification
            • 11.3 Beiersdorf AG
              • Beiersdorf AG - Overview
              • Beiersdorf AG - Business segments
              • Beiersdorf AG - Key news
              • Beiersdorf AG - Key offerings
              • Beiersdorf AG - Segment focus
            • 11.4 Colgate Palmolive Co.
              • Colgate Palmolive Co. - Overview
              • Colgate Palmolive Co. - Business segments
              • Colgate Palmolive Co. - Key news
              • Colgate Palmolive Co. - Key offerings
              • Colgate Palmolive Co. - Segment focus
            • 11.5 Johnson and Johnson Services Inc.
              • Johnson and Johnson Services Inc. - Overview
              • Johnson and Johnson Services Inc. - Business segments
              • Johnson and Johnson Services Inc. - Key news
              • Johnson and Johnson Services Inc. - Key offerings
              • Johnson and Johnson Services Inc. - Segment focus
            • 11.6 Kao Corp.
              • Kao Corp. - Overview
              • Kao Corp. - Business segments
              • Kao Corp. - Key news
              • Kao Corp. - Key offerings
              • Kao Corp. - Segment focus
            • 11.7 LOreal SA
              • LOreal SA - Overview
              • LOreal SA - Business segments
              • LOreal SA - Key news
              • LOreal SA - Key offerings
              • LOreal SA - Segment focus
            • 11.8 Natura and Co Holding SA
              • Natura and Co Holding SA - Overview
              • Natura and Co Holding SA - Business segments
              • Natura and Co Holding SA - Key offerings
              • Natura and Co Holding SA - Segment focus
            • 11.9 Shiseido Co. Ltd.
              • Shiseido Co. Ltd. - Overview
              • Shiseido Co. Ltd. - Product / Service
              • Shiseido Co. Ltd. - Key news
              • Shiseido Co. Ltd. - Key offerings
            • 11.10 The Estee Lauder Companies Inc.
              • The Estee Lauder Companies Inc. - Overview
              • The Estee Lauder Companies Inc. - Product / Service
              • The Estee Lauder Companies Inc. - Key news
              • The Estee Lauder Companies Inc. - Key offerings
            • 11.11 The Procter and Gamble Co.
              • The Procter and Gamble Co. - Overview
              • The Procter and Gamble Co. - Business segments
              • The Procter and Gamble Co. - Key news
              • The Procter and Gamble Co. - Key offerings
              • The Procter and Gamble Co. - Segment focus
            • 11.12 Unilever PLC
              • Unilever PLC - Overview
              • Unilever PLC - Business segments
              • Unilever PLC - Key news
              • Unilever PLC - Key offerings
              • Unilever PLC - Segment focus

            12 Appendix

            • 12.1 Scope of the report
              • 12.2 Inclusions and exclusions checklist
                • Inclusions checklist
                • Exclusions checklist
              • 12.3 Currency conversion rates for US$
                • Currency conversion rates for US$
              • 12.4 Research methodology
                • Research methodology
              • 12.5 Data procurement
                • Information sources
              • 12.6 Data validation
                • Data validation
              • 12.7 Validation techniques employed for market sizing
                • Validation techniques employed for market sizing
              • 12.8 Data synthesis
                • Data synthesis
              • 12.9 360 degree market analysis
                • 360 degree market analysis
              • 12.10 List of abbreviations
                • List of abbreviations

              Research Methodology

              Technavio presents a detailed picture of the market by way of study, synthesis, and summation of data from multiple sources. The analysts have presented the various facets of the market with a particular focus on identifying the key industry influencers. The data thus presented is comprehensive, reliable, and the result of extensive research, both primary and secondary.

              INFORMATION SOURCES

              Primary sources

              • Manufacturers and suppliers
              • Channel partners
              • Industry experts
              • Strategic decision makers

              Secondary sources

              • Industry journals and periodicals
              • Government data
              • Financial reports of key industry players
              • Historical data
              • Press releases

              DATA ANALYSIS

              Data Synthesis

              • Collation of data
              • Estimation of key figures
              • Analysis of derived insights

              Data Validation

              • Triangulation with data models
              • Reference against proprietary databases
              • Corroboration with industry experts

              REPORT WRITING

              Qualitative

              • Market drivers
              • Market challenges
              • Market trends
              • Five forces analysis

              Quantitative

              • Market size and forecast
              • Market segmentation
              • Geographical insights
              • Competitive landscape

              Interested in this report?

              Get your sample now to see our research methodology and insights!

              Download Now

              Frequently Asked Questions

              Mass Beauty Care market growth will increase by $ 112.7 bn during 2024-2028 .

              The Mass Beauty Care market is expected to grow at a CAGR of 4.5% during 2024-2028 .

              Mass Beauty Care market is segmented by Distribution Channel( Offline, Online)

              Amorepacific Corp., Beiersdorf AG, Colgate Palmolive Co., Coty Inc., Emami Ltd, Henkel AG and Co. KGaA, Himalaya Global Holdings Ltd., Johnson and Johnson Services Inc., Kao Corp., Kose Corp., Loccitane International SA, LOreal SA, Natura and Co Holding SA, Shiseido Co. Ltd., SUGAR Cosmetics, The Estee Lauder Companies Inc., The Procter and Gamble Co., Unilever PLC are a few of the key vendors in the Mass Beauty Care market.

              APAC will register the highest growth rate of 50% among the other regions. Therefore, the Mass Beauty Care market in APAC is expected to garner significant business opportunities for the vendors during the forecast period.

              US, China, Japan, India, South Korea

              • Modern-day lifestyle changes and growing facial skin-related issuesModern lifestyle changes such as physical inactivity is the driving factor this market.
              • stress is the driving factor this market.
              • lack of sleep is the driving factor this market.
              • excess fast food consumption is the driving factor this market.
              • and limited water intake are leading to a growing number of facial skin-related issues. Physically inactive people are more prone to develop insulin resistance than active individuals. Excess levels of insulin may increase the levels of androgen in the body. High androgen levels lead to increased production of sebum in the face is the driving factor this market.
              • resulting in acne development. Lack of sleep is the driving factor this market.
              • emotional and work-related stress is the driving factor this market.
              • smoking is the driving factor this market.
              • drug abuse is the driving factor this market.
              • and alcohol consumption can also cause acne is the driving factor this market.
              • both among teenagers and adults. The factors mentioned above can also lead to other health issues such as diabetes is the driving factor this market.
              • thyroid problems is the driving factor this market.
              • polycystic ovary syndrome (PCOS) is the driving factor this market.
              • digestive imbalances is the driving factor this market.
              • and metabolism complications is the driving factor this market.
              • which is the driving factor this market.
              • in turn is the driving factor this market.
              • may lead to acne development and early appearance of wrinkles. These modern-day lifestyle changes are resulting in an increasing global patient pool is the driving factor this market.
              • which is leading to a surge in the use of facial care products with functional ingredients that cater to specific needs. Some examples of such facial care products are creams with anti-wrinkle is the driving factor this market.
              • anti-aging is the driving factor this market.
              • and face-whitening properties is the driving factor this market.
              • along with products that can reduce dark circles under the eyes. is the driving factor this market.

              The Mass Beauty Care market vendors should focus on grabbing business opportunities from the Offline segment as it accounted for the largest market share in the base year.