
Mobile Virtual Network Operator (MVNO) Services Market Size 2026-2030
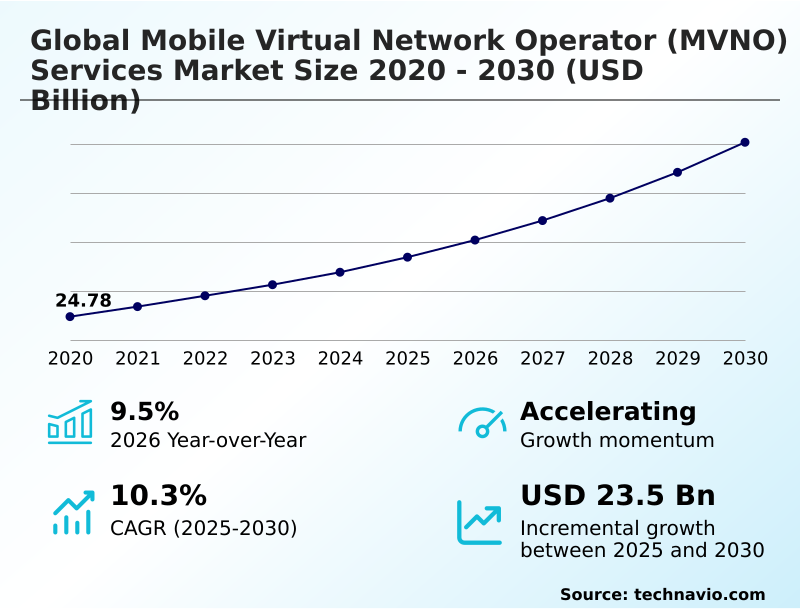
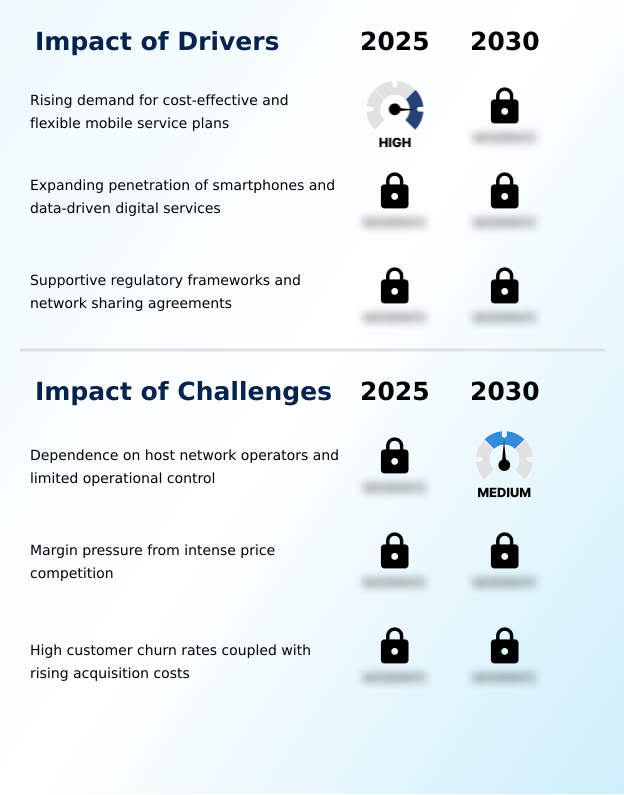
The mobile virtual network operator (mvno) services market size is valued to increase by USD 23.50 billion, at a CAGR of 10.3% from 2025 to 2030. Rising demand for cost-effective and flexible mobile service plans will drive the mobile virtual network operator (mvno) services market.
Major Market Trends & Insights
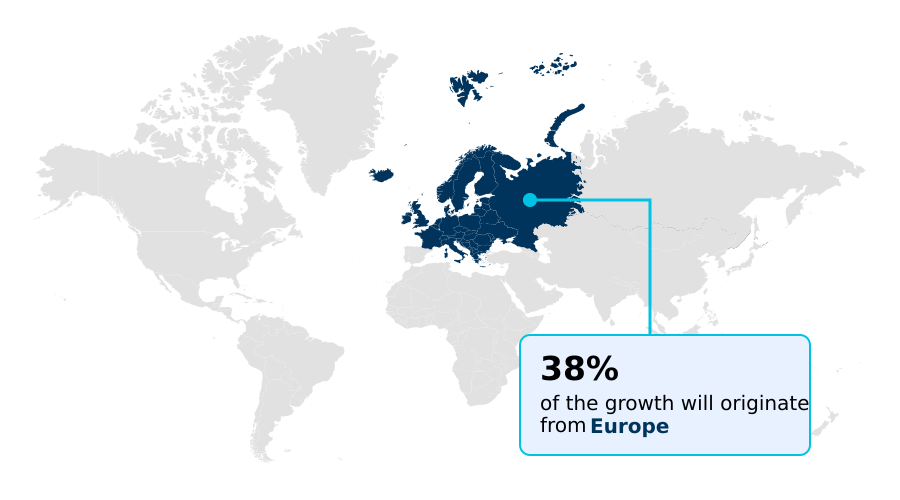
- Europe dominated the market and accounted for a 38% growth during the forecast period.
- By End-user - Consumer segment was valued at USD 17.51 billion in 2024
- By Type - Reseller MVNO segment accounted for the largest market revenue share in 2024
Market Size & Forecast
- Market Opportunities: USD 35.66 billion
- Market Future Opportunities: USD 23.50 billion
- CAGR from 2025 to 2030 : 10.3%
Market Summary
- The Mobile Virtual Network Operator (MVNO) Services Market is undergoing significant evolution, driven by the increasing need for affordable, flexible mobile plans and the rapid expansion of digital services. These operators function by leasing network capacity from established carriers, allowing them to offer competitive pricing and specialized services without the high capital costs of infrastructure ownership.
- A key trend is the focus on niche segments, such as providing tailored connectivity for IoT deployments. For example, a logistics company can partner with an MVNO for a data-only plan to manage its fleet of vehicles, gaining access to reliable, cost-effective connectivity optimized for asset tracking rather than consumer use.
- This model fosters innovation, but operators face challenges related to their dependence on host networks for service quality and intense price competition, which can compress margins. As the Mobile Virtual Network Operator (MVNO) Services Market matures, success hinges on differentiation through value-added services and operational efficiency.
What will be the Size of the Mobile Virtual Network Operator (MVNO) Services Market during the forecast period?
Get Key Insights on Market Forecast (PDF) Get Free Sample
How is the Mobile Virtual Network Operator (MVNO) Services Market Segmented?
The mobile virtual network operator (mvno) services industry research report provides comprehensive data (region-wise segment analysis), with forecasts and estimates in "USD million" for the period 2026-2030, as well as historical data from 2020-2024 for the following segments.
- End-user
- Consumer
- Enterprise
- Type
- Reseller MVNO
- Service operator MVNO
- Full MVNO
- Service type
- Voice and text MVNO
- Data only MVNO
- Bundled MVNO
- Geography
- Europe
- UK
- Germany
- France
- APAC
- China
- Japan
- India
- North America
- US
- Canada
- Mexico
- South America
- Brazil
- Argentina
- Middle East and Africa
- UAE
- Saudi Arabia
- Israel
- Rest of World (ROW)
- Europe
By End-user Insights
The consumer segment is estimated to witness significant growth during the forecast period.
The consumer segment, which accounts for just over 50% of the market, is driven by demand for flexible, cost-effective mobile services.
Providers are adopting a digital-first MVNO strategy, using app-based onboarding and AI-powered features to reduce customer acquisition costs and enhance user experience.
Intense competition has made MVNO customer churn reduction a key focus, with operators offering specialized MVNO service bundles and prepaid retail plans to improve MVNO ARPU improvement.
These prepaid MVNO plans, often targeting segments like MVNO for international travelers, are shifting away from reliance on over-the-top communication by integrating value through telecom API integration.
This approach to MVNO brand positioning helps operators stand apart from traditional quad-play bundles offered by incumbent carriers.
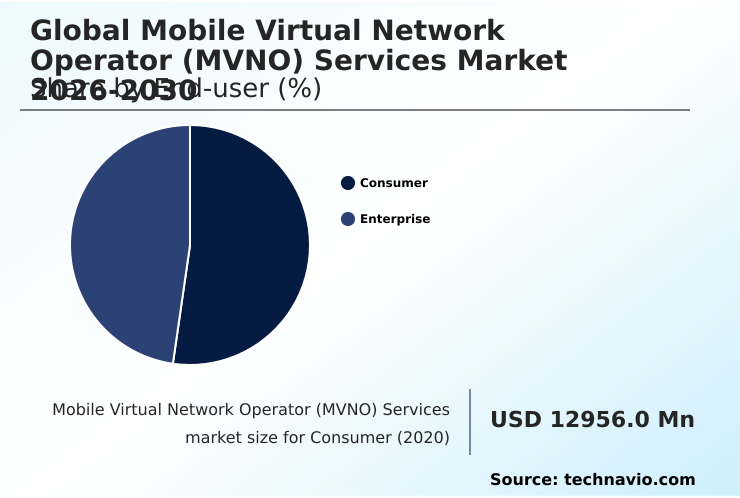
The Consumer segment was valued at USD 17.51 billion in 2024 and showed a gradual increase during the forecast period.

Regional Analysis
Europe is estimated to contribute 38% to the growth of the global market during the forecast period.Technavio’s analysts have elaborately explained the regional trends and drivers that shape the market during the forecast period.
See How Mobile Virtual Network Operator (MVNO) Services Market Demand is Rising in Europe Get Free Sample
The geographic landscape is diverse, with Europe contributing to 38% of the market's incremental growth, driven by supportive regulations and high consumer demand.
The APAC region follows, accounting for 28.6% of growth, with rapid digitalization in countries like India and China. North America remains a mature market focused on innovation. Across these regions, the adoption of advanced technologies is reshaping service delivery.
Enterprise MVNO solutions are leveraging network function virtualization and software-defined networks to offer managed connectivity services with greater flexibility.
For IoT MVNO providers, capabilities like network slicing and private APNs are essential for delivering secure, high-performance services for machine-to-machine communications and real-time asset tracking.
These offerings, including specialized MVNO data-only plans and reliable MVNO roaming partners, are critical for serving MVNO for remote workforces and enabling advanced MVNO network slicing applications.
Market Dynamics
Our researchers analyzed the data with 2025 as the base year, along with the key drivers, trends, and challenges. A holistic analysis of drivers will help companies refine their marketing strategies to gain a competitive advantage.
- Entrepreneurs asking 'how to start an MVNO business' must first develop an MVNO business plan financial model. A crucial early decision is choosing an MNO host for MVNO, as this relationship dictates wholesale costs and network quality.
- For those targeting the B2B space, designing an MVNO platform for IoT devices is a lucrative path, though it requires robust MVNO security for enterprise data. The consumer market offers opportunities with MVNO for family shared plans and data only plans for tablets, but success depends on effective MVNO marketing for niche markets.
- For instance, creating tailored MVNO for international travelers plans can capture a high-value segment. Regardless of the target, reducing customer churn in MVNOs is paramount. Operators can implement value added services to increase ARPU and use MVNO analytics for user behavior to personalize offerings. Businesses that leverage these analytics often achieve a 25% higher customer retention rate.
- The operating model, whether a light or full MVNO, also impacts strategy; the benefits of full MVNO model include greater control but higher costs. Operationally, managing wholesale costs as an MVNO and deciding how MVNOs handle customer support are key.
- Many use white label MVNO platform providers and API for MVNO service integration to streamline operations, especially when targeting the best MVNO for small business customers. Finally, understanding the evolving regulatory challenges for global MVNOs and the eSIM technology impact on MVNOs is critical for long-term viability.
What are the key market drivers leading to the rise in the adoption of Mobile Virtual Network Operator (MVNO) Services Industry?
- The rising demand for cost-effective and flexible mobile service plans is a key driver fueling market expansion.
- Market expansion is fundamentally driven by supportive MVNO regulatory frameworks and evolving MVNO business models that capitalize on the growing 5G network infrastructure.
- Favorable wholesale access agreements are key MVNO success factors, allowing new entrants to leverage host networks without massive capital outlay, although managing wholesale network costs remains a central challenge.
- The MVNO versus MNO comparison often highlights the former's agility, which is enhanced by cloud-based solutions and virtualized network functions. These technologies are crucial for deploying scalable IoT connectivity solutions and machine-to-machine communications.
- Effective MVNO partnership models, including the use of white-label MVNO platform providers, enable operators to quickly launch services with reliable roaming agreements. This ecosystem supports a variety of offerings and accelerates market entry for specialized providers.
- Firms leveraging these models report a 35% faster time-to-market.
What are the market trends shaping the Mobile Virtual Network Operator (MVNO) Services Industry?
- A prominent trend influencing the market is the strategic shift toward niche-focused service models. These are designed to target specific consumer segments with tailored offerings.
- A significant trend is the shift toward digital-first service models, driven by advancements in back-end technology. The adoption of eSIM technology is accelerating, with app-based MVNO management platforms enabling digital SIM provisioning that can reduce customer activation times by over 90% compared to physical card distribution.
- This digital-first MVNO strategy allows for greater flexibility, including multi-network switching and simplified mobile device management. Operators are focusing on increasing MVNO customer lifetime value by integrating robust business support systems and operations support systems. This facilitates the delivery of value-added MVNO services, which is a key component of MVNO brand positioning.
- By targeting niche MVNO segments with specialized offerings, providers are moving beyond price to build loyalty. This focus on eSIM for MVNOs and a seamless digital experience is becoming a primary differentiator.
What challenges does the Mobile Virtual Network Operator (MVNO) Services Industry face during its growth?
- A primary challenge affecting industry growth is the structural dependence on host network operators, which results in limited operational control.
- A primary market challenge is navigating the intense MVNO market competition and managing thin MVNO cost structures. The choice between a light MVNO vs full MVNO model significantly impacts operational control and dependency on host networks.
- While a full MVNO owns its core network infrastructure, including the home location register, and can issue its own subscriber identity module cards, it faces higher upfront costs. This dependency dictates service level agreements and overall MVNO quality of service metrics. Any degradation in the host's network directly impacts the end-user, making quality of service a persistent concern.
- Providers rely on network traffic analysis and predictive maintenance to mitigate issues, and many use MVNE platform solutions to manage complex MVNO billing systems. Ensuring robust MVNO security protocols is also critical, as failure can erode customer trust and lead to churn, with data showing that a single major service outage can increase churn by up to 15%.
Exclusive Technavio Analysis on Customer Landscape
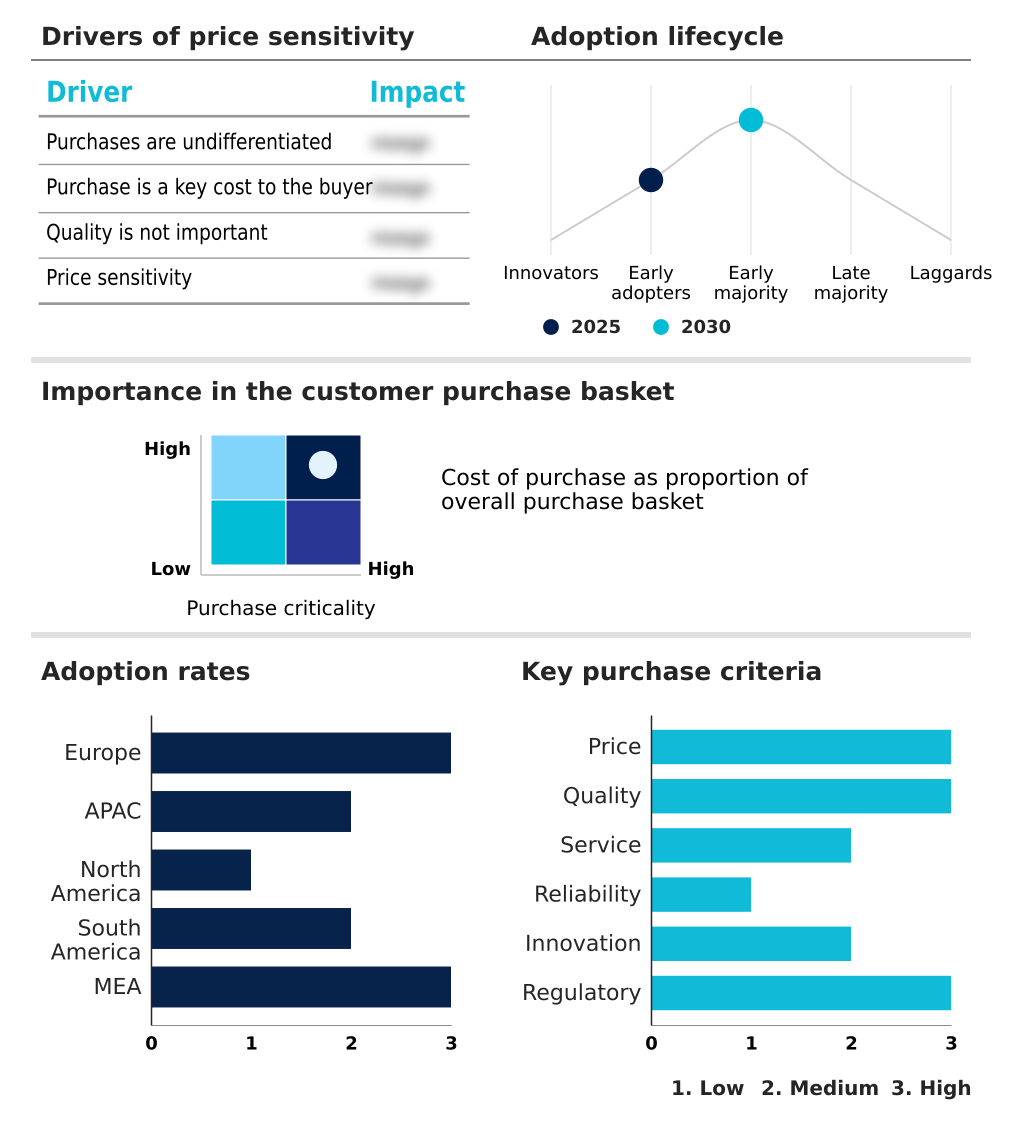
The mobile virtual network operator (mvno) services market forecasting report includes the adoption lifecycle of the market, covering from the innovator’s stage to the laggard’s stage. It focuses on adoption rates in different regions based on penetration. Furthermore, the mobile virtual network operator (mvno) services market report also includes key purchase criteria and drivers of price sensitivity to help companies evaluate and develop their market growth analysis strategies.
Customer Landscape of Mobile Virtual Network Operator (MVNO) Services Industry
Competitive Landscape
Companies are implementing various strategies, such as strategic alliances, mobile virtual network operator (mvno) services market forecast, partnerships, mergers and acquisitions, geographical expansion, and product/service launches, to enhance their presence in the industry.
AdPay Mobile Payment Pvt. Ltd. - Offerings center on flexible, no-contract plans with customized data bundles, enhanced by multi-network switching, eSIM provisioning, and value-added services for niche segments.
The industry research and growth report includes detailed analyses of the competitive landscape of the market and information about key companies, including:
- AdPay Mobile Payment Pvt. Ltd.
- Alphabet Inc.
- AT and T Inc.
- Boost Worldwide Inc.
- Comcast Corp.
- Deutsche Telekom AG
- FRiENDi
- Internet Initiative Japan Inc.
- Kajeet Inc.
- Lebara Group BV
- Red Pocket Inc.
- Tesco Mobile
- Truphone Ltd.
- Unitied Internet AG
- Verizon Communications Inc.
- Virgin Media O2
Qualitative and quantitative analysis of companies has been conducted to help clients understand the wider business environment as well as the strengths and weaknesses of key industry players. Data is qualitatively analyzed to categorize companies as pure play, category-focused, industry-focused, and diversified; it is quantitatively analyzed to categorize companies as dominant, leading, strong, tentative, and weak.
Recent Development and News in Mobile virtual network operator (mvno) services market
- In November 2024, Bharti Airtel finalized a multi-billion dollar, multi-year agreement with Nokia to enhance its 4G and 5G network capabilities across several key Indian regions, utilizing Nokia's AirScale portfolio to improve capacity and performance.
- In February 2025, China's national banking regulator mandated the use of enhanced encryption protocols for all mobile financial transactions, aiming to bolster data security across the nation's vast mobile ecosystem.
- In April 2025, Google Fi Wireless introduced its Unlimited Essentials plan, its most affordable unlimited option, offering calls, texts, and 30 GB of high-speed data in the US for $35 per month per line.
- In May 2025, Bharti Airtel partnered with Google to provide eligible postpaid and Wi-Fi customers a complimentary six-month, 100 GB Google One cloud storage subscription, which can be shared with up to five additional users.
Dive into Technavio’s robust research methodology, blending expert interviews, extensive data synthesis, and validated models for unparalleled Mobile Virtual Network Operator (MVNO) Services Market insights. See full methodology.
| Market Scope | |
|---|---|
| Page number | 290 |
| Base year | 2025 |
| Historic period | 2020-2024 |
| Forecast period | 2026-2030 |
| Growth momentum & CAGR | Accelerate at a CAGR of 10.3% |
| Market growth 2026-2030 | USD 23497.2 million |
| Market structure | Fragmented |
| YoY growth 2025-2026(%) | 9.5% |
| Key countries | UK, Germany, France, Italy, Spain, The Netherlands, China, Japan, India, South Korea, Indonesia, Australia, US, Canada, Mexico, Brazil, Argentina, Chile, UAE, Saudi Arabia, Israel, South Africa and Turkey |
| Competitive landscape | Leading Companies, Market Positioning of Companies, Competitive Strategies, and Industry Risks |
Research Analyst Overview
- The Mobile Virtual Network Operator (MVNO) Services Market is defined by a sophisticated technology stack enabling agile and specialized service delivery. Core network infrastructure, often virtualized, leverages cloud-based solutions and back-end technology, including operations support systems and business support systems. Full MVNOs manage their own home location register and issue subscriber identity module cards, giving them control over roaming agreements.
- Key technologies like eSIM technology and digital SIM provisioning are streamlining app-based onboarding, while network function virtualization and software-defined networks allow for dynamic offerings such as network slicing and private APNs. These are critical for enterprise-grade service level agreements requiring guaranteed quality of service and low-latency connections.
- For B2B applications, operators provide managed connectivity services for IoT connectivity solutions and machine-to-machine communications, enabling real-time asset tracking and predictive maintenance, which has reduced operational disruptions by over 20%.
- Success hinges on effective network traffic analysis, mobile device management, and the use of telecom API integration to offer quad-play bundles and AI-powered features, offsetting high customer acquisition costs and wholesale network costs associated with wholesale access agreements. This strategic adoption of advanced, virtualized network functions is crucial for boardroom decisions on entering high-value enterprise markets.
What are the Key Data Covered in this Mobile Virtual Network Operator (MVNO) Services Market Research and Growth Report?
-
What is the expected growth of the Mobile Virtual Network Operator (MVNO) Services Market between 2026 and 2030?
-
USD 23.50 billion, at a CAGR of 10.3%
-
-
What segmentation does the market report cover?
-
The report is segmented by End-user (Consumer, and Enterprise), Type (Reseller MVNO, Service operator MVNO, and Full MVNO), Service Type (Voice and text MVNO, Data only MVNO, and Bundled MVNO) and Geography (Europe, APAC, North America, South America, Middle East and Africa)
-
-
Which regions are analyzed in the report?
-
Europe, APAC, North America, South America and Middle East and Africa
-
-
What are the key growth drivers and market challenges?
-
Rising demand for cost-effective and flexible mobile service plans, Dependence on host network operators and limited operational control
-
-
Who are the major players in the Mobile Virtual Network Operator (MVNO) Services Market?
-
AdPay Mobile Payment Pvt. Ltd., Alphabet Inc., AT and T Inc., Boost Worldwide Inc., Comcast Corp., Deutsche Telekom AG, FRiENDi, Internet Initiative Japan Inc., Kajeet Inc., Lebara Group BV, Red Pocket Inc., Tesco Mobile, Truphone Ltd., Unitied Internet AG, Verizon Communications Inc. and Virgin Media O2
-
Market Research Insights
- The market's dynamic landscape is shaped by various MVNO business models, with a key MVNO versus MNO comparison point being operational agility. Firms adopting a digital-first MVNO strategy report customer acquisition processes that are up to 40% faster than traditional retail-based methods. An emphasis on improving MVNO customer lifetime value is driving the creation of specialized MVNO service bundles.
- For instance, integrating value-added MVNO services has been shown to improve MVNO ARPU improvement by over 15% in competitive segments. Exploring niche MVNO segments and leveraging effective MVNO partnership models are critical MVNO success factors, as providers aim to differentiate and reduce churn.
We can help! Our analysts can customize this mobile virtual network operator (mvno) services market research report to meet your requirements.
 RIA -
RIA - 
