Motor Vehicle Insurance Market Size 2024-2028
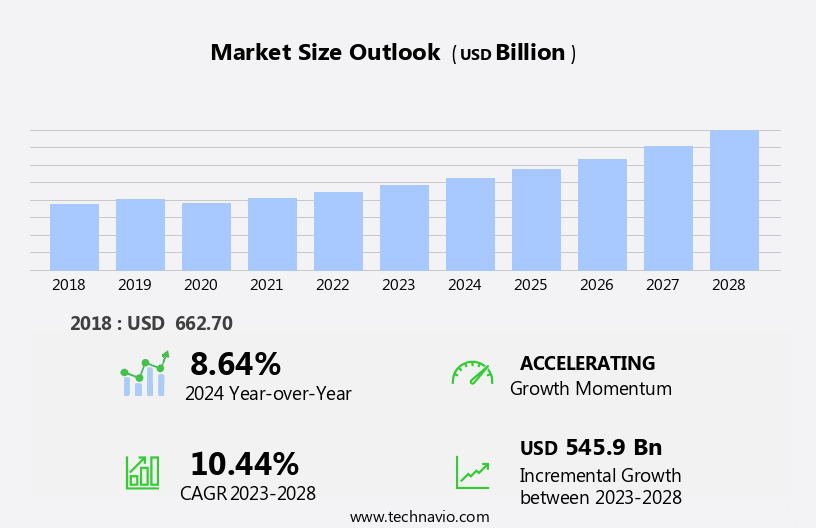
The motor vehicle insurance market size is forecast to increase by USD 545.9 billion, at a CAGR of 10.44% between 2023 and 2028.
- The market is experiencing significant shifts driven by increasing government regulations on mandatory insurance coverage in developing countries and the digitalization of the industry. These factors are shaping the market's strategic landscape, presenting both opportunities and challenges for insurance players. Government regulations in developing countries are pushing for mandatory insurance coverage, expanding the potential customer base for motor vehicle insurers. This trend is particularly noticeable in Asia Pacific and Latin America, where economic growth and urbanization are leading to increased car ownership. However, this regulatory environment also tightens the competitive landscape, as more players enter the market and compliance becomes a priority.
- Simultaneously, the digitalization of the motor vehicle insurance industry is transforming the way insurers engage with customers and manage risk. Digital platforms enable real-time underwriting, claims processing, and customer service, enhancing the overall customer experience. However, this digital shift also brings challenges, such as data security concerns and the need for robust IT infrastructure. To capitalize on opportunities and navigate challenges effectively, insurers must stay abreast of regulatory changes and invest in digital capabilities.
What will be the Size of the Motor Vehicle Insurance Market during the forecast period?

Explore in-depth regional segment analysis with market size data - historical 2018-2022 and forecasts 2024-2028 - in the full report.
Request Free Sample
The market continues to evolve, shaped by dynamic market forces and advancements in technology. AI-powered claims processing streamlines underwriting and settlement negotiations, while digital insurance platforms offer convenience and personalized pricing. Data analytics and credit scoring inform risk assessment and customer segmentation, shaping insurance regulations and product offerings. Collision coverage and liability limits are subject to ongoing adjustments, influenced by factors such as driving record and insurable interest. Third-party administrators (TPAs) and legal counsel facilitate dispute resolution, ensuring regulatory compliance and comparative negligence assessments. Fraud detection and independent verification are essential components of claims processing, with advanced predictive modeling and accident reconstruction techniques aiding in claims investigation and policy administration.
How is this Motor Vehicle Insurance Industry segmented?
The motor vehicle insurance industry research report provides comprehensive data (region-wise segment analysis), with forecasts and estimates in "USD billion" for the period 2024-2028, as well as historical data from 2018-2022 for the following segments.
- Application
- Distribution Channel
- Brokers
- Direct
- Banks
- Others
- Vehicle Age
- New Vehicles
- Old Vehicles
- New Vehicles
- Old Vehicles
- Coverage Type
- Liability Insurance
- Collision Insurance
- Comprehensive Insurance
- Geography
- North America
- Europe
- France
- Germany
- Italy
- Spain
- UK
- Middle East and Africa
- APAC
- China
- India
- Japan
- South Korea
- South America
- Rest of World (ROW)
By Application Insights
The personal segment is estimated to witness significant growth during the forecast period.
Motor vehicle insurance is a crucial financial protection for vehicle owners and drivers. The insurance policy, which is a compulsory requirement under the Motor Policy, offers coverage for both comprehensive and third-party liability packages. Personal insurance, an optional add-on cover, safeguards the owner or driver against accidental injuries. Insurance agents and brokers play a significant role in advising clients on coverage limits and policy options. Actuarial modeling and predictive analytics are used to assess risk and determine personalized pricing. Liability coverage, including property damage and bodily injury, is a key component of motor vehicle insurance. Fraud detection and independent verification are essential for dispute resolution and maintaining regulatory compliance.
Digital insurance platforms and ai-powered claims processing streamline the claims management process. Data analytics and customer segmentation help insurers tailor policies to individual needs. Usage-based insurance and mobile apps provide real-time data for risk assessment and customer retention. Insurance regulations mandate coverage for medical payments and accident reconstruction, as well as policy administration and claims processing. Policy cancellation, claims investigation, and reinstatement of policy are also important aspects of motor vehicle insurance. Comparative fault and comparative negligence are considered in settlement negotiations and claims adjudication. Expert witness testimony and legal counsel are sought in cases of bodily injury liability and claims disputes.

Request Free Sample
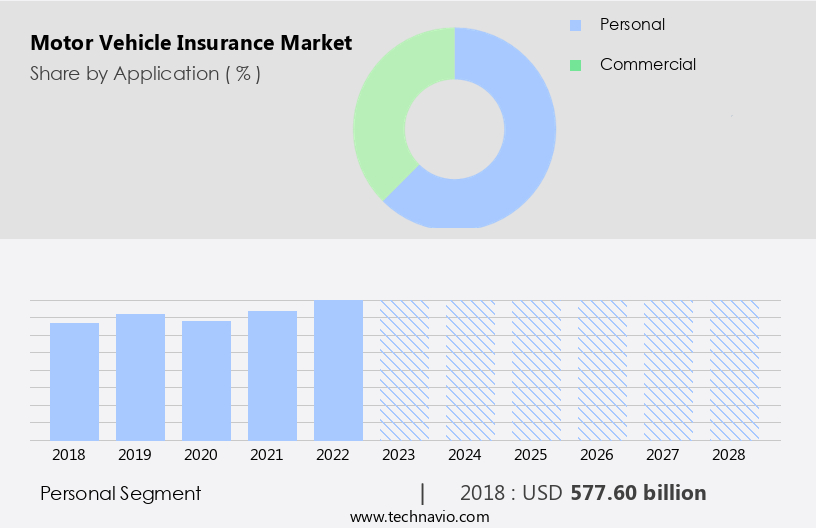
The Personal segment was valued at USD 577.60 billion in 2018 and showed a gradual increase during the forecast period.
Regional Analysis
North America is estimated to contribute 38% to the growth of the global market during the forecast period.Technavio's analysts have elaborately explained the regional trends and drivers that shape the market during the forecast period.

Request Free Sample
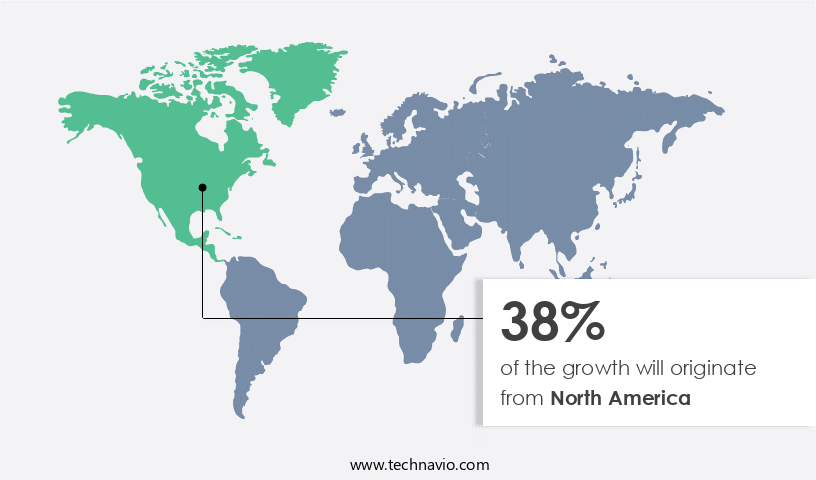
The North American the market is a substantial sector in the global insurance industry, shaped by elevated vehicle ownership rates, intricate regulatory frameworks, and innovative technology integration. The United States and Canada lead this market, with the U.S. Holding the largest market share due to its extensive population and substantial vehicle fleet. Insurers in North America employ telematics, artificial intelligence (AI), and data analytics to refine underwriting, minimize fraud, and create customized policies. Regulatory bodies, such as the National Association of Insurance Commissioners (NAIC), enforce stringent compliance standards, maintaining market equilibrium and consumer safeguards. Competition among major players, including State Farm, Allstate, and Progressive, intensifies, resulting in diverse product offerings and competitive pricing.
Actuarial modeling and predictive analytics are crucial tools for insurers to assess risk, price policies, and manage claims efficiently. Fraud detection and independent verification are integral parts of the claims process, ensuring accurate settlement negotiations. Digital insurance platforms streamline policy administration, while third-party administrators (tpas) handle claims processing and reinstatement of policies. Medical payments coverage, bodily injury liability, and property damage liability are common coverages, with collision coverage and comprehensive coverage offering additional protection. Usage-based insurance (UBI) and comparative negligence are emerging trends, enabling insurers to tailor policies based on individual driving habits and fault determination. Regulatory compliance and risk management are essential aspects of the industry, with accident reconstruction, expert witness testimony, and claims management playing vital roles in dispute resolution.
Loss ratio and combined ratio are essential metrics for insurers to evaluate underwriting performance and profitability. Policy cancellations, policy exclusions, and comparative fault are factors influencing policy renewals and customer retention. Credit scoring is another tool insurers use to assess risk and price policies. Insurers also leverage mobile apps, driver history, insurable interest, and policy administration systems to enhance customer engagement and streamline operations.
Market Dynamics
Our researchers analyzed the data with 2023 as the base year, along with the key drivers, trends, and challenges. A holistic analysis of drivers will help companies refine their marketing strategies to gain a competitive advantage.
In the dynamic and competitive the market, providers offer various coverage options to meet diverse customer needs. These include comprehensive, collision, liability, personal injury protection, uninsured motorist, underinsured motorist, and rental reimbursement insurance. Additionally, innovative solutions like telematics, usage-based insurance, and pay-as-you-go plans are transforming the industry. Consumers can compare quotes online, utilizing tools like comparison websites and insurance calculators. Factors influencing premiums include vehicle make and model, driver age, driving record, location, and coverage levels. Effective risk assessment and claims management are crucial for insurers to maintain profitability and customer satisfaction in this competitive the market.
What are the key market drivers leading to the rise in the adoption of Motor Vehicle Insurance Industry?
- In developing countries, the implementation of stringent government regulations mandating insurance coverage serves as the primary catalyst for market growth.
- In various countries, including India and China, motor vehicle insurance is a mandatory requirement for vehicles operating on public roads. For instance, in the United States, such as Maine, vehicle owners or operators must carry a minimum insurance coverage as mandated by law. This includes uninsured/underinsured motorist coverage, with a minimum of USD50,000 per person or USD100,000 per accident. The increasing economic growth in developing countries and the subsequent expansion of the automotive market are driving the growth of the market. Actuarial modeling and predictive analytics play a crucial role in determining coverage limits and setting personalized pricing for insurance policies.
- Insurance agents, brokers, and companies employ these techniques to assess risk and offer comprehensive coverage. Fraud detection and independent verification are essential components of the insurance process, ensuring fair dispute resolution. Settlement negotiations are handled professionally and efficiently, maintaining a harmonious balance between the insured and the insurer.
What are the market trends shaping the Motor Vehicle Insurance Industry?
- The digitalization of the motor vehicle insurance industry is an emerging market trend. This shift involves the integration of technology to streamline processes, enhance customer experience, and improve operational efficiency.
- The market has experienced substantial transformation in recent years due to insur digitalization. This shift has led to the development of ai-powered claims processing, digital insurance platforms, and data analytics, enhancing customer experience and retention. Insurance regulations continue to evolve, with an increasing focus on customer segmentation and credit scoring to determine premiums based on driving record and other factors. Collision coverage remains a key offering, with third-party administrators (tpas) and legal counsel playing crucial roles in claim processing and settlement.
- The combined ratio, a critical performance metric, indicates the profitability of insurers. Digitalization has enabled more immersive and harmonious interactions between customers and insurers, emphasizing convenience and personalization. The future of the motor vehicle insurance industry lies in continued innovation and adaptation to evolving customer needs and regulatory requirements.
What challenges does the Motor Vehicle Insurance Industry face during its growth?
- The insurance industry faces significant growth constraints due to the increasing regulatory scrutiny and complex compliance requirements.
- In the US the market, regulatory bodies such as the National Association of Insurance Commissioners (NAIC) play a crucial role in implementing uniform rules and regulations. The NAIC recently introduced the Own Risk and Solvency Assessment (ORSA), an internal process for insurers to evaluate their risk management capabilities. This add-on to the existing assessment framework is mandatory for insurers, agents, and insurance groups. Mobile apps have become increasingly popular in the motor vehicle insurance industry, allowing policyholders to access their driver history, manage policies, and file claims. Policy administration systems enable insurers to process applications, issue policies, and manage policy cancellations and reinstatements.
- Medical payments coverage is another essential aspect of motor vehicle insurance, providing financial assistance for medical expenses resulting from an accident. Accident reconstruction and claims investigation are critical components of the claims processing stage. Policy exclusions may apply in specific situations, limiting coverage for certain risks. Comparative fault rules determine the percentage of fault for each party involved in an accident, affecting the claims payout. In conclusion, the US the market is subject to ongoing regulatory changes and technological advancements. Regulatory bodies like the NAIC introduce new frameworks like ORSA to ensure insurers' risk management capabilities are adequate.
- Mobile apps, policy administration systems, medical payments coverage, accident reconstruction, claims investigation, and policy exclusions are essential elements of the motor vehicle insurance landscape.
Exclusive Customer Landscape
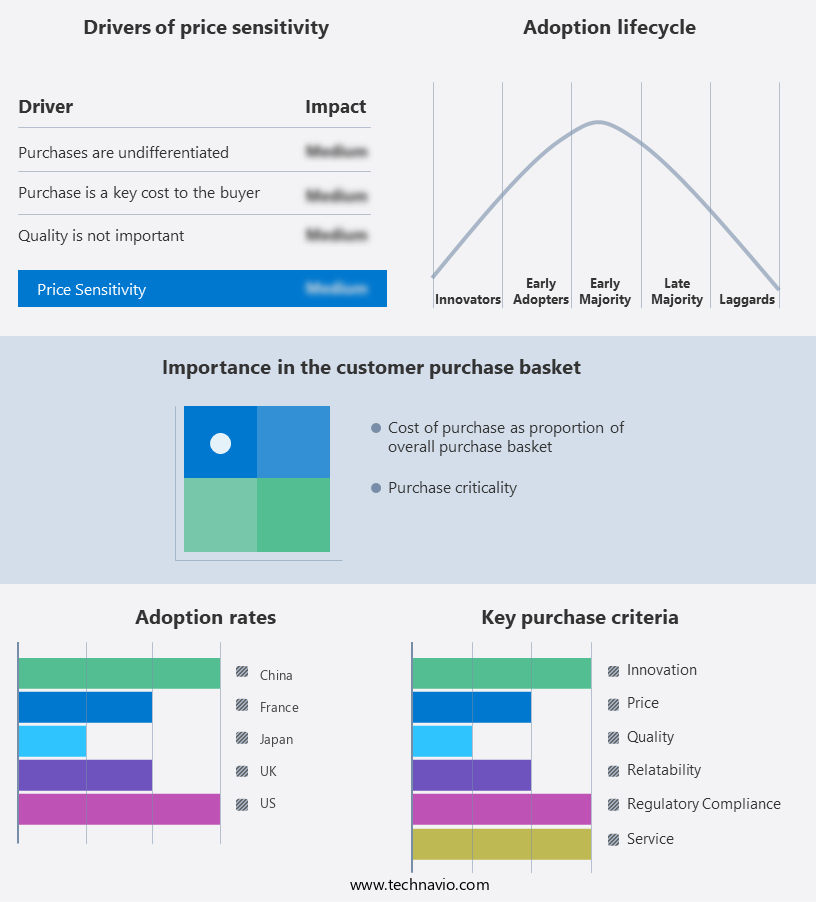
The motor vehicle insurance market forecasting report includes the adoption lifecycle of the market, covering from the innovator's stage to the laggard's stage. It focuses on adoption rates in different regions based on penetration. Furthermore, the motor vehicle insurance market report also includes key purchase criteria and drivers of price sensitivity to help companies evaluate and develop their market growth analysis strategies.

Customer Landscape
Key Companies & Market Insights
Companies are implementing various strategies, such as strategic alliances, motor vehicle insurance market forecast, partnerships, mergers and acquisitions, geographical expansion, and product/service launches, to enhance their presence in the industry.
Allstate Corporation (United States) - Bajaj Allianz, a leading insurance provider, offers motor vehicle insurance solutions.
The industry research and growth report includes detailed analyses of the competitive landscape of the market and information about key companies, including:
- Allstate Corporation (United States)
- State Farm Mutual Automobile Insurance Company (United States)
- Geico (United States)
- Progressive Corporation (United States)
- Liberty Mutual Insurance (United States)
- Zurich Insurance Group Ltd. (Switzerland)
- AXA S.A. (France)
- Allianz SE (Germany)
- Ping An Insurance Group Co., Ltd. (China)
- China Pacific Insurance Co., Ltd. (China)
- Tokio Marine Holdings Inc. (Japan)
- Sompo Japan Insurance Inc. (Japan)
- Aviva plc (United Kingdom)
- Direct Line Insurance Group plc (United Kingdom)
- RSA Insurance Group (United Kingdom)
- Mapfre S.A. (Spain)
- Erie Insurance Group (United States)
- Nationwide Mutual Insurance Company (United States)
- Travelers Companies Inc. (United States)
- AIG (United States)
Qualitative and quantitative analysis of companies has been conducted to help clients understand the wider business environment as well as the strengths and weaknesses of key industry players. Data is qualitatively analyzed to categorize companies as pure play, category-focused, industry-focused, and diversified; it is quantitatively analyzed to categorize companies as dominant, leading, strong, tentative, and weak.
Recent Development and News in Motor Vehicle Insurance Market
- In January 2024, Allstate Insurance Company announced the launch of its new telematics-based auto insurance product, "Drivewise 360," which uses both driving behavior data and vehicle data to offer personalized insurance premiums (Allstate Press Release).
- In March 2024, Liberty Mutual Insurance and State Farm Insurance, two major players in the market, formed a partnership to collaborate on data analytics and underwriting strategies, aiming to enhance their risk assessment capabilities (Liberty Mutual Press Release).
- In April 2025, Lemonade, a technology-driven insurance company, raised USD300 million in a Series E funding round, bringing its valuation to USD8 billion. The funds will be used to expand its motor vehicle insurance offerings and enhance its AI and machine learning capabilities (TechCrunch).
- In May 2025, the European Union passed the Insurance Distribution Directive 2 (IDD2), which mandates insurers to provide clearer and more detailed information to consumers, strengthens the regulatory framework for insurance intermediaries, and introduces new conduct of business rules (EU Commission Press Release).
Research Analyst Overview
- In the dynamic the market, underwriting guidelines play a crucial role in assessing risk and determining premiums. Data privacy is a significant concern, with insurers implementing robust security measures to protect policyholders' personal information from data breaches. Risk mitigation strategies, such as claims documentation and adjuster training, help insurers manage product liability, legal fees, and accident severity. Motorcycle insurance, RV insurance, and commercial auto insurance each present unique challenges, requiring specialized underwriting approaches. Insurance fraud, tort law, and contract law add complexity to the claims process, necessitating effective complaint resolution and driving habit analysis. Policy bundling, including multi-policy discounts, offers cost savings for customers.
- Mobile apps and driver history data further enhance customer engagement and risk management. Policy renewals, cancellation, and reinstatement are influenced by loss ratio, comparative fault, and claims management. Regulatory compliance and expert witness testimony are integral to maintaining a combined ratio that reflects a sustainable business model. Usage-based insurance (UBI) and policy exclusions add complexity to the market, requiring continuous risk assessment and comparative negligence evaluations. The market's continuous unfolding necessitates a robust understanding of these evolving patterns and their applications across various sectors.
- Product recall, warranty claims, and vehicle repair costs can lead to substantial financial losses, emphasizing the importance of loss prevention and cyber liability insurance. Compliance audits, workers compensation insurance, medical expenses, and fleet insurance are essential components of a comprehensive risk management strategy. Professional liability insurance shields insurers from claims related to pain and suffering and lost wages. General liability, liability for third-party property damage, and accident-related legal fees are common exposures, necessitating effective claims handling and legal expertise.
Dive into Technavio's robust research methodology, blending expert interviews, extensive data synthesis, and validated models for unparalleled Motor Vehicle Insurance Market insights. See full methodology.
|
Market Scope
|
|
Report Coverage
|
Details
|
|
Page number
|
168
|
|
Base year
|
2023
|
|
Historic period
|
2018-2022 |
|
Forecast period
|
2024-2028
|
|
Growth momentum & CAGR
|
Accelerate at a CAGR of 10.44%
|
|
Market growth 2024-2028
|
USD 545.9 billion
|
|
Market structure
|
Fragmented
|
|
YoY growth 2023-2024(%)
|
8.64
|
|
Key countries
|
US, China, Germany, Canada, India, South Korea, France, Japan, Italy, Brazil, UAE, UK, Spain, and Mexico
|
|
Competitive landscape
|
Leading Companies, Market Positioning of Companies, Competitive Strategies, and Industry Risks
|
Request Free Sample
What are the Key Data Covered in this Motor Vehicle Insurance Market Research and Growth Report?
- CAGR of the Motor Vehicle Insurance industry during the forecast period
- Detailed information on factors that will drive the growth and forecasting between 2024 and 2028
- Precise estimation of the size of the market and its contribution of the industry in focus to the parent market
- Accurate predictions about upcoming growth and trends and changes in consumer behaviour
- Growth of the market across North America, APAC, Europe, South America, and Middle East and Africa
- Thorough analysis of the market's competitive landscape and detailed information about companies
- Comprehensive analysis of factors that will challenge the motor vehicle insurance market growth of industry companies
We can help! Our analysts can customize this motor vehicle insurance market research report to meet your requirements.
Get in touch
1 Executive Summary
- 1.1 Market overview
- Executive Summary - Chart on Market Overview
- Executive Summary - Data Table on Market Overview
- Executive Summary - Chart on Global Market Characteristics
- Executive Summary - Chart on Market by Geography
- Executive Summary - Chart on Market Segmentation by Application
- Executive Summary - Chart on Market Segmentation by Distribution Channel
- Executive Summary - Chart on Incremental Growth
- Executive Summary - Data Table on Incremental Growth
- Executive Summary - Chart on Company Market Positioning
2 Market Landscape
- 2.1 Market ecosystem
- Parent Market
- Data Table on - Parent Market
- 2.2 Market characteristics
- Market characteristics analysis
3 Market Sizing
- 3.1 Market definition
- Offerings of companies included in the market definition
- 3.2 Market segment analysis
- 3.4 Market outlook: Forecast for 2023-2028
- Chart on Global - Market size and forecast 2023-2028 ($ billion)
- Data Table on Global - Market size and forecast 2023-2028 ($ billion)
- Chart on Global Market: Year-over-year growth 2023-2028 (%)
- Data Table on Global Market: Year-over-year growth 2023-2028 (%)
4 Historic Market Size
- 4.1 Global Motor Vehicle Insurance Market 2018 - 2022
- Historic Market Size - Data Table on Global Motor Vehicle Insurance Market 2018 - 2022 ($ billion)
- 4.2 Application segment analysis 2018 - 2022
- Historic Market Size - Application Segment 2018 - 2022 ($ billion)
- 4.3 Distribution Channel segment analysis 2018 - 2022
- Historic Market Size - Distribution Channel Segment 2018 - 2022 ($ billion)
- 4.4 Geography segment analysis 2018 - 2022
- Historic Market Size - Geography Segment 2018 - 2022 ($ billion)
- 4.5 Country segment analysis 2018 - 2022
- Historic Market Size - Country Segment 2018 - 2022 ($ billion)
5 Five Forces Analysis
- 5.1 Five forces summary
- Five forces analysis - Comparison between 2023 and 2028
- 5.2 Bargaining power of buyers
- Bargaining power of buyers - Impact of key factors 2023 and 2028
- 5.3 Bargaining power of suppliers
- Bargaining power of suppliers - Impact of key factors in 2023 and 2028
- 5.4 Threat of new entrants
- Threat of new entrants - Impact of key factors in 2023 and 2028
- 5.5 Threat of substitutes
- Threat of substitutes - Impact of key factors in 2023 and 2028
- 5.6 Threat of rivalry
- Threat of rivalry - Impact of key factors in 2023 and 2028
- 5.7 Market condition
- Chart on Market condition - Five forces 2023 and 2028
6 Market Segmentation by Application
- 6.1 Market segments
- Chart on Application - Market share (2023-2028) (%)
- Data Table on Application - Market share (2023-2028) (%)
- 6.2 Comparison by Application
- Chart on Comparison by Application
- Data Table on Comparison by Application
- 6.3 Personal - Market size and forecast (2023-2028)
- Chart on Personal - Market size and forecast (2023-2028) ($ billion)
- Data Table on Personal - Market size and forecast (2023-2028) ($ billion)
- Chart on Personal - Year-over-year growth (2023-2028) (%)
- Data Table on Personal - Year-over-year growth (2023-2028) (%)
- 6.4 Commercial - Market size and forecast (2023-2028)
- Chart on Commercial - Market size and forecast (2023-2028) ($ billion)
- Data Table on Commercial - Market size and forecast (2023-2028) ($ billion)
- Chart on Commercial - Year-over-year growth (2023-2028) (%)
- Data Table on Commercial - Year-over-year growth (2023-2028) (%)
- 6.5 Market opportunity by Application
- Market opportunity by Application ($ billion)
- Data Table on Market opportunity by Application ($ billion)
7 Market Segmentation by Distribution Channel
- 7.1 Market segments
- Chart on Distribution Channel - Market share (2023-2028) (%)
- Data Table on Distribution Channel - Market share (2023-2028) (%)
- 7.2 Comparison by Distribution Channel
- Chart on Comparison by Distribution Channel
- Data Table on Comparison by Distribution Channel
- 7.3 Brokers - Market size and forecast (2023-2028)
- Chart on Brokers - Market size and forecast (2023-2028) ($ billion)
- Data Table on Brokers - Market size and forecast (2023-2028) ($ billion)
- Chart on Brokers - Year-over-year growth (2023-2028) (%)
- Data Table on Brokers - Year-over-year growth (2023-2028) (%)
- 7.4 Direct - Market size and forecast (2023-2028)
- Chart on Direct - Market size and forecast (2023-2028) ($ billion)
- Data Table on Direct - Market size and forecast (2023-2028) ($ billion)
- Chart on Direct - Year-over-year growth (2023-2028) (%)
- Data Table on Direct - Year-over-year growth (2023-2028) (%)
- 7.5 Banks - Market size and forecast (2023-2028)
- Chart on Banks - Market size and forecast (2023-2028) ($ billion)
- Data Table on Banks - Market size and forecast (2023-2028) ($ billion)
- Chart on Banks - Year-over-year growth (2023-2028) (%)
- Data Table on Banks - Year-over-year growth (2023-2028) (%)
- 7.6 Others - Market size and forecast (2023-2028)
- Chart on Others - Market size and forecast (2023-2028) ($ billion)
- Data Table on Others - Market size and forecast (2023-2028) ($ billion)
- Chart on Others - Year-over-year growth (2023-2028) (%)
- Data Table on Others - Year-over-year growth (2023-2028) (%)
- 7.7 Market opportunity by Distribution Channel
- Market opportunity by Distribution Channel ($ billion)
- Data Table on Market opportunity by Distribution Channel ($ billion)
8 Market Segmentation by Vehicle Age
- 8.1 Market segments
- Chart on Vehicle Age - Market share (2023-2028) (%)
- Data Table on Vehicle Age - Market share (2023-2028) (%)
- 8.2 Comparison by Vehicle Age
- Chart on Comparison by Vehicle Age
- Data Table on Comparison by Vehicle Age
- 8.3 New Vehicles - Market size and forecast (2023-2028)
- Chart on New Vehicles - Market size and forecast (2023-2028) ($ billion)
- Data Table on New Vehicles - Market size and forecast (2023-2028) ($ billion)
- Chart on New Vehicles - Year-over-year growth (2023-2028) (%)
- Data Table on New Vehicles - Year-over-year growth (2023-2028) (%)
- 8.4 Old Vehicles - Market size and forecast (2023-2028)
- Chart on Old Vehicles - Market size and forecast (2023-2028) ($ billion)
- Data Table on Old Vehicles - Market size and forecast (2023-2028) ($ billion)
- Chart on Old Vehicles - Year-over-year growth (2023-2028) (%)
- Data Table on Old Vehicles - Year-over-year growth (2023-2028) (%)
- 8.5 Market opportunity by Vehicle Age
- Market opportunity by Vehicle Age ($ billion)
- Data Table on Market opportunity by Vehicle Age ($ billion)
9 Market Segmentation by Coverage Type
- 9.1 Market segments
- Chart on Coverage Type - Market share (2023-2028) (%)
- Data Table on Coverage Type - Market share (2023-2028) (%)
- 9.2 Comparison by Coverage Type
- Chart on Comparison by Coverage Type
- Data Table on Comparison by Coverage Type
- 9.3 Liability Insurance - Market size and forecast (2023-2028)
- Chart on Liability Insurance - Market size and forecast (2023-2028) ($ billion)
- Data Table on Liability Insurance - Market size and forecast (2023-2028) ($ billion)
- Chart on Liability Insurance - Year-over-year growth (2023-2028) (%)
- Data Table on Liability Insurance - Year-over-year growth (2023-2028) (%)
- 9.4 Collision Insurance - Market size and forecast (2023-2028)
- Chart on Collision Insurance - Market size and forecast (2023-2028) ($ billion)
- Data Table on Collision Insurance - Market size and forecast (2023-2028) ($ billion)
- Chart on Collision Insurance - Year-over-year growth (2023-2028) (%)
- Data Table on Collision Insurance - Year-over-year growth (2023-2028) (%)
- 9.5 Comprehensive Insurance - Market size and forecast (2023-2028)
- Chart on Comprehensive Insurance - Market size and forecast (2023-2028) ($ billion)
- Data Table on Comprehensive Insurance - Market size and forecast (2023-2028) ($ billion)
- Chart on Comprehensive Insurance - Year-over-year growth (2023-2028) (%)
- Data Table on Comprehensive Insurance - Year-over-year growth (2023-2028) (%)
- 9.6 Market opportunity by Coverage Type
- Market opportunity by Coverage Type ($ billion)
- Data Table on Market opportunity by Coverage Type ($ billion)
10 Customer Landscape
- 10.1 Customer landscape overview
- Analysis of price sensitivity, lifecycle, customer purchase basket, adoption rates, and purchase criteria
11 Geographic Landscape
- 11.1 Geographic segmentation
- Chart on Market share by geography 2023-2028 (%)
- Data Table on Market share by geography 2023-2028 (%)
- 11.2 Geographic comparison
- Chart on Geographic comparison
- Data Table on Geographic comparison
- 11.3 North America - Market size and forecast 2023-2028
- Chart on North America - Market size and forecast 2023-2028 ($ billion)
- Data Table on North America - Market size and forecast 2023-2028 ($ billion)
- Chart on North America - Year-over-year growth 2023-2028 (%)
- Data Table on North America - Year-over-year growth 2023-2028 (%)
- 11.4 APAC - Market size and forecast 2023-2028
- Chart on APAC - Market size and forecast 2023-2028 ($ billion)
- Data Table on APAC - Market size and forecast 2023-2028 ($ billion)
- Chart on APAC - Year-over-year growth 2023-2028 (%)
- Data Table on APAC - Year-over-year growth 2023-2028 (%)
- 11.5 Europe - Market size and forecast 2023-2028
- Chart on Europe - Market size and forecast 2023-2028 ($ billion)
- Data Table on Europe - Market size and forecast 2023-2028 ($ billion)
- Chart on Europe - Year-over-year growth 2023-2028 (%)
- Data Table on Europe - Year-over-year growth 2023-2028 (%)
- 11.6 South America - Market size and forecast 2023-2028
- Chart on South America - Market size and forecast 2023-2028 ($ billion)
- Data Table on South America - Market size and forecast 2023-2028 ($ billion)
- Chart on South America - Year-over-year growth 2023-2028 (%)
- Data Table on South America - Year-over-year growth 2023-2028 (%)
- 11.7 Middle East and Africa - Market size and forecast 2023-2028
- Chart on Middle East and Africa - Market size and forecast 2023-2028 ($ billion)
- Data Table on Middle East and Africa - Market size and forecast 2023-2028 ($ billion)
- Chart on Middle East and Africa - Year-over-year growth 2023-2028 (%)
- Data Table on Middle East and Africa - Year-over-year growth 2023-2028 (%)
- 11.8 US - Market size and forecast 2023-2028
- Chart on US - Market size and forecast 2023-2028 ($ billion)
- Data Table on US - Market size and forecast 2023-2028 ($ billion)
- Chart on US - Year-over-year growth 2023-2028 (%)
- Data Table on US - Year-over-year growth 2023-2028 (%)
- 11.9 China - Market size and forecast 2023-2028
- Chart on China - Market size and forecast 2023-2028 ($ billion)
- Data Table on China - Market size and forecast 2023-2028 ($ billion)
- Chart on China - Year-over-year growth 2023-2028 (%)
- Data Table on China - Year-over-year growth 2023-2028 (%)
- 11.10 Japan - Market size and forecast 2023-2028
- Chart on Japan - Market size and forecast 2023-2028 ($ billion)
- Data Table on Japan - Market size and forecast 2023-2028 ($ billion)
- Chart on Japan - Year-over-year growth 2023-2028 (%)
- Data Table on Japan - Year-over-year growth 2023-2028 (%)
- 11.11 UK - Market size and forecast 2023-2028
- Chart on UK - Market size and forecast 2023-2028 ($ billion)
- Data Table on UK - Market size and forecast 2023-2028 ($ billion)
- Chart on UK - Year-over-year growth 2023-2028 (%)
- Data Table on UK - Year-over-year growth 2023-2028 (%)
- 11.12 France - Market size and forecast 2023-2028
- Chart on France - Market size and forecast 2023-2028 ($ billion)
- Data Table on France - Market size and forecast 2023-2028 ($ billion)
- Chart on France - Year-over-year growth 2023-2028 (%)
- Data Table on France - Year-over-year growth 2023-2028 (%)
- 11.13 Market opportunity by geography
- Market opportunity by geography ($ billion)
- Data Tables on Market opportunity by geography ($ billion)
- 11.14 Germany - Market size and forecast (2023-2028)
- Chart on Germany - Market size and forecast (2023-2028) ($ billion)
- Data Table on Germany - Market size and forecast (2023-2028) ($ billion)
- Chart on Germany - Year-over-year growth (2023-2028) (%)
- Data Table on Germany - Year-over-year growth (2023-2028) (%)
- 11.15 Canada - Market size and forecast (2023-2028)
- Chart on Canada - Market size and forecast (2023-2028) ($ billion)
- Data Table on Canada - Market size and forecast (2023-2028) ($ billion)
- Chart on Canada - Year-over-year growth (2023-2028) (%)
- Data Table on Canada - Year-over-year growth (2023-2028) (%)
- 11.16 India - Market size and forecast (2023-2028)
- Chart on India - Market size and forecast (2023-2028) ($ billion)
- Data Table on India - Market size and forecast (2023-2028) ($ billion)
- Chart on India - Year-over-year growth (2023-2028) (%)
- Data Table on India - Year-over-year growth (2023-2028) (%)
- 11.17 South Korea - Market size and forecast (2023-2028)
- Chart on South Korea - Market size and forecast (2023-2028) ($ billion)
- Data Table on South Korea - Market size and forecast (2023-2028) ($ billion)
- Chart on South Korea - Year-over-year growth (2023-2028) (%)
- Data Table on South Korea - Year-over-year growth (2023-2028) (%)
- 11.18 Italy - Market size and forecast (2023-2028)
- Chart on Italy - Market size and forecast (2023-2028) ($ billion)
- Data Table on Italy - Market size and forecast (2023-2028) ($ billion)
- Chart on Italy - Year-over-year growth (2023-2028) (%)
- Data Table on Italy - Year-over-year growth (2023-2028) (%)
- 11.19 Brazil - Market size and forecast (2023-2028)
- Chart on Brazil - Market size and forecast (2023-2028) ($ billion)
- Data Table on Brazil - Market size and forecast (2023-2028) ($ billion)
- Chart on Brazil - Year-over-year growth (2023-2028) (%)
- Data Table on Brazil - Year-over-year growth (2023-2028) (%)
- 11.20 UAE - Market size and forecast (2023-2028)
- Chart on UAE - Market size and forecast (2023-2028) ($ billion)
- Data Table on UAE - Market size and forecast (2023-2028) ($ billion)
- Chart on UAE - Year-over-year growth (2023-2028) (%)
- Data Table on UAE - Year-over-year growth (2023-2028) (%)
- 11.21 Spain - Market size and forecast (2023-2028)
- Chart on Spain - Market size and forecast (2023-2028) ($ billion)
- Data Table on Spain - Market size and forecast (2023-2028) ($ billion)
- Chart on Spain - Year-over-year growth (2023-2028) (%)
- Data Table on Spain - Year-over-year growth (2023-2028) (%)
- 11.22 Mexico - Market size and forecast (2023-2028)
- Chart on Mexico - Market size and forecast (2023-2028) ($ billion)
- Data Table on Mexico - Market size and forecast (2023-2028) ($ billion)
- Chart on Mexico - Year-over-year growth (2023-2028) (%)
- Data Table on Mexico - Year-over-year growth (2023-2028) (%)
- 11.23 Rest of World (ROW) - Market size and forecast (2023-2028)
- Chart on Rest of World (ROW) - Market size and forecast (2023-2028) ($ billion)
- Data Table on Rest of World (ROW) - Market size and forecast (2023-2028) ($ billion)
- Chart on Rest of World (ROW) - Year-over-year growth (2023-2028) (%)
- Data Table on Rest of World (ROW) - Year-over-year growth (2023-2028) (%)
12 Drivers, Challenges, and Opportunity/Restraints
- 12.3 Impact of drivers and challenges
- Impact of drivers and challenges in 2023 and 2028
- 12.4 Market opportunities/restraints
13 Competitive Landscape
- 13.2 Competitive Landscape
- Overview on criticality of inputs and factors of differentiation
- 13.3 Landscape disruption
- Overview on factors of disruption
- 13.4 Industry risks
- Impact of key risks on business
14 Competitive Analysis
- 14.2 Market positioning of companies
- Matrix on companies position and classification
- 14.3 Allstate Corporation (United States)
- Allstate Corporation (United States) - Overview
- Allstate Corporation (United States) - Product / Service
- Allstate Corporation (United States) - Key offerings
- 14.4 State Farm Mutual Automobile Insurance Company (United States)
- State Farm Mutual Automobile Insurance Company (United States) - Overview
- State Farm Mutual Automobile Insurance Company (United States) - Product / Service
- State Farm Mutual Automobile Insurance Company (United States) - Key offerings
- 14.5 Geico (United States)
- Geico (United States) - Overview
- Geico (United States) - Product / Service
- Geico (United States) - Key offerings
- 14.6 Progressive Corporation (United States)
- Progressive Corporation (United States) - Overview
- Progressive Corporation (United States) - Product / Service
- Progressive Corporation (United States) - Key offerings
- 14.7 Liberty Mutual Insurance (United States)
- Liberty Mutual Insurance (United States) - Overview
- Liberty Mutual Insurance (United States) - Product / Service
- Liberty Mutual Insurance (United States) - Key offerings
- 14.8 Zurich Insurance Group Ltd. (Switzerland)
- Zurich Insurance Group Ltd. (Switzerland) - Overview
- Zurich Insurance Group Ltd. (Switzerland) - Product / Service
- Zurich Insurance Group Ltd. (Switzerland) - Key offerings
- 14.9 AXA S.A. (France)
- AXA S.A. (France) - Overview
- AXA S.A. (France) - Product / Service
- AXA S.A. (France) - Key offerings
- 14.10 Allianz SE (Germany)
- Allianz SE (Germany) - Overview
- Allianz SE (Germany) - Product / Service
- Allianz SE (Germany) - Key offerings
- 14.11 Ping An Insurance Group Co., Ltd. (China)
- Ping An Insurance Group Co., Ltd. (China) - Overview
- Ping An Insurance Group Co., Ltd. (China) - Product / Service
- Ping An Insurance Group Co., Ltd. (China) - Key offerings
- 14.12 China Pacific Insurance Co., Ltd. (China)
- China Pacific Insurance Co., Ltd. (China) - Overview
- China Pacific Insurance Co., Ltd. (China) - Product / Service
- China Pacific Insurance Co., Ltd. (China) - Key offerings
- 14.13 Tokio Marine Holdings Inc. (Japan)
- Tokio Marine Holdings Inc. (Japan) - Overview
- Tokio Marine Holdings Inc. (Japan) - Product / Service
- Tokio Marine Holdings Inc. (Japan) - Key offerings
- 14.14 Sompo Japan Insurance Inc. (Japan)
- Sompo Japan Insurance Inc. (Japan) - Overview
- Sompo Japan Insurance Inc. (Japan) - Product / Service
- Sompo Japan Insurance Inc. (Japan) - Key offerings
- 14.15 Aviva plc (United Kingdom)
- Aviva plc (United Kingdom) - Overview
- Aviva plc (United Kingdom) - Product / Service
- Aviva plc (United Kingdom) - Key offerings
- 14.16 Direct Line Insurance Group plc (United Kingdom)
- Direct Line Insurance Group plc (United Kingdom) - Overview
- Direct Line Insurance Group plc (United Kingdom) - Product / Service
- Direct Line Insurance Group plc (United Kingdom) - Key offerings
- 14.17 RSA Insurance Group (United Kingdom)
- RSA Insurance Group (United Kingdom) - Overview
- RSA Insurance Group (United Kingdom) - Product / Service
- RSA Insurance Group (United Kingdom) - Key offerings
- 14.18 Mapfre S.A. (Spain)
- Mapfre S.A. (Spain) - Overview
- Mapfre S.A. (Spain) - Product / Service
- Mapfre S.A. (Spain) - Key offerings
- 14.19 Erie Insurance Group (United States)
- Erie Insurance Group (United States) - Overview
- Erie Insurance Group (United States) - Product / Service
- Erie Insurance Group (United States) - Key offerings
- 14.20 Nationwide Mutual Insurance Company (United States)
- Nationwide Mutual Insurance Company (United States) - Overview
- Nationwide Mutual Insurance Company (United States) - Product / Service
- Nationwide Mutual Insurance Company (United States) - Key offerings
- 14.21 Travelers Companies Inc. (United States)
- Travelers Companies Inc. (United States) - Overview
- Travelers Companies Inc. (United States) - Product / Service
- Travelers Companies Inc. (United States) - Key offerings
- 14.22 AIG (United States)
- AIG (United States) - Overview
- AIG (United States) - Product / Service
- AIG (United States) - Key offerings
- 14.23 Allianz SE
- Allianz SE - Overview
- Allianz SE - Product / Service
- Allianz SE - Key offerings
- 14.24 American International Group Inc.
- American International Group Inc. - Overview
- American International Group Inc. - Product / Service
- American International Group Inc. - Key offerings
- 14.25 Aviva insurance Ltd.
- Aviva insurance Ltd. - Overview
- Aviva insurance Ltd. - Product / Service
- Aviva insurance Ltd. - Key offerings
- 14.26 AXA Group
- AXA Group - Overview
- AXA Group - Product / Service
- AXA Group - Key offerings
- 14.27 Berkshire Hathaway Inc.
- Berkshire Hathaway Inc. - Overview
- Berkshire Hathaway Inc. - Product / Service
- Berkshire Hathaway Inc. - Key offerings
- 14.28 Chubb Ltd.
- Chubb Ltd. - Overview
- Chubb Ltd. - Product / Service
- Chubb Ltd. - Key offerings
- 14.29 Desjardins Group
- Desjardins Group - Overview
- Desjardins Group - Product / Service
- Desjardins Group - Key offerings
- 14.30 Discovery Ltd.
- Discovery Ltd. - Overview
- Discovery Ltd. - Product / Service
- Discovery Ltd. - Key offerings
- 14.31 Kotak Mahindra Bank Ltd.
- Kotak Mahindra Bank Ltd. - Overview
- Kotak Mahindra Bank Ltd. - Product / Service
- Kotak Mahindra Bank Ltd. - Key offerings
- 14.32 Liberty Mutual Holding Co. Inc.
- Liberty Mutual Holding Co. Inc. - Overview
- Liberty Mutual Holding Co. Inc. - Product / Service
- Liberty Mutual Holding Co. Inc. - Key offerings
- 14.33 Navi Technologies Ltd
- Navi Technologies Ltd - Overview
- Navi Technologies Ltd - Product / Service
- Navi Technologies Ltd - Key offerings
- 14.34 OCTO Telematics S.p.A
- OCTO Telematics S.p.A - Overview
- OCTO Telematics S.p.A - Product / Service
- OCTO Telematics S.p.A - Key offerings
- 14.35 Reliance Capital Ltd.
- Reliance Capital Ltd. - Overview
- Reliance Capital Ltd. - Product / Service
- Reliance Capital Ltd. - Key offerings
- 14.36 Sompo Holdings Inc.
- Sompo Holdings Inc. - Overview
- Sompo Holdings Inc. - Product / Service
- Sompo Holdings Inc. - Key offerings
- 14.37 State Farm Mutual Automobile Insurance Co.
- State Farm Mutual Automobile Insurance Co. - Overview
- State Farm Mutual Automobile Insurance Co. - Product / Service
- State Farm Mutual Automobile Insurance Co. - Key offerings
- 14.38 The Allstate Corp.
- The Allstate Corp. - Overview
- The Allstate Corp. - Product / Service
- The Allstate Corp. - Key offerings
- 14.39 THE HANOVER INSURANCE GROUP INC.
- THE HANOVER INSURANCE GROUP INC. - Overview
- THE HANOVER INSURANCE GROUP INC. - Product / Service
- THE HANOVER INSURANCE GROUP INC. - Key offerings
- 14.40 The Progressive Corp.
- The Progressive Corp. - Overview
- The Progressive Corp. - Product / Service
- The Progressive Corp. - Key offerings
- 14.41 The Travelers Co. Inc.
- The Travelers Co. Inc. - Overview
- The Travelers Co. Inc. - Product / Service
- The Travelers Co. Inc. - Key offerings
- 14.42 Zurich Insurance Co. Ltd.
- Zurich Insurance Co. Ltd. - Overview
- Zurich Insurance Co. Ltd. - Product / Service
- Zurich Insurance Co. Ltd. - Key offerings
15 Appendix
- 15.2 Inclusions and exclusions checklist
- Inclusions checklist
- Exclusions checklist
- 15.3 Currency conversion rates for US$
- Currency conversion rates for US$
- 15.4 Research methodology
- 15.7 Validation techniques employed for market sizing
- Validation techniques employed for market sizing
- 15.9 360 degree market analysis
- 360 degree market analysis
- 15.10 List of abbreviations