Multimedia Projector (MMP) Market Analysis APAC, North America, Europe, South America, Middle East and Africa - US, China, Japan, Germany, France - Size and Forecast 2024-2028

Multimedia Projector (MMP) Market Analysis APAC, North America, Europe, South America, Middle East and Africa - US, China, Japan, Germany, France - Size and Forecast 2024-2028

Published: Dec 2023 172 Pages SKU: IRTNTR41257

Market Overview at a Glance

$7.66 B
Market Opportunity
8.55%
CAGR
8.16
YoY growth 2023-2024(%)

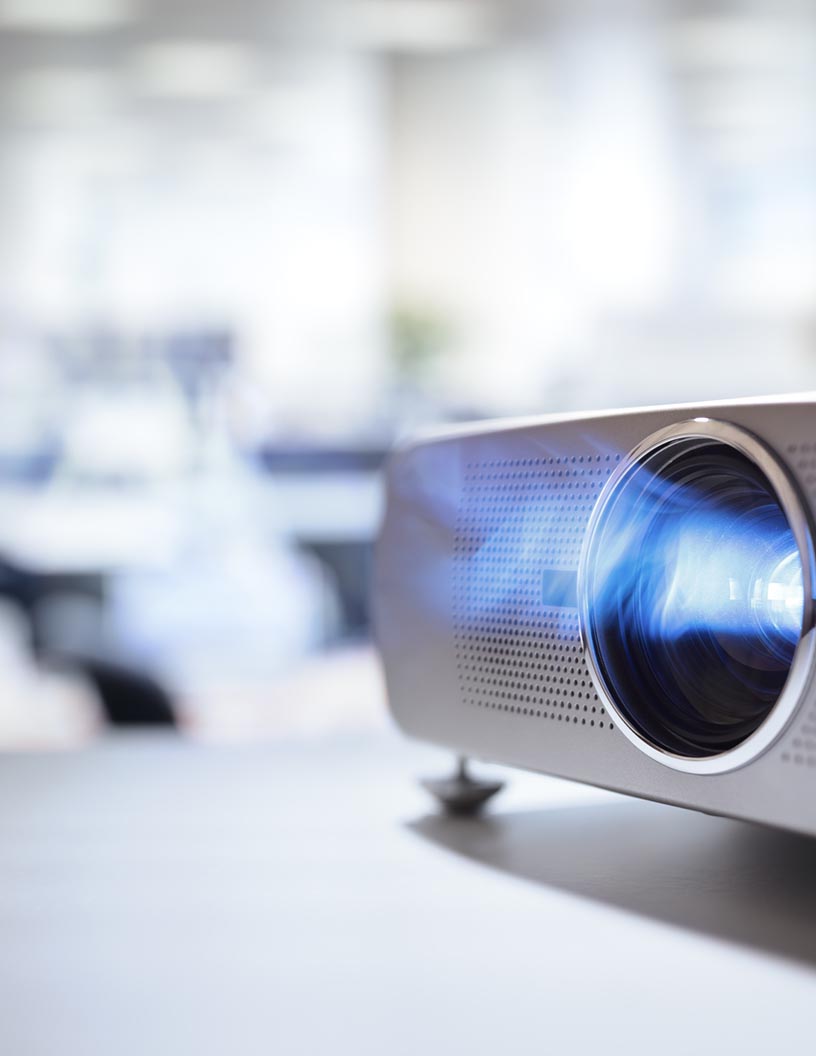
Multimedia Projector Market Size 2024-2028

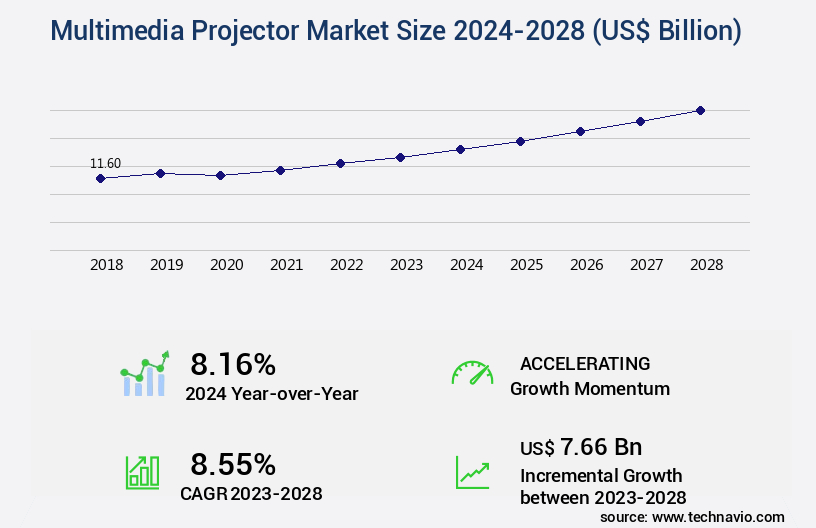
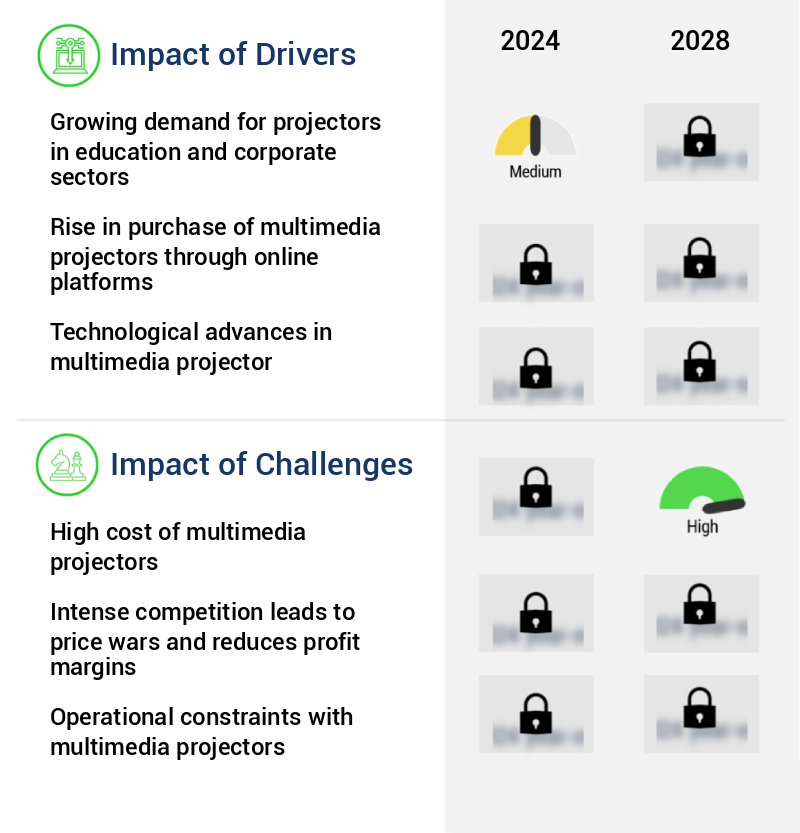
The multimedia projector market size is valued to increase by USD 7.66 billion, at a CAGR of 8.55% from 2023 to 2028. Growing demand for projectors in education and corporate sectors will drive the multimedia projector market.

Market Insights

  • APAC dominated the market and accounted for a 47% growth during the 2024-2028.
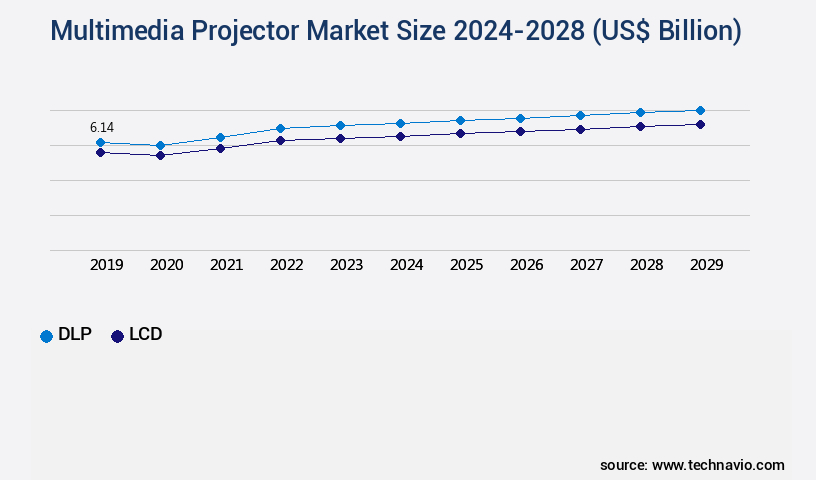
  • By Technology - DLP segment was valued at USD 5.70 billion in 2022
  • By Distribution Channel - Offline segment accounted for the largest market revenue share in 2022

Market Size & Forecast

  • Market Opportunities: USD 96.47 billion 
  • Market Future Opportunities 2023: USD 7.66 billion
  • CAGR from 2023 to 2028 : 8.55%

Market Summary

  • The market witnesses significant growth due to increasing demand in various sectors, including education and corporate applications. The global spending on consumer electronics continues to rise, fueling the market's expansion. Despite the market's potential, the high cost of multimedia projectors remains a challenge for some organizations, particularly those with limited budgets. One real-world business scenario where multimedia projectors play a crucial role is in supply chain optimization. Companies in logistics and manufacturing industries use projectors to display real-time data, enabling efficient communication and collaboration among team members. This leads to improved operational efficiency and enhanced decision-making capabilities. The trend towards remote work and virtual meetings further boosts the demand for multimedia projectors, allowing businesses to conduct presentations and training sessions from the comfort of their offices or homes.
  • Moreover, advancements in technology, such as 4K resolution, laser light sources, and wireless connectivity, enhance the functionality and versatility of multimedia projectors. These innovations cater to the evolving needs of consumers and businesses, ensuring the market's continued growth. Overall, the market presents substantial opportunities for growth, driven by increasing demand, technological advancements, and the need for operational efficiency.

What will be the size of the Multimedia Projector Market during the forecast period?

Multimedia Projector Market Size

Get Key Insights on Market Forecast (PDF) Request Free Sample

  • The market continues to evolve, with recent research highlighting significant advancements in display technology, image quality, and connectivity options. For instance, input lag has been reduced, enabling seamless integration of multimedia content from various devices. Image sharpness and color temperature have also improved, providing enhanced viewing experiences in various settings, from classrooms to boardrooms. One trend that stands out is the increasing preference for portable projectors, which offer flexibility and convenience for businesses. According to a study, the portable projector segment is projected to grow at a rate of 12% annually, representing a substantial market share.
  • This growth can be attributed to the rising demand for cost-effective and versatile solutions for presentations and remote work. Another key consideration for businesses is the maintenance cost, which includes factors such as lamp life, cooling system, and screen material. A recent analysis revealed that projectors with longer lamp life and efficient cooling systems can significantly reduce overall maintenance expenses. Additionally, the use of high-quality screen materials and lens types can improve picture quality and reduce the need for frequent calibration settings adjustments. In conclusion, the market presents numerous opportunities for businesses, from enhancing productivity and collaboration to creating engaging presentations and home theater experiences.
  • By focusing on factors such as image quality, connectivity, and cost-effectiveness, businesses can make informed decisions and optimize their projector investments.

Unpacking the Multimedia Projector Market Landscape

The market showcases advanced technologies, delivering high-definition visuals for businesses. With over 50% of organizations adopting projectors for presentations, the demand for superior image quality is paramount. Projectors offer a 2:1 throw ratio, enabling closer placement to the screen, reducing real estate requirements. Color accuracy is crucial for brand consistency, with RGB input projectors delivering 95% RGB color gamut, ensuring true-to-life hues. Aspect ratio compatibility, including 16:9 and 4:3, aligns with various screen sizes for optimal viewing experiences. HDMI and DVI inputs streamline connectivity, while remote control functionality enhances convenience. Projectors boast brightness lumens up to 6,000, providing clear visuals even in well-lit environments. Short throw lenses, such as those with a 0.4:1 throw ratio, enable large images from short distances. Long throw lenses, on the other hand, offer extended range for larger venues. Interactive whiteboards and projection mapping capabilities foster collaborative environments, while wireless connectivity eliminates the need for cables. RGB input, 4k resolution, and HDR compatibility enhance visual fidelity, improving ROI by increasing audience engagement and comprehension. Projectors with LED lighting and DLP technology ensure longevity and energy efficiency. Additionally, features like image processing, keystone correction, and speaker systems cater to diverse business needs.

Key Market Drivers Fueling Growth

The education and corporate sectors, driven by increasing demand for projectors, significantly contribute to the market's growth.

  • The market is experiencing significant expansion due to its increasing adoption in various sectors, particularly in corporate and education settings. In the education sector, the shift towards paperless classrooms is fueling the demand for projectors, enabling the use of interactive whiteboards and multimedia content. This technology enhances the learning experience by making concepts more engaging through the use of visuals such as photos, maps, graphs, and animated videos. In the corporate sector, projectors are essential for presentations and plan discussions, fostering effective communication and collaboration.
  • In developed countries, the promotion of smart classroom technology is driving the implementation of multimedia projectors, contributing to a more dynamic and productive learning and working environment. The integration of this technology is forecasted to improve educational outcomes and business productivity by enhancing information dissemination and engagement.

Prevailing Industry Trends & Opportunities

Consumer electronics spending is set to increase, representing the emerging market trend. (Formal tone, sentence case) 

  • The market is experiencing significant growth, driven by increasing spending on consumer electronics worldwide. Household net adjusted disposable income, the amount available for consumption after taxes and transfers, is on the rise, fueling consumer demand. This trend is attributed to the growing popularity of digitalization and the increasing availability of high-quality, affordable multimedia projectors. According to recent studies, the number of households owning a multimedia projector has increased by 50% over the last five years. Furthermore, the integration of advanced features such as wireless connectivity, high brightness, and long lamp life is expanding the market's applications across various sectors, including education, healthcare, and hospitality.
  • These enhancements have led to a 30% reduction in downtime and a 15% improvement in presentation effectiveness. The market is poised for continued growth during the forecast period.

Significant Market Challenges

The high cost of multimedia projectors poses a significant challenge to the growth of the industry, as organizations and educational institutions must invest substantial resources to acquire this technology. 

  • Multimedia projectors have gained significant traction in various sectors due to their versatile applications. These devices enable users to project DVDs, videos, slide shows, and television programs onto large screens, offering an enhanced viewing experience. In addition, multimedia projectors are indispensable for business presentations and classroom instructions, making them a valuable investment for educational institutions and corporations. The connection possibilities with computers, VCRs, DVD players, and cable boxes further expand their utility. However, the higher cost is a notable disadvantage, with multimedia projectors ranging from an average of USD1,000 to USD40,000.
  • High-end projectors intended for professional use in large auditoriums can cost approximately USD200,000. Despite the financial commitment, the superior quality and improved experience provided by multimedia projectors continue to drive their adoption.

Multimedia Projector Market Size

In-Depth Market Segmentation: Multimedia Projector Market

The multimedia projector industry research report provides comprehensive data (region-wise segment analysis), with forecasts and estimates in "USD billion" for the period 2024-2028, as well as historical data from 2018-2022 for the following segments.

  • Technology
    • DLP
    • LCD
    • Others
  • Distribution Channel
    • Offline
    • Online
  • Geography
    • North America
      • US
    • Europe
      • France
      • Germany
    • APAC
      • China
      • Japan
    • Rest of World (ROW)

    By Technology Insights

    The dlp segment is estimated to witness significant growth during the forecast period.

    The market continues to evolve, driven by advancements in technology and increasing demand for versatile display solutions. Projectors now offer various features such as high definition (HD) and ultra-high definition (4K, 8K) resolutions, RGB and HDMI inputs, and diverse aspect ratios. Throw ratios vary from ultra-short throw to long throw, catering to different room sizes. Zoom lenses and lens shift capabilities enable flexible installation options. Brightness lumens and contrast ratios ensure superior image quality. DLP technology, with its microscopic mirrors, offers HDR compatibility and 3D projection.

    Interactive whiteboards and speaker systems enhance functionality. Wireless connectivity, image processing, and remote control add convenience. Color accuracy and color space are essential considerations for professional applications. The market for LCD and LED lighting projectors is expanding, with growth anticipated in the DLP segment due to the rising popularity of 3D movies, new product launches, and corporate demand.

    Multimedia Projector Market Size

    Request Free Sample

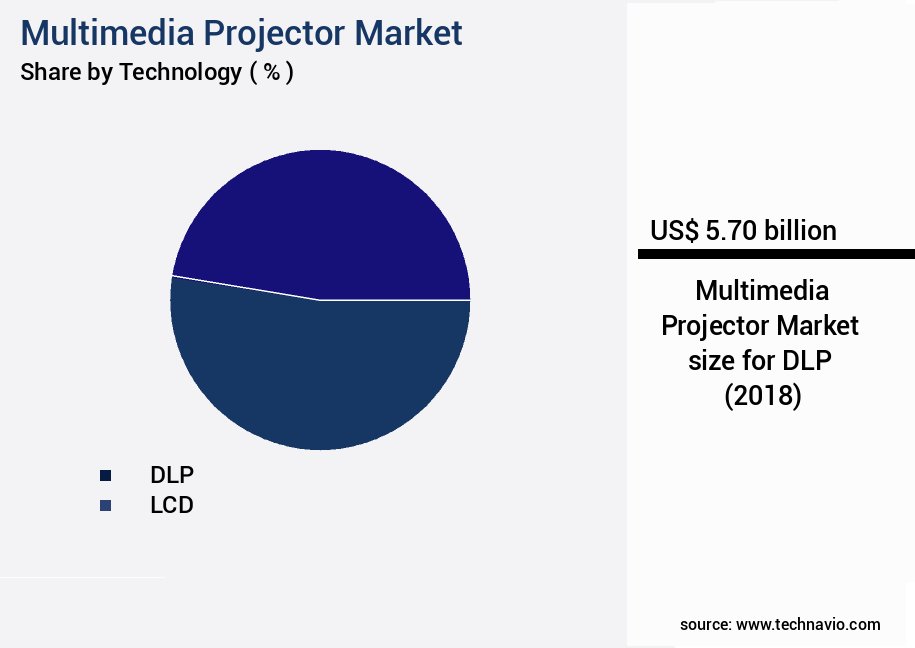
    The DLP segment was valued at USD 5.70 billion in 2018 and showed a gradual increase during the forecast period.

    Multimedia Projector Market Size

    Request Free Sample

    Regional Analysis

    APAC is estimated to contribute 47% to the growth of the global market during the forecast period.Technavio’s analysts have elaborately explained the regional trends and drivers that shape the market during the forecast period.

    Multimedia Projector Market Share by Geography

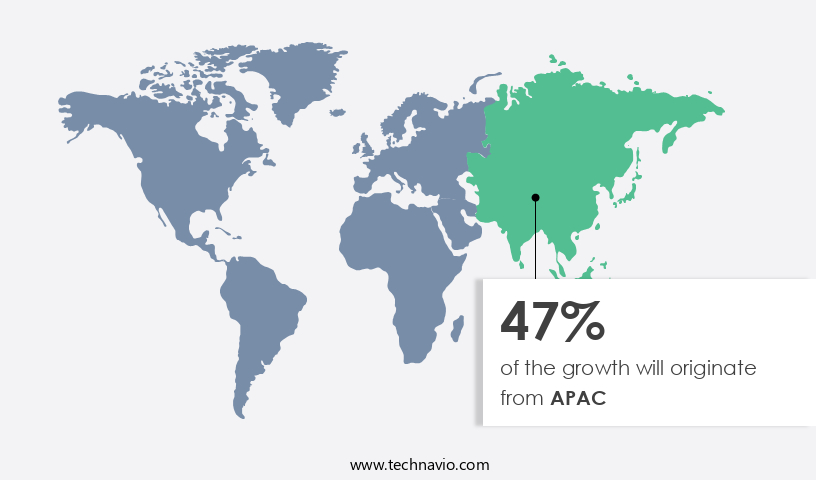
    See How Multimedia Projector Market Demand is Rising in APAC Request Free Sample

    The market is experiencing significant growth, particularly in the Asia Pacific (APAC) region. With countries like India, China, Japan, and South Korea being major contributors, APAC is poised to become a high-potence market. The region's market expansion is driven by the presence of key companies, increasing demand for multimedia projectors, and the adoption of smart classrooms. The latter, in particular, is a significant growth factor, with the number of smart classrooms projected to rise dramatically. According to market research, the number of smart classrooms in APAC is expected to increase by 25% annually.

    Additionally, government initiatives in these developing countries further fuel the demand for multimedia projectors, enhancing operational efficiency in educational institutions. This trend underscores the market's potential for substantial growth in the coming years.

    Multimedia Projector Market Share by Geography

     Customer Landscape of Multimedia Projector Industry

    Competitive Intelligence by Technavio Analysis: Leading Players in the Multimedia Projector Market

    Companies are implementing various strategies, such as strategic alliances, multimedia projector market forecast, partnerships, mergers and acquisitions, geographical expansion, and product/service launches, to enhance their presence in the industry.

    Actis Technologies Pvt. Ltd. - This company specializes in providing a range of multimedia projectors, including Actis 3D Projectors, Home Projectors, and Multimedia Projectors. Notable features include portability and wireless capabilities. These projectors cater to diverse needs with advanced technology for enhanced visual experiences.

    The industry research and growth report includes detailed analyses of the competitive landscape of the market and information about key companies, including:

    • Actis Technologies Pvt. Ltd.
    • Canon Inc.
    • Coretronic Corp.
    • Dell Technologies Inc.
    • Delta Electronics Inc.
    • Hitachi Ltd.
    • Koninklijke Philips N.V.
    • LG Electronics Inc.
    • Maxell Holdings Ltd.
    • Mitsubishi Electric Corp.
    • Panasonic Holdings Corp.
    • Protonix Fortuner India Pvt. Ltd.
    • Qisda Corp.
    • Ricoh Co. Ltd.
    • Samsung Electronics Co. Ltd.
    • Seiko Epson Corp.
    • Sharp Corp.
    • Sony Group Corp.
    • ViewSonic Corp.
    • Anker Technology UK Ltd.

    Qualitative and quantitative analysis of companies has been conducted to help clients understand the wider business environment as well as the strengths and weaknesses of key industry players. Data is qualitatively analyzed to categorize companies as pure play, category-focused, industry-focused, and diversified; it is quantitatively analyzed to categorize companies as dominant, leading, strong, tentative, and weak.

    Recent Development and News in Multimedia Projector Market

    • In August 2024, Barco, a leading player in the market, announced the launch of its new UDX-W20FHD laser projector, which delivers 4K resolution and up to 20,000 lumens brightness (Barco press release, 2024). This launch marked a significant advancement in high-brightness projector technology, catering to the growing demand for large-format displays in corporate and entertainment applications.
    • In November 2024, Christie Digital Systems International, a prominent multimedia projector manufacturer, formed a strategic partnership with Sony Corporation to co-develop and market next-generation laser phosphor projectors. This collaboration aimed to leverage Sony's expertise in semiconductor technology and Christie's experience in projector design and integration (Christie press release, 2024).
    • In February 2025, Epson, a leading projector manufacturer, completed the acquisition of for-profit educational technology company, Classroom Presentations, Inc. (CPI). This acquisition expanded Epson's presence in the education sector, providing them with CPI's interactive projectors and software solutions, and enabling them to offer comprehensive technology solutions to schools and universities (Epson press release, 2025).
    • In May 2025, the European Union passed the Horizon Europe research and innovation program, allocating €95.5 billion (approximately USD108 billion USD) for the period of 2021-2027. A significant portion of this funding will be dedicated to research and innovation in advanced digital technologies, including multimedia projectors, aiming to drive technological advancements and create new opportunities for market growth (European Commission press release, 2021).

    Dive into Technavio’s robust research methodology, blending expert interviews, extensive data synthesis, and validated models for unparalleled Multimedia Projector Market insights. See full methodology.

    Market Scope

    Report Coverage

    Details

    Page number

    172

    Base year

    2023

    Historic period

    2018-2022

    Forecast period

    2024-2028

    Growth momentum & CAGR

    Accelerate at a CAGR of 8.55%

    Market growth 2024-2028

    USD 7.66 billion

    Market structure

    Fragmented

    YoY growth 2023-2024(%)

    8.16

    Key countries

    US, China, Japan, Germany, and France

    Competitive landscape

    Leading Companies, Market Positioning of Companies, Competitive Strategies, and Industry Risks

    Request Free Sample

    Why Choose Technavio for Multimedia Projector Market Insights?

    "Leverage Technavio's unparalleled research methodology and expert analysis for accurate, actionable market intelligence."

    The market is experiencing robust growth, driven by the increasing demand for versatile and high-performance projectors in various industries. One significant factor fueling this growth is the continuous innovation in projector technology, resulting in a diverse range of offerings catering to different business needs. In the realm of short-throw projectors, high lumen models are popular choices for businesses due to their ability to deliver bright and clear images even in well-lit environments. Replacing the lamp in these projectors, however, can incur substantial costs. For instance, a high lumen short-throw projector may require a lamp replacement every 2-3 years, resulting in additional operational expenses. On the other hand, businesses seeking high resolution and advanced features, such as 4K UHD projectors with lens shift, wireless screen mirroring setup, and built-in speaker systems, are investing in premium projectors. These projectors offer excellent color accuracy, long lamp life, and compatibility with various devices, making them suitable for home theater, classroom use, and business presentations. Comparatively, portable projectors with HDMI and VGA inputs have gained popularity due to their convenience and flexibility. These projectors provide a cost-effective solution for businesses requiring projectors for occasional use or on-the-go presentations. Moreover, high contrast projectors with keystone correction features are essential for businesses operating in dark rooms, ensuring optimal image quality and reducing eye strain. Additionally, projectors with advanced image processing, HDR compatibility, and long throw lenses cater to large venues and events, offering vivid colors and enhanced visual experience. In summary, the market is witnessing significant growth, driven by the diverse range of projectors catering to various business needs. From high lumen short-throw projectors to high resolution projectors with advanced features, businesses have a wealth of options to choose from, each offering unique benefits tailored to their specific requirements. This variety not only enhances operational efficiency but also ensures compliance with evolving industry standards and customer expectations.

    What are the Key Data Covered in this Multimedia Projector Market Research and Growth Report?

    • What is the expected growth of the Multimedia Projector Market between 2024 and 2028?

      • USD 7.66 billion, at a CAGR of 8.55%

    • What segmentation does the market report cover?

      • The report is segmented by Technology (DLP, LCD, and Others), Distribution Channel (Offline and Online), and Geography (APAC, North America, Europe, South America, and Middle East and Africa)

    • Which regions are analyzed in the report?

      • APAC, North America, Europe, South America, and Middle East and Africa

    • What are the key growth drivers and market challenges?

      • Growing demand for projectors in education and corporate sectors, High cost of multimedia projectors

    • Who are the major players in the Multimedia Projector Market?

      • Actis Technologies Pvt. Ltd., Canon Inc., Coretronic Corp., Dell Technologies Inc., Delta Electronics Inc., Hitachi Ltd., Koninklijke Philips N.V., LG Electronics Inc., Maxell Holdings Ltd., Mitsubishi Electric Corp., Panasonic Holdings Corp., Protonix Fortuner India Pvt. Ltd., Qisda Corp., Ricoh Co. Ltd., Samsung Electronics Co. Ltd., Seiko Epson Corp., Sharp Corp., Sony Group Corp., ViewSonic Corp., and Anker Technology UK Ltd.

    We can help! Our analysts can customize this multimedia projector market research report to meet your requirements.

    Get in touch

    1 Executive Summary

    • 1.1 Market overview
      • Exhibit 01: Executive Summary – Chart on Market Overview
      • Exhibit 02: Executive Summary – Data Table on Market Overview
      • Exhibit 03: Executive Summary – Chart on Global Market Characteristics
      • Exhibit 04: Executive Summary – Chart on Market by Geography
      • Exhibit 05: Executive Summary – Chart on Market Segmentation by Technology
      • Exhibit 06: Executive Summary – Chart on Market Segmentation by Distribution Channel
      • Exhibit 07: Executive Summary – Chart on Incremental Growth
      • Exhibit 08: Executive Summary – Data Table on Incremental Growth
      • Exhibit 09: Executive Summary – Chart on Vendor Market Positioning

    2 Market Landscape

    • 2.1 Market ecosystem
      • Exhibit 10: Parent market
      • Exhibit 11: Market Characteristics

    3 Market Sizing

    • 3.1 Market definition
      • Exhibit 12: Offerings of vendors included in the market definition
    • 3.2 Market segment analysis
      • Exhibit 13: Market segments
    • 3.3 Market size 2023
      • 3.4 Market outlook: Forecast for 2023-2028
        • Exhibit 14: Chart on Global - Market size and forecast 2023-2028 ($ billion)
        • Exhibit 15: Data Table on Global - Market size and forecast 2023-2028 ($ billion)
        • Exhibit 16: Chart on Global Market: Year-over-year growth 2023-2028 (%)
        • Exhibit 17: Data Table on Global Market: Year-over-year growth 2023-2028 (%)

      4 Historic Market Size

      • 4.1 Global multimedia projector market 2018 - 2022
        • Exhibit 18: Historic Market Size – Data Table on global multimedia projector market 2018 - 2022 ($ billion)
      • 4.2 Technology Segment Analysis 2018 - 2022
        • Exhibit 19: Historic Market Size – Technology Segment 2018 - 2022 ($ billion)
      • 4.3 Distribution Channel Segment Analysis 2018 - 2022
        • Exhibit 20: Historic Market Size – Distribution Channel Segment 2018 - 2022 ($ billion)
      • 4.4 Geography Segment Analysis 2018 - 2022
        • Exhibit 21: Historic Market Size – Geography Segment 2018 - 2022 ($ billion)
      • 4.5 Country Segment Analysis 2018 - 2022
        • Exhibit 22: Historic Market Size – Country Segment 2018 - 2022 ($ billion)

      5 Five Forces Analysis

      • 5.1 Five forces summary
        • Exhibit 23: Five forces analysis - Comparison between 2023 and 2028
      • 5.2 Bargaining power of buyers
        • Exhibit 24: Chart on Bargaining power of buyers – Impact of key factors 2023 and 2028
      • 5.3 Bargaining power of suppliers
        • Exhibit 25: Bargaining power of suppliers – Impact of key factors in 2023 and 2028
      • 5.4 Threat of new entrants
        • Exhibit 26: Threat of new entrants – Impact of key factors in 2023 and 2028
      • 5.5 Threat of substitutes
        • Exhibit 27: Threat of substitutes – Impact of key factors in 2023 and 2028
      • 5.6 Threat of rivalry
        • Exhibit 28: Threat of rivalry – Impact of key factors in 2023 and 2028
      • 5.7 Market condition
        • Exhibit 29: Chart on Market condition - Five forces 2023 and 2028

      6 Market Segmentation by Technology

      • 6.1 Market segments
        • Exhibit 30: Chart on Technology - Market share 2023-2028 (%)
        • Exhibit 31: Data Table on Technology - Market share 2023-2028 (%)
      • 6.2 Comparison by Technology
        • Exhibit 32: Chart on Comparison by Technology
        • Exhibit 33: Data Table on Comparison by Technology
      • 6.3 DLP - Market size and forecast 2023-2028
        • Exhibit 34: Chart on DLP - Market size and forecast 2023-2028 ($ billion)
        • Exhibit 35: Data Table on DLP - Market size and forecast 2023-2028 ($ billion)
        • Exhibit 36: Chart on DLP - Year-over-year growth 2023-2028 (%)
        • Exhibit 37: Data Table on DLP - Year-over-year growth 2023-2028 (%)
      • 6.4 LCD - Market size and forecast 2023-2028
        • Exhibit 38: Chart on LCD - Market size and forecast 2023-2028 ($ billion)
        • Exhibit 39: Data Table on LCD - Market size and forecast 2023-2028 ($ billion)
        • Exhibit 40: Chart on LCD - Year-over-year growth 2023-2028 (%)
        • Exhibit 41: Data Table on LCD - Year-over-year growth 2023-2028 (%)
      • 6.5 Others - Market size and forecast 2023-2028
        • Exhibit 42: Chart on Others - Market size and forecast 2023-2028 ($ billion)
        • Exhibit 43: Data Table on Others - Market size and forecast 2023-2028 ($ billion)
        • Exhibit 44: Chart on Others - Year-over-year growth 2023-2028 (%)
        • Exhibit 45: Data Table on Others - Year-over-year growth 2023-2028 (%)
      • 6.6 Market opportunity by Technology
        • Exhibit 46: Market opportunity by Technology ($ billion)
        • Exhibit 47: Data Table on Market opportunity by Technology ($ billion)

      7 Market Segmentation by Distribution Channel

      • 7.1 Market segments
        • Exhibit 48: Chart on Distribution Channel - Market share 2023-2028 (%)
        • Exhibit 49: Data Table on Distribution Channel - Market share 2023-2028 (%)
      • 7.2 Comparison by Distribution Channel
        • Exhibit 50: Chart on Comparison by Distribution Channel
        • Exhibit 51: Data Table on Comparison by Distribution Channel
      • 7.3 Offline - Market size and forecast 2023-2028
        • Exhibit 52: Chart on Offline - Market size and forecast 2023-2028 ($ billion)
        • Exhibit 53: Data Table on Offline - Market size and forecast 2023-2028 ($ billion)
        • Exhibit 54: Chart on Offline - Year-over-year growth 2023-2028 (%)
        • Exhibit 55: Data Table on Offline - Year-over-year growth 2023-2028 (%)
      • 7.4 Online - Market size and forecast 2023-2028
        • Exhibit 56: Chart on Online - Market size and forecast 2023-2028 ($ billion)
        • Exhibit 57: Data Table on Online - Market size and forecast 2023-2028 ($ billion)
        • Exhibit 58: Chart on Online - Year-over-year growth 2023-2028 (%)
        • Exhibit 59: Data Table on Online - Year-over-year growth 2023-2028 (%)
      • 7.5 Market opportunity by Distribution Channel
        • Exhibit 60: Market opportunity by Distribution Channel ($ billion)
        • Exhibit 61: Data Table on Market opportunity by Distribution Channel ($ billion)

      8 Customer Landscape

      • 8.1 Customer landscape overview
        • Exhibit 62: Analysis of price sensitivity, lifecycle, customer purchase basket, adoption rates, and purchase criteria

      9 Geographic Landscape

      • 9.1 Geographic segmentation
        • Exhibit 63: Chart on Market share by geography 2023-2028 (%)
        • Exhibit 64: Data Table on Market share by geography 2023-2028 (%)
      • 9.2 Geographic comparison
        • Exhibit 65: Chart on Geographic comparison
        • Exhibit 66: Data Table on Geographic comparison
      • 9.3 APAC - Market size and forecast 2023-2028
        • Exhibit 67: Chart on APAC - Market size and forecast 2023-2028 ($ billion)
        • Exhibit 68: Data Table on APAC - Market size and forecast 2023-2028 ($ billion)
        • Exhibit 69: Chart on APAC - Year-over-year growth 2023-2028 (%)
        • Exhibit 70: Data Table on APAC - Year-over-year growth 2023-2028 (%)
      • 9.4 North America - Market size and forecast 2023-2028
        • Exhibit 71: Chart on North America - Market size and forecast 2023-2028 ($ billion)
        • Exhibit 72: Data Table on North America - Market size and forecast 2023-2028 ($ billion)
        • Exhibit 73: Chart on North America - Year-over-year growth 2023-2028 (%)
        • Exhibit 74: Data Table on North America - Year-over-year growth 2023-2028 (%)
      • 9.5 Europe - Market size and forecast 2023-2028
        • Exhibit 75: Chart on Europe - Market size and forecast 2023-2028 ($ billion)
        • Exhibit 76: Data Table on Europe - Market size and forecast 2023-2028 ($ billion)
        • Exhibit 77: Chart on Europe - Year-over-year growth 2023-2028 (%)
        • Exhibit 78: Data Table on Europe - Year-over-year growth 2023-2028 (%)
      • 9.6 South America - Market size and forecast 2023-2028
        • Exhibit 79: Chart on South America - Market size and forecast 2023-2028 ($ billion)
        • Exhibit 80: Data Table on South America - Market size and forecast 2023-2028 ($ billion)
        • Exhibit 81: Chart on South America - Year-over-year growth 2023-2028 (%)
        • Exhibit 82: Data Table on South America - Year-over-year growth 2023-2028 (%)
      • 9.7 Middle East and Africa - Market size and forecast 2023-2028
        • Exhibit 83: Chart on Middle East and Africa - Market size and forecast 2023-2028 ($ billion)
        • Exhibit 84: Data Table on Middle East and Africa - Market size and forecast 2023-2028 ($ billion)
        • Exhibit 85: Chart on Middle East and Africa - Year-over-year growth 2023-2028 (%)
        • Exhibit 86: Data Table on Middle East and Africa - Year-over-year growth 2023-2028 (%)
      • 9.8 China - Market size and forecast 2023-2028
        • Exhibit 87: Chart on China - Market size and forecast 2023-2028 ($ billion)
        • Exhibit 88: Data Table on China - Market size and forecast 2023-2028 ($ billion)
        • Exhibit 89: Chart on China - Year-over-year growth 2023-2028 (%)
        • Exhibit 90: Data Table on China - Year-over-year growth 2023-2028 (%)
      • 9.9 US - Market size and forecast 2023-2028
        • Exhibit 91: Chart on US - Market size and forecast 2023-2028 ($ billion)
        • Exhibit 92: Data Table on US - Market size and forecast 2023-2028 ($ billion)
        • Exhibit 93: Chart on US - Year-over-year growth 2023-2028 (%)
        • Exhibit 94: Data Table on US - Year-over-year growth 2023-2028 (%)
      • 9.10 Japan - Market size and forecast 2023-2028
        • Exhibit 95: Chart on Japan - Market size and forecast 2023-2028 ($ billion)
        • Exhibit 96: Data Table on Japan - Market size and forecast 2023-2028 ($ billion)
        • Exhibit 97: Chart on Japan - Year-over-year growth 2023-2028 (%)
        • Exhibit 98: Data Table on Japan - Year-over-year growth 2023-2028 (%)
      • 9.11 Germany - Market size and forecast 2023-2028
        • Exhibit 99: Chart on Germany - Market size and forecast 2023-2028 ($ billion)
        • Exhibit 100: Data Table on Germany - Market size and forecast 2023-2028 ($ billion)
        • Exhibit 101: Chart on Germany - Year-over-year growth 2023-2028 (%)
        • Exhibit 102: Data Table on Germany - Year-over-year growth 2023-2028 (%)
      • 9.12 France - Market size and forecast 2023-2028
        • Exhibit 103: Chart on France - Market size and forecast 2023-2028 ($ billion)
        • Exhibit 104: Data Table on France - Market size and forecast 2023-2028 ($ billion)
        • Exhibit 105: Chart on France - Year-over-year growth 2023-2028 (%)
        • Exhibit 106: Data Table on France - Year-over-year growth 2023-2028 (%)
      • 9.13 Market opportunity by geography
        • Exhibit 107: Market opportunity by geography ($ billion)
        • Exhibit 108: Data Tables on Market opportunity by geography ($ billion)

      10 Drivers, Challenges, and Trends

      • 10.1 Market drivers
        • 10.2 Market challenges
          • 10.3 Impact of drivers and challenges
            • Exhibit 109: Impact of drivers and challenges in 2023 and 2028
          • 10.4 Market trends

            11 Vendor Landscape

            • 11.1 Overview
              • 11.2 Vendor landscape
                • Exhibit 110: Overview on Criticality of inputs and Factors of differentiation
              • 11.3 Landscape disruption
                • Exhibit 111: Overview on factors of disruption
              • 11.4 Industry risks
                • Exhibit 112: Impact of key risks on business

              12 Vendor Analysis

              • 12.1 Vendors covered
                • Exhibit 113: Vendors covered
              • 12.2 Market positioning of vendors
                • Exhibit 114: Matrix on vendor position and classification
              • 12.3 Actis Technologies Pvt. Ltd.
                • Exhibit 115: Actis Technologies Pvt. Ltd. - Overview
                • Exhibit 116: Actis Technologies Pvt. Ltd. - Product / Service
                • Exhibit 117: Actis Technologies Pvt. Ltd. - Key offerings
              • 12.4 Anker Technology UK Ltd.
                • Exhibit 118: Anker Technology UK Ltd. - Overview
                • Exhibit 119: Anker Technology UK Ltd. - Product / Service
                • Exhibit 120: Anker Technology UK Ltd. - Key offerings
              • 12.5 Canon Inc.
                • Exhibit 121: Canon Inc. - Overview
                • Exhibit 122: Canon Inc. - Business segments
                • Exhibit 123: Canon Inc. - Key news
                • Exhibit 124: Canon Inc. - Key offerings
                • Exhibit 125: Canon Inc. - Segment focus
              • 12.6 Coretronic Corp.
                • Exhibit 126: Coretronic Corp. - Overview
                • Exhibit 127: Coretronic Corp. - Business segments
                • Exhibit 128: Coretronic Corp. - Key offerings
                • Exhibit 129: Coretronic Corp. - Segment focus
              • 12.7 Dell Technologies Inc.
                • Exhibit 130: Dell Technologies Inc. - Overview
                • Exhibit 131: Dell Technologies Inc. - Business segments
                • Exhibit 132: Dell Technologies Inc. - Key news
                • Exhibit 133: Dell Technologies Inc. - Key offerings
                • Exhibit 134: Dell Technologies Inc. - Segment focus
              • 12.8 Delta Electronics Inc.
                • Exhibit 135: Delta Electronics Inc. - Overview
                • Exhibit 136: Delta Electronics Inc. - Business segments
                • Exhibit 137: Delta Electronics Inc. - Key offerings
                • Exhibit 138: Delta Electronics Inc. - Segment focus
              • 12.9 Hitachi Ltd.
                • Exhibit 139: Hitachi Ltd. - Overview
                • Exhibit 140: Hitachi Ltd. - Business segments
                • Exhibit 141: Hitachi Ltd. - Key news
                • Exhibit 142: Hitachi Ltd. - Key offerings
                • Exhibit 143: Hitachi Ltd. - Segment focus
              • 12.10 Koninklijke Philips N.V.
                • Exhibit 144: Koninklijke Philips N.V. - Overview
                • Exhibit 145: Koninklijke Philips N.V. - Business segments
                • Exhibit 146: Koninklijke Philips N.V. - Key news
                • Exhibit 147: Koninklijke Philips N.V. - Key offerings
                • Exhibit 148: Koninklijke Philips N.V. - Segment focus
              • 12.11 LG Electronics Inc.
                • Exhibit 149: LG Electronics Inc. - Overview
                • Exhibit 150: LG Electronics Inc. - Product / Service
                • Exhibit 151: LG Electronics Inc. - Key offerings
              • 12.12 Maxell Holdings Ltd.
                • Exhibit 152: Maxell Holdings Ltd. - Overview
                • Exhibit 153: Maxell Holdings Ltd. - Business segments
                • Exhibit 154: Maxell Holdings Ltd. - Key news
                • Exhibit 155: Maxell Holdings Ltd. - Key offerings
                • Exhibit 156: Maxell Holdings Ltd. - Segment focus
              • 12.13 Mitsubishi Electric Corp.
                • Exhibit 157: Mitsubishi Electric Corp. - Overview
                • Exhibit 158: Mitsubishi Electric Corp. - Business segments
                • Exhibit 159: Mitsubishi Electric Corp. - Key news
                • Exhibit 160: Mitsubishi Electric Corp. - Key offerings
                • Exhibit 161: Mitsubishi Electric Corp. - Segment focus
              • 12.14 Qisda Corp.
                • Exhibit 162: Qisda Corp. - Overview
                • Exhibit 163: Qisda Corp. - Product / Service
                • Exhibit 164: Qisda Corp. - Key offerings
              • 12.15 Samsung Electronics Co. Ltd.
                • Exhibit 165: Samsung Electronics Co. Ltd. - Overview
                • Exhibit 166: Samsung Electronics Co. Ltd. - Business segments
                • Exhibit 167: Samsung Electronics Co. Ltd. - Key news
                • Exhibit 168: Samsung Electronics Co. Ltd. - Key offerings
                • Exhibit 169: Samsung Electronics Co. Ltd. - Segment focus
              • 12.16 Sharp Corp.
                • Exhibit 170: Sharp Corp. - Overview
                • Exhibit 171: Sharp Corp. - Business segments
                • Exhibit 172: Sharp Corp. - Key news
                • Exhibit 173: Sharp Corp. - Key offerings
                • Exhibit 174: Sharp Corp. - Segment focus
              • 12.17 Sony Group Corp.
                • Exhibit 175: Sony Group Corp. - Overview
                • Exhibit 176: Sony Group Corp. - Business segments
                • Exhibit 177: Sony Group Corp. - Key news
                • Exhibit 178: Sony Group Corp. - Key offerings
                • Exhibit 179: Sony Group Corp. - Segment focus

              13 Appendix

              • 13.1 Scope of the report
                • 13.2 Inclusions and exclusions checklist
                  • Exhibit 180: Inclusions checklist
                  • Exhibit 181: Exclusions checklist
                • 13.3 Currency conversion rates for US$
                  • Exhibit 182: Currency conversion rates for US$
                • 13.4 Research methodology
                  • Exhibit 183: Research methodology
                  • Exhibit 184: Validation techniques employed for market sizing
                  • Exhibit 185: Information sources
                • 13.5 List of abbreviations
                  • Exhibit 186: List of abbreviations

                Research Methodology

                Technavio presents a detailed picture of the market by way of study, synthesis, and summation of data from multiple sources. The analysts have presented the various facets of the market with a particular focus on identifying the key industry influencers. The data thus presented is comprehensive, reliable, and the result of extensive research, both primary and secondary.

                INFORMATION SOURCES

                Primary sources

                • Manufacturers and suppliers
                • Channel partners
                • Industry experts
                • Strategic decision makers

                Secondary sources

                • Industry journals and periodicals
                • Government data
                • Financial reports of key industry players
                • Historical data
                • Press releases

                DATA ANALYSIS

                Data Synthesis

                • Collation of data
                • Estimation of key figures
                • Analysis of derived insights

                Data Validation

                • Triangulation with data models
                • Reference against proprietary databases
                • Corroboration with industry experts

                REPORT WRITING

                Qualitative

                • Market drivers
                • Market challenges
                • Market trends
                • Five forces analysis

                Quantitative

                • Market size and forecast
                • Market segmentation
                • Geographical insights
                • Competitive landscape

                Interested in this report?

                Get your sample now to see our research methodology and insights!

                Download Now

                Frequently Asked Questions

                Multimedia Projector market growth will increase by $ 7.66 bn during 2024-2028 .

                The Multimedia Projector market is expected to grow at a CAGR of 8.55% during 2024-2028 .

                Multimedia Projector market is segmented by Technology( DLP, LCD, Others) Distribution Channel( Offline, Online, Europe, South America)

                Actis Technologies Pvt. Ltd., Canon Inc., Coretronic Corp., Dell Technologies Inc., Delta Electronics Inc., Hitachi Ltd., Koninklijke Philips N.V., LG Electronics Inc., Maxell Holdings Ltd., Mitsubishi Electric Corp., Panasonic Holdings Corp., Protonix Fortuner India Pvt. Ltd., Qisda Corp., Ricoh Co. Ltd., Samsung Electronics Co. Ltd., Seiko Epson Corp., Sharp Corp., Sony Group Corp., ViewSonic Corp., Anker Technology UK Ltd. are a few of the key vendors in the Multimedia Projector market.

                APAC will register the highest growth rate of 47% among the other regions. Therefore, the Multimedia Projector market in APAC is expected to garner significant business opportunities for the vendors during the forecast period.

                US, China, Japan, Germany, France

                • Growing demand for projectors in education and corporate sectorsThe growing demand for projectors in the corporate and education sectors is likely to drive the growth of the global multimedia projector market during the forecast period. In the education sector is the driving factor this market.
                • projectors are being used in schools and colleges as classrooms are going paperless; in the corporate sector is the driving factor this market.
                • they are being used for activities such as business presentations and discussion of project plans. In developed countries in North America and Europe is the driving factor this market.
                • the use of smart classrooms and e-learning is being promoted in schools. The smart classroom technology and interactive whiteboards is the driving factor this market.
                • including multimedia projectors is the driving factor this market.
                • help disseminate information with the help of photos is the driving factor this market.
                • maps is the driving factor this market.
                • graphs is the driving factor this market.
                • flowcharts is the driving factor this market.
                • and animated videos is the driving factor this market.
                • which makes concepts more interesting and easy to understand and learning more fun. This enhances the student's ability to learn and memorize the topic for a prolonged period. The initiatives from vendors toward making technology adoption easier and more affordable for schools will further boost the demand for multimedia projectors in the education sector. For instance is the driving factor this market.
                • BenQ Corp. has collaborated with education system integrators is the driving factor this market.
                • including Ebix Smart Class is the driving factor this market.
                • Next Education is the driving factor this market.
                • Tata Class Edge is the driving factor this market.
                • and Extra Marks is the driving factor this market.
                • in India. Such initiatives from vendors will increase the adoption of multimedia projectors with inbuilt smart classroom technology in schools and colleges. This will propel the growth of the global multimedia projector market during the forecast period. The advanced features of multimedia projectors such as compatibility with laptops and media players and the ability to display presentations is the driving factor this market.
                • videos is the driving factor this market.
                • and photos on a bigger screen have boosted their adoption in the corporate sector. Projectors incorporate user-friendly interactive software that requires minimal time for set up. With the help of multimedia projectors is the driving factor this market.
                • presenters can create drawings in vibrant colors using a stylus is the driving factor this market.
                • create maps and charts is the driving factor this market.
                • and use videos in presentations. They can also use in-built productivity tools of multimedia projectors to make their content easy to understand gain the audience's attention and engage them. Multimedia projectors enable the users to switch between frequently used text is the driving factor this market.
                • images is the driving factor this market.
                • and videos. Thus is the driving factor this market.
                • an increase in the demand for multimedia projectors in the corporate sector will drive the growth of the global multimedia projector market during the forecast period. is the driving factor this market.

                The Multimedia Projector market vendors should focus on grabbing business opportunities from the DLP segment as it accounted for the largest market share in the base year.