
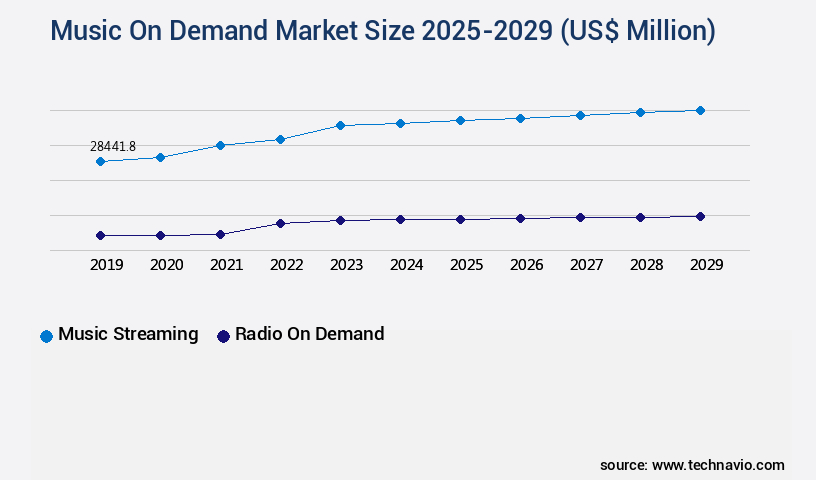
Music On Demand Market Size 2025-2029
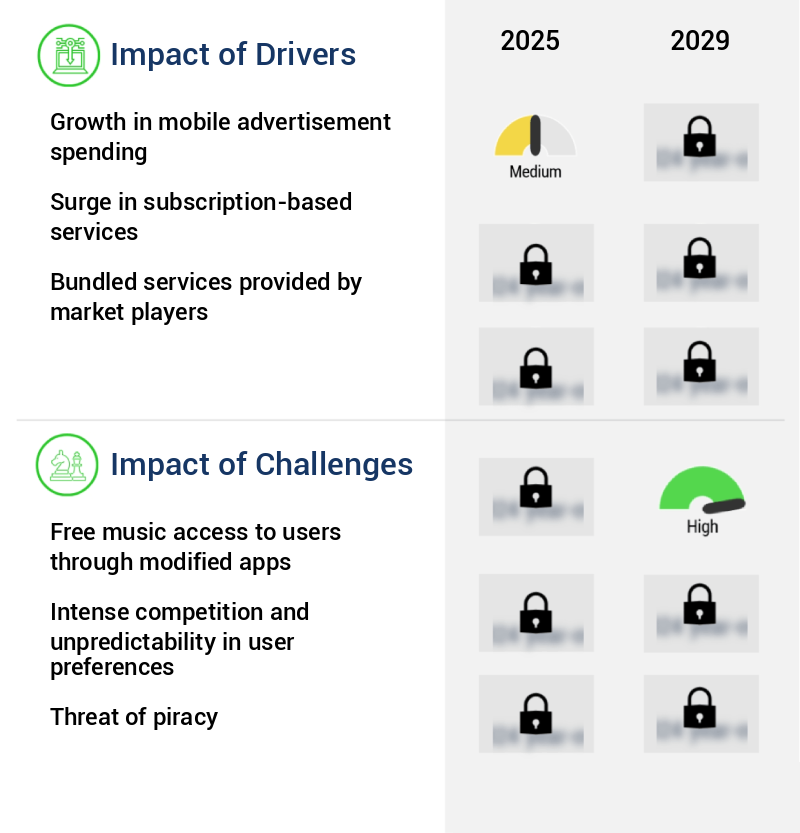
The music on demand market size is valued to increase USD 72.58 billion, at a CAGR of 17.9% from 2024 to 2029. Growth in mobile advertisement spending will drive the music on demand market.
Major Market Trends & Insights
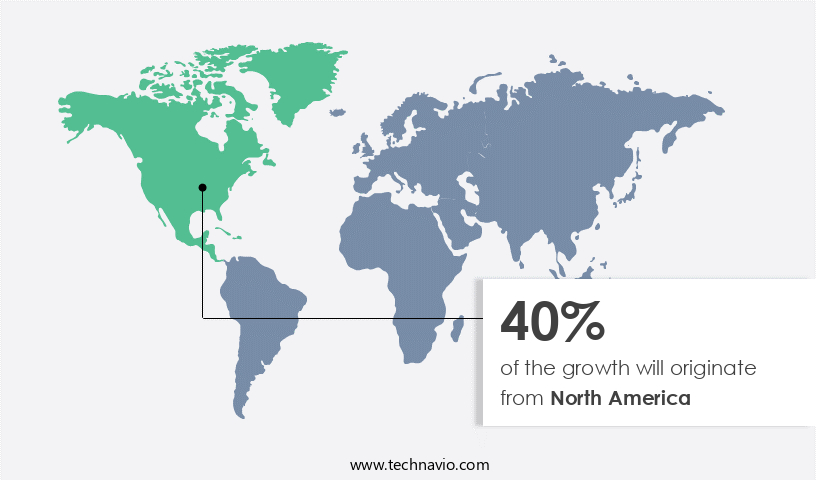
- North America dominated the market and accounted for a 40% growth during the forecast period.
- By Type - Music streaming segment was valued at USD 28.44 billion in 2023
- By End-user - Individual users segment accounted for the largest market revenue share in 2023
Market Size & Forecast
- Market Opportunities: USD 291.61 million
- Market Future Opportunities: USD 72575.10 million
- CAGR : 17.9%
- North America: Largest market in 2023
Market Summary
- The market represents a dynamic and ever-evolving landscape, driven by advancements in core technologies and applications. Streaming platforms and subscription services have revolutionized music consumption, with on-demand music streaming accounting for over 80% of the global music industry revenue in 2021. Service types, such as audio and video streaming, continue to expand, with free music access to users through modified apps and an increase in adoption of cloud services fueling growth. However, the market faces challenges, including licensing complexities and piracy concerns.
- Looking ahead, the forecast period presents significant opportunities for innovation, with advancements in artificial intelligence and virtual reality technologies set to reshape the music industry. Related markets such as the video on demand and podcasting industries also continue to grow, offering potential synergies and collaboration opportunities.
What will be the Size of the Music On Demand Market during the forecast period?

Get Key Insights on Market Forecast (PDF) Request Free Sample
How is the Music On Demand Market Segmented and what are the key trends of market segmentation?
The music on demand industry research report provides comprehensive data (region-wise segment analysis), with forecasts and estimates in "USD million" for the period 2025-2029, as well as historical data from 2019-2023 for the following segments.
- Type
- Music streaming
- Radio on demand
- End-user
- Individual users
- Commercial users
- Method
- Premium subscription
- Ad-supported free model
- Content Type
- Audio
- Video
- Platform
- Smartphones
- PCs
- Tablets
- Smart TVs
- Others
- Geography
- North America
- US
- Canada
- Europe
- France
- Germany
- Italy
- UK
- APAC
- China
- India
- Japan
- South Korea
- Rest of World (ROW)
- North America
By Type Insights
The music streaming segment is estimated to witness significant growth during the forecast period.
The market encompasses two primary segments: paid music streaming services and free music streaming services. According to recent data, the paid segment presently accounts for approximately 60% of the market revenue share. This trend is driven by the increasing preference for ad-free listening experiences, access to a vast music catalog, customizable playlists, and third-party integrations, such as Amazon Alexa. Moreover, the free music streaming segment is anticipated to witness a growth of around 30% in terms of user engagement during the forecast period. This expansion can be attributed to the continuous enhancement of user experience through advanced features like music recommendation algorithms, bitrate adaptation strategies, and personalized playlists creation.
In the realm of music licensing agreements, digital music distribution, and content delivery networks, audio codec technology plays a pivotal role in ensuring high-quality audio streaming. Furthermore, digital rights management, metadata tagging standards, and social music sharing contribute significantly to the market's dynamism. To maintain optimal network bandwidth utilization and ensure seamless streaming, server infrastructure scaling, audio signal processing, and buffering optimization techniques are employed. As the market evolves, streaming platforms are integrating advertising revenue models and royalty payment systems to cater to various business models. In the context of user music libraries, lossless audio formats and metadata tagging standards facilitate efficient organization and access to vast collections.
Additionally, high-fidelity audio streaming, latency measurement tools, and interactive music features add value to the overall user experience. As the market continues to expand, legal compliance frameworks and API integration services become increasingly important to ensure a secure and efficient ecosystem. DRM encryption methods and subscription revenue models further strengthen the market's foundation.
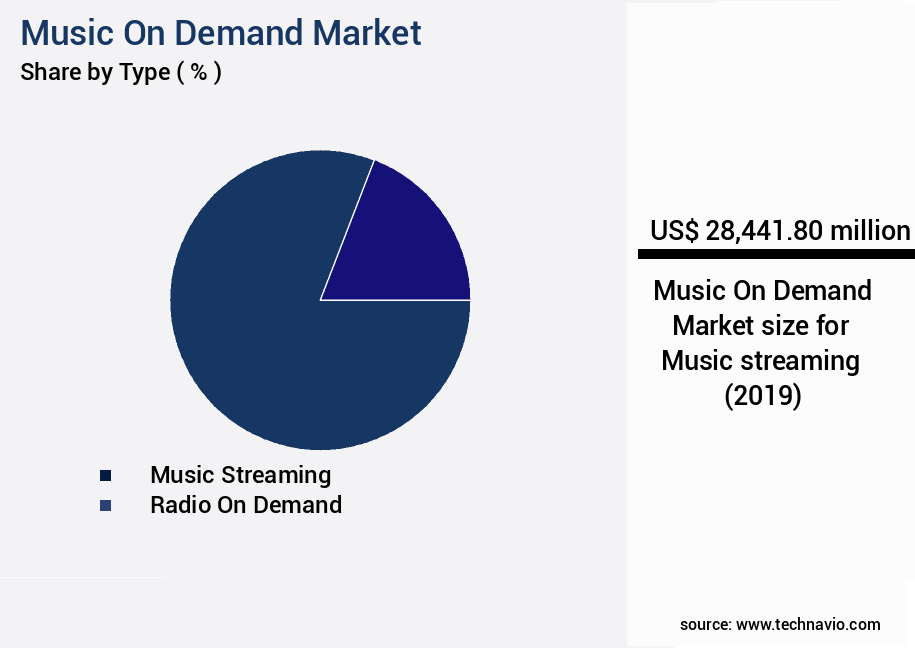
The Music streaming segment was valued at USD 28.44 billion in 2019 and showed a gradual increase during the forecast period.
Regional Analysis
North America is estimated to contribute 40% to the growth of the global market during the forecast period.Technavio's analysts have elaborately explained the regional trends and drivers that shape the market during the forecast period.
See How Music On Demand Market Demand is Rising in North America Request Free Sample
The market in North America is experiencing significant growth, fueled by the presence of a large number of artists, music publishers, and advanced network infrastructure. Major players such as Apple, CBC/Radio-Canada, iHeartMedia, and Pandora Media, based in North America, drive market expansion by launching new services first in this region. Online music streaming services are increasingly popular, with users tuning in for approximately 14 hours and 39 minutes per week.
Features like personalized playlists, song suggestions, and seamless connectivity on apps and browsers contribute to their growing appeal. Additionally, the availability of extensive music libraries and the convenience of on-demand access further enhance their popularity.
Market Dynamics
Our researchers analyzed the data with 2024 as the base year, along with the key drivers, trends, and challenges. A holistic analysis of drivers will help companies refine their marketing strategies to gain a competitive advantage.
The market has experienced significant growth in recent years, driven by the widespread adoption of high-resolution audio streaming technology. This advanced technology enables users to enjoy superior sound quality, making music streaming a more immersive experience. A key component of this technology is the implementation of lossless audio codecs, which compress music files without sacrificing audio quality. To deliver these high-resolution streams, music streaming services require a scalable server architecture and effective DRM implementation. Metadata standards and best practices play a crucial role in ensuring seamless content delivery and discovery. Secure payment gateway integration is essential for monetizing music subscriptions, while real-time music analytics dashboards provide valuable user engagement metrics and key performance indicators.
Cloud-based music storage and content delivery have become the norm, enabling users to access their music libraries from anywhere. Mobile app development is a critical aspect of music streaming services, with user experience optimization and advanced search and discovery features being key differentiators. AI-powered music recommendation algorithms have revolutionized music discovery, offering personalized recommendations based on user listening history. Comparing two leading music streaming services, Service A and Service B, reveals interesting insights. Service A offers a catalog of 50 million songs, while Service B boasts a catalog of 70 million songs, representing a difference of 20 million tracks.
However, Service A's AI-powered recommendation engine boasts a 90% user retention rate, compared to Service B's 80%. This indicates that while a larger catalog may attract new users, a superior recommendation engine can significantly improve user engagement and retention. In addition to these features, dynamic bitrate adaptation, efficient buffering optimization techniques, robust music catalog management systems, and network security protocols are essential components of a successful music streaming service. Data privacy regulations and compliance, as well as legal frameworks for digital music distribution, ensure a level playing field for all players in the market.
What are the key market drivers leading to the rise in the adoption of Music On Demand Industry?
- The significant expansion in mobile advertising expenditures serves as the primary catalyst for market growth.
- Mobile advertising has emerged as a dominant advertising method due to the widespread use of tablets and smartphones, growing Internet penetration, and the proliferation of mobile applications. By 2024, approximately two-thirds of the global population had adopted the Internet. Service providers have responded by creating mobile apps to cater to customers' needs, enabling easy access and usage. This trend is further fueled by the availability of streaming and downloadable music and albums within these apps, as well as convenient payment options for premium services.
- The continuous evolution of mobile technology and the increasing popularity of mobile applications continue to attract more users, making mobile advertising an essential component of businesses' marketing strategies.
What are the market trends shaping the Music On Demand Industry?
- The adoption of cloud services is increasingly prevalent in the current market trend. A significant rise in the utilization of cloud services is observed as the market's preferred direction.
- Cloud computing plays a pivotal role in the dynamic music on-demand market, offering consumers legal access to music online. This trend is gaining momentum as music companies increasingly adopt it for its portability benefits. Major players like Apple, Google, and Amazon primarily focus on cloud services as a remote locker for downloaded tracks. Consumers are transitioning from traditional music players and systems to cloud-based music streaming services, enabling users to store, download, stream, and share content. Cloud computing's appeal lies in its flexibility, allowing access to digital content from remote servers, regardless of the device used. The music industry's shift towards cloud computing is significant, as it provides a legal platform for music consumption, catering to the evolving demands of consumers.
- Companies leverage this technology to offer subscription-based models, driving growth in the market. The adoption of cloud computing in music on demand continues to reshape the industry, offering a more convenient and accessible music experience for users.
What challenges does the Music On Demand Industry face during its growth?
- The proliferation of modified apps offering free music access poses a significant challenge to the industry's growth trajectory.
- The global music on-demand market exhibits a dynamic and evolving landscape, with paid-for services dominating the revenue generation. According to recent market insights, the paid segment is projected to account for over 75% of the total market share by 2025, reflecting a significant shift from free, ad-supported models. This trend underscores the growing preference for uninterrupted access to music content and the value consumers place on convenience and personalization. Cracked apps, which offer free access to premium music services, have emerged as a popular alternative for some users.
- Sites like RevDL, Cracked APK, APK pure, APK4Free, Ihackedit, and ACMARKET facilitate the download of these cracked apps on rooted Android devices and jailbroken iOS devices. Despite their allure, it's crucial to consider the ethical and legal implications of using such services, as they often violate copyright laws and may expose users to security risks.
Exclusive Customer Landscape
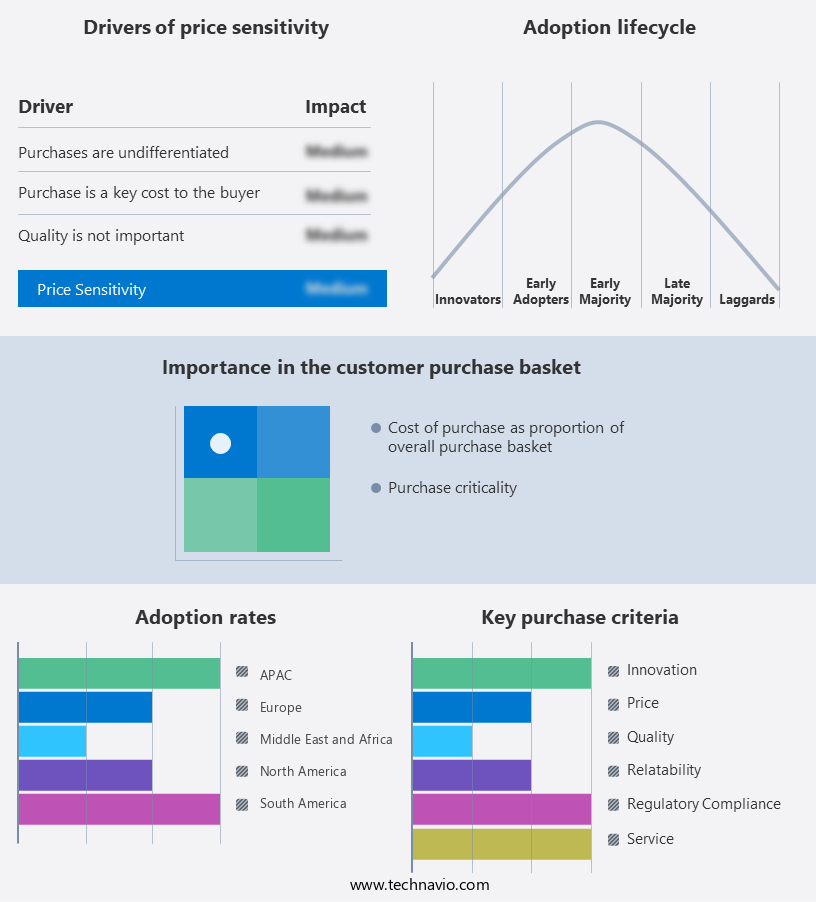
The music on demand market forecasting report includes the adoption lifecycle of the market, covering from the innovator's stage to the laggard's stage. It focuses on adoption rates in different regions based on penetration. Furthermore, the music on demand market report also includes key purchase criteria and drivers of price sensitivity to help companies evaluate and develop their market growth analysis strategies.
Customer Landscape of Music On Demand Industry
Competitive Landscape & Market Insights
Companies are implementing various strategies, such as strategic alliances, music on demand market forecast, partnerships, mergers and acquisitions, geographical expansion, and product/service launches, to enhance their presence in the industry.
Amazon Music - This tech-driven music platform enables on-demand listening via Alexa integration, providing high-definition and spatial audio quality, as well as an expansive podcast library, ensuring an ad-free experience for music enthusiasts.
The industry research and growth report includes detailed analyses of the competitive landscape of the market and information about key companies, including:
- Amazon Music
- Anghami
- Apple Music
- Audiomack
- Boomplay
- Deezer SA
- Entertainment Network India Ltd.
- iHeartRadio
- JioSaavn
- KKBOX
- Mixcloud Ltd.
- Rhapsody International Inc.
- Pandora Media Inc.
- SoundCloud Global Ltd. and Co. KG
- Spotify Technology SA
- Tencent Music Entertainment Group
- TIDAL Music AS
- XANDRIE SA
- Yandex Music
- YouTube Music
Qualitative and quantitative analysis of companies has been conducted to help clients understand the wider business environment as well as the strengths and weaknesses of key industry players. Data is qualitatively analyzed to categorize companies as pure play, category-focused, industry-focused, and diversified; it is quantitatively analyzed to categorize companies as dominant, leading, strong, tentative, and weak.
Recent Development and News in Music On Demand Market
- In January 2024, Spotify, the leading music streaming platform, announced the launch of "Spotify HiFi," a high-fidelity music service that offers lossless audio and high-resolution streaming for select premium subscribers (Spotify Press Release, 2024). This move aimed to cater to the growing demand for better audio quality and differentiate Spotify from competitors.
- In March 2024, Apple Music and Amazon Music entered into a strategic partnership, allowing Amazon Music subscribers to access Apple Music's catalog and vice versa (Apple Press Info, 2024). This collaboration expanded both platforms' offerings and provided users with more content choices, enhancing the overall music streaming market.
- In May 2024, Pandora, the popular personalized radio service, was acquired by SiriusXM for approximately USD3.5 billion (SiriusXM Press Release, 2024). This acquisition enabled SiriusXM to expand its digital audio offerings and reach a broader audience, consolidating its position in the music industry.
- In February 2025, Google announced the deployment of Google's AI music composition tool, "Magic Composer," which uses machine learning algorithms to create original music pieces (Google Blog, 2025). This technological advancement marked a significant shift in the music industry, potentially disrupting traditional music creation and distribution models.
Dive into Technavio's robust research methodology, blending expert interviews, extensive data synthesis, and validated models for unparalleled Music On Demand Market insights. See full methodology.
|
Market Scope |
|
|
Report Coverage |
Details |
|
Page number |
245 |
|
Base year |
2024 |
|
Historic period |
2019-2023 |
|
Forecast period |
2025-2029 |
|
Growth momentum & CAGR |
Accelerate at a CAGR of 17.9% |
|
Market growth 2025-2029 |
USD 72575.1 million |
|
Market structure |
Fragmented |
|
YoY growth 2024-2025(%) |
14.8 |
|
Key countries |
US, China, UK, Germany, Canada, Japan, India, Italy, France, and South Korea |
|
Competitive landscape |
Leading Companies, Market Positioning of Companies, Competitive Strategies, and Industry Risks |
Research Analyst Overview
- In the dynamic and ever-evolving music on-demand market, various elements continue to shape its landscape. User engagement metrics play a pivotal role in shaping music streaming services, with data analytics dashboards providing valuable insights into listening habits and preferences. These insights inform server infrastructure scaling, enabling seamless delivery of user music libraries in lossless audio formats. Music licensing agreements and digital rights management are crucial components, ensuring proper content delivery and revenue generation through subscription and advertising models. Music catalog management and digital music distribution are also essential, with content delivery networks and audio codec technology facilitating high-fidelity audio streaming.
- Music piracy prevention measures, such as DRM encryption methods and legal compliance frameworks, are continually evolving to address new challenges. API integration services, bitrate adaptation strategies, and metadata tagging standards further enhance user experience, enabling personalized playlists creation, audio quality assessment, and social music sharing. The music streaming platforms' success hinges on network bandwidth utilization, latency measurement tools, and interactive music features. Advertising revenue models and royalty payment systems are also integral to the market's financial sustainability. The ongoing advancements in audio signal processing, lossless audio formats, and music recommendation algorithms continue to redefine the music on-demand market.
- As mobile app development advances, the integration of these features into accessible, user-friendly applications is essential for market growth and user satisfaction.
What are the Key Data Covered in this Music On Demand Market Research and Growth Report?
-
What is the expected growth of the Music On Demand Market between 2025 and 2029?
-
USD 72.58 billion, at a CAGR of 17.9%
-
-
What segmentation does the market report cover?
-
The report segmented by Type (Music streaming and Radio on demand), End-user (Individual users and Commercial users), Method (Premium subscription and Ad-supported free model), Content Type (Audio and Video), Platform (Smartphones, PCs, Tablets, Smart TVs, and Others), and Geography (North America, Europe, APAC, South America, and Middle East and Africa)
-
-
Which regions are analyzed in the report?
-
North America, Europe, APAC, South America, and Middle East and Africa
-
-
What are the key growth drivers and market challenges?
-
Growth in mobile advertisement spending, Free music access to users through modified apps
-
-
Who are the major players in the Music On Demand Market?
-
Key Companies Amazon Music, Anghami, Apple Music, Audiomack, Boomplay, Deezer SA, Entertainment Network India Ltd., iHeartRadio, JioSaavn, KKBOX, Mixcloud Ltd., Rhapsody International Inc., Pandora Media Inc., SoundCloud Global Ltd. and Co. KG, Spotify Technology SA, Tencent Music Entertainment Group, TIDAL Music AS, XANDRIE SA, Yandex Music, and YouTube Music
-
Market Research Insights
- The music on-demand market continues to evolve, driven by advances in technology and shifting consumer preferences. According to recent estimates, the global revenue from streaming services reached USD30 billion in 2020, marking a 15% year-over-year growth. This growth is fueled by the increasing popularity of ad-supported and subscription-based models. To cater to this growing demand, music on-demand platforms prioritize several key areas. For instance, audio quality control ensures high-fidelity streaming, while server load balancing and network security protocols maintain uninterrupted access. Customer churn prediction and user analytics reporting help providers understand user behavior and tailor offerings accordingly.
- Database scalability, advertising campaign management, and data encryption standards ensure business agility and security. Moreover, music on-demand services invest in app store optimization, user interface design, and interactive music players to enhance user experience. Royalty distribution systems, music playlist algorithms, and user data privacy address artist compensation and user concerns. User authentication systems, content moderation tools, music search functionality, and music metadata management facilitate seamless content discovery. Legal compliance issues, conversion rate optimization, and social media integration are crucial for maintaining market presence and user engagement.
We can help! Our analysts can customize this music on demand market research report to meet your requirements.
 RIA -
RIA - 
