Natural Cosmetics Market Analysis, Size, and Forecast 2026-2030: Europe (Germany, France, and UK), APAC (China, Japan, and South Korea), North America (US, Canada, and Mexico), South America (Brazil and Argentina), Middle East and Africa (Saudi Arabia, UAE, and South Africa), and Rest of World (ROW)

Natural Cosmetics Market Analysis, Size, and Forecast 2026-2030:
Europe (Germany, France, and UK), APAC (China, Japan, and South Korea), North America (US, Canada, and Mexico), South America (Brazil and Argentina), Middle East and Africa (Saudi Arabia, UAE, and South Africa), and Rest of World (ROW)

Published: Mar 2026 288 Pages SKU: IRTNTR71623

Market Overview at a Glance

$9.73 B
Market Opportunity
6.2%
CAGR 2025 - 2030
38.2%
Europe Growth
$21.39 B
Offline segment 2024

Natural Cosmetics Market Size 2026-2030

The natural cosmetics market size is valued to increase by USD 9.73 billion, at a CAGR of 6.2% from 2025 to 2030. Integration of metabolic beauty and cellular longevity initiatives will drive the natural cosmetics market.

Major Market Trends & Insights

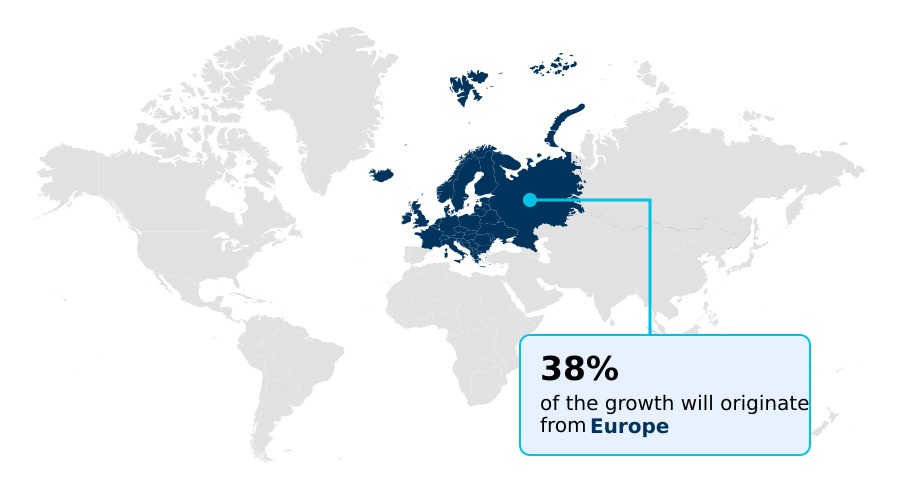
  • Europe dominated the market and accounted for a 38.2% growth during the forecast period.
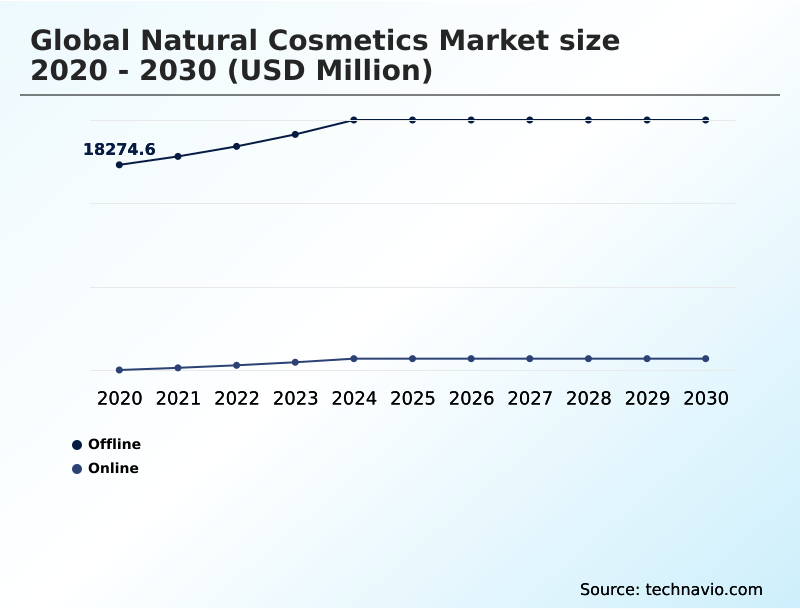
  • By Distribution Channel - Offline segment was valued at USD 21.39 billion in 2024
  • By Type - Personal care segment accounted for the largest market revenue share in 2024

Market Size & Forecast

  • Market Opportunities: USD 15.15 billion
  • Market Future Opportunities: USD 9.73 billion
  • CAGR from 2025 to 2030 : 6.2%

Market Summary

  • The natural cosmetics market is undergoing a significant structural maturation, propelled by heightened consumer demand for ingredient transparency and clean-label formulations. This evolution is defined by a strategic pivot from basic botanical products to sophisticated solutions rooted in green biotechnology and a verifiable commitment to sustainability.
  • The adoption of bio-active compounds, such as plant-derived peptides and fermentation-derived actives, is surging as they offer high-fidelity performance without the ecological footprint of petrochemicals. This shift is reinforced by the integration of circular economy principles, with manufacturers investing in mono-material packaging and refillable systems to address plastic waste.
  • A key operational scenario involves navigating the complex global supply chain for high-purity botanicals while simultaneously adhering to new digital transparency mandates. For instance, a brand must manage the batch-to-batch variability of a wild-harvested extract while ensuring its e-label provides consumers with instantaneous, auditable data on sourcing and safety, balancing natural authenticity with regulatory precision.
  • This dynamic interplay between science, sustainability, and regulation is reshaping industry standards and defining market leadership.

What will be the Size of the Natural Cosmetics Market during the forecast period?

Get Key Insights on Market Forecast (PDF) Request Free Sample

How is the Natural Cosmetics Market Segmented?

The natural cosmetics industry research report provides comprehensive data (region-wise segment analysis), with forecasts and estimates in "USD million" for the period 2026-2030, as well as historical data from 2020-2024 for the following segments.

  • Distribution channel
    • Offline
    • Online
  • Type
    • Personal care
    • Skin care
    • Others
  • Product type
    • Herbal
    • Organic
    • Others
  • Geography
    • Europe
      • Germany
      • France
      • UK
    • APAC
      • China
      • Japan
      • South Korea
    • North America
      • US
      • Canada
      • Mexico
    • South America
      • Brazil
      • Argentina
    • Middle East and Africa
      • Saudi Arabia
      • UAE
      • South Africa
    • Rest of World (ROW)

By Distribution Channel Insights

The offline segment is estimated to witness significant growth during the forecast period.

The offline segment remains the foundational pillar for the natural cosmetics market, where tactile engagement is paramount. Consumers prioritize the sensory experience of testing textures and fragrances, a key factor driving brick-and-mortar sales.

In-store consultations provide expert guidance, assisting consumers in navigating complex ingredient lists for toxin-free skincare and plant-based ingredients.

This channel is crucial for brand discovery and trust-building, particularly as mainstream retailers expand their clean beauty sections, which now command over 81% of total market sales.

The evolution toward sustainable formulations and eco-friendly packaging is also visible on physical shelves, reinforcing the channel's relevance.

These stores serve as hubs for demonstrating products featuring bio-active compounds, ethical sourcing, and botanical extracts, thus educating consumers directly on the benefits of metabolic beauty and cellular longevity.

Request Free Sample

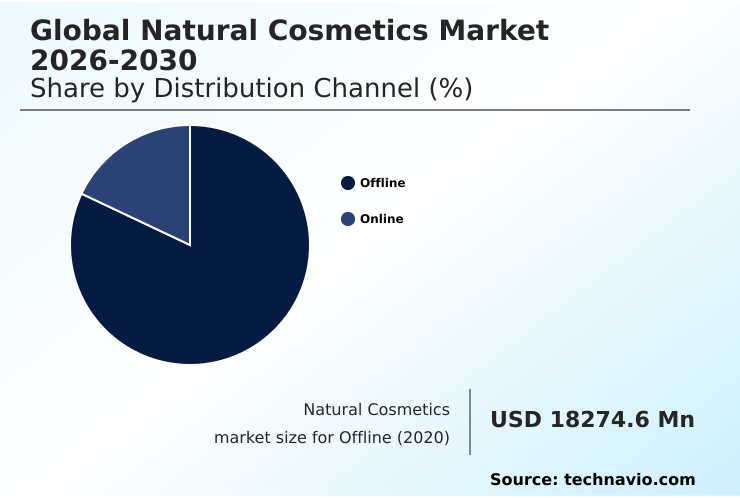
The Offline segment was valued at USD 21.39 billion in 2024 and showed a gradual increase during the forecast period.

Request Free Sample

Regional Analysis

Europe is estimated to contribute 38.2% to the growth of the global market during the forecast period.Technavio’s analysts have elaborately explained the regional trends and drivers that shape the market during the forecast period.

See How Natural Cosmetics Market Demand is Rising in Europe Request Free Sample

The global natural cosmetics market exhibits distinct regional dynamics, with Europe leading in regulatory sophistication and contributing 38% of the market's incremental growth. The region's focus on dermo-cosmetics and cosmeto-vigilance drives demand for certified organic products.

Meanwhile, APAC is the fastest-growing region, where the K-beauty phenomenon and traditions like Jamu herbal tradition influence trends. In this region, a 40% rise in the female workforce in key economies has amplified spending on premium self-care.

North America is characterized by the clean beauty movement and a demand for high-performance vegan beauty and sustainable formulations. The use of upcycled natural ingredients and advanced green chemistry is prevalent.

South America leverages its rich biodiversity for ethical sourcing, while the Middle East and Africa see a convergence of Halal-certified cosmetics and luxury, with blue beauty emerging as a niche.

Market Dynamics

Our researchers analyzed the data with 2025 as the base year, along with the key drivers, trends, and challenges. A holistic analysis of drivers will help companies refine their marketing strategies to gain a competitive advantage.

  • The natural cosmetics market is evolving beyond simple botanical formulations, with a significant focus on advanced, science-backed solutions. The efficacy of natural cosmetics for sensitive skin is now enhanced through green biotechnology for sustainable cosmetics, yielding ingredients that offer clinical-grade results without irritation.
  • This pivot addresses the demand for organic skincare without synthetic preservatives, where brands utilize natural preservative systems for cosmetics that are both safe and effective. The benefits of waterless cosmetic formulations are twofold: they offer higher concentrations of plant-based ingredients for anti-aging and reduce environmental impact.
  • This innovation extends to vegan beauty products for hair care, which now incorporate sophisticated, lab-grown actives in clean skincare. The industry is also tackling transparency; in response to challenges in validating claims, e-labeling for cosmetic ingredient transparency is becoming standard. Brands using blockchain for traceability report verification speeds twice as fast as manual audits.
  • This digital shift helps consumers differentiate authentic products amid concerns over greenwashing claims. Moreover, the role of AI in personalized skincare is expanding, allowing for customized regimens that address specific concerns like pollution defense through climate-adaptive skincare for pollution defense.
  • This tech-forward approach is also seen in marine biotechnology in anti-aging creams and neurocosmetics with mood-enhancing botanicals, showcasing a market defined by innovation and accountability.

What are the key market drivers leading to the rise in the adoption of Natural Cosmetics Industry?

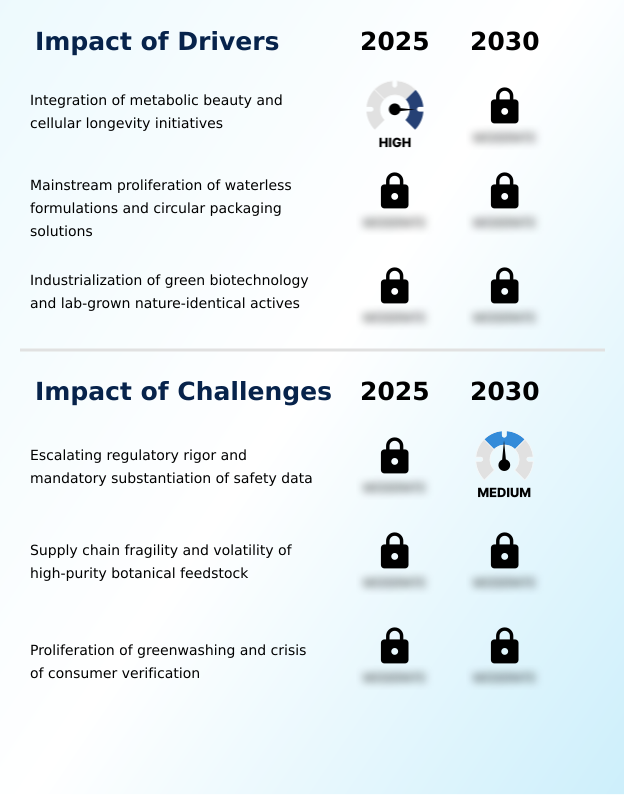
  • The integration of metabolic beauty and cellular longevity initiatives is a key driver propelling market growth.

  • The natural cosmetics market is propelled by a strategic shift toward science-backed, health-oriented formulations. A primary driver is the mainstreaming of metabolic beauty, where products focus on cellular longevity rather than superficial correction.
  • This is enabled by the industrialization of green biotechnology, which produces high-purity, lab-grown nature-identical actives. These biotech-derived ingredients offer superior performance, delivering a 20% higher concentration of active compounds compared to some traditional botanical extracts.
  • Furthermore, the push for sustainability has led to the widespread adoption of waterless formulations and circular packaging solutions.
  • These innovations not only appeal to eco-conscious consumers but also provide business efficiencies, with anhydrous products reducing logistics costs by over 25% due to lower shipping weights. This convergence of efficacy and environmental responsibility defines the modern, performance-oriented industry.

What are the market trends shaping the Natural Cosmetics Industry?

  • The market is increasingly shaped by the proliferation of circular beauty principles. This includes a significant focus on upcycled ingredient innovation to minimize environmental impact.

  • Key trends in the natural cosmetics market are reshaping product development and consumer expectations, with a strong emphasis on sustainability and performance. The proliferation of circular beauty is evident, as upcycled ingredients now constitute up to 15% of new formulations in leading clean beauty lines, reflecting a shift toward a zero-waste lifestyle and regenerative beauty.
  • This is complemented by the structural transition to waterless beauty, where anhydrous products eliminate up to 70% of the water typically used as a filler, resulting in more potent, preservative-free solutions. The expansion of climate-adaptive skincare addresses environmental resilience through formulations designed to protect against urban pollutants and extreme weather.
  • This trend toward a resource-efficient industry is driven by eco-conscious consumption and the skinimalism movement, fostering a preference for fewer, higher-quality products that deliver tangible results.

What challenges does the Natural Cosmetics Industry face during its growth?

  • Escalating regulatory rigor and the mandatory substantiation of safety data present a key challenge affecting industry growth.

  • The natural cosmetics market faces significant operational hurdles, primarily from escalating regulatory demands and supply chain vulnerabilities. The intensifying burden of compliance, such as new mandates for safety substantiation, can increase R&D expenditures by 30% for each new botanical extract introduced. This is compounded by the volatility of the global supply chain for high-purity, certified organic raw materials.
  • Climate-driven events and geopolitical instability cause price fluctuations of over 20% for premium ingredients like cold-pressed oils. Another critical challenge is the pervasive issue of greenwashing, which creates a crisis of consumer trust and complicates the differentiation of genuinely natural products.
  • This forces authentic brands to invest heavily in third-party audits and traceability technologies to defend their market position against competitors using nature-identical synthetics without the same sourcing integrity.

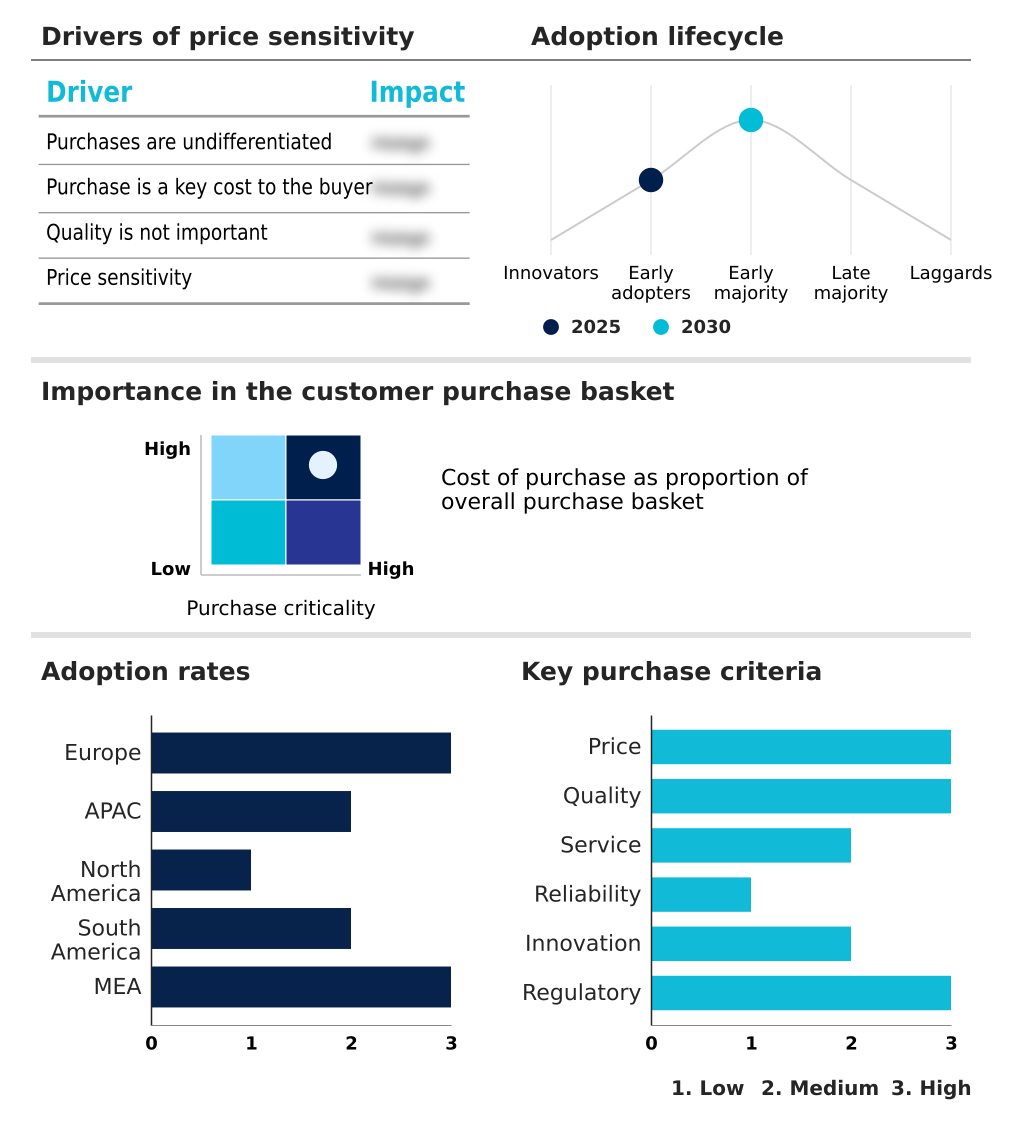
Exclusive Technavio Analysis on Customer Landscape

The natural cosmetics market forecasting report includes the adoption lifecycle of the market, covering from the innovator’s stage to the laggard’s stage. It focuses on adoption rates in different regions based on penetration. Furthermore, the natural cosmetics market report also includes key purchase criteria and drivers of price sensitivity to help companies evaluate and develop their market growth analysis strategies.

Customer Landscape of Natural Cosmetics Industry

Competitive Landscape

Companies are implementing various strategies, such as strategic alliances, natural cosmetics market forecast, partnerships, mergers and acquisitions, geographical expansion, and product/service launches, to enhance their presence in the industry.

Adel Natural Cosmetics - Analysis indicates a focus on handcrafted, toxin-free skincare and makeup, utilizing nutrient-rich, plant-based, and organic ingredients for ethically sourced, sensitive skin solutions.

The industry research and growth report includes detailed analyses of the competitive landscape of the market and information about key companies, including:

  • Adel Natural Cosmetics
  • Arbonne International LLC
  • Beiersdorf AG
  • Bloomtown Ltd.
  • Burts Bees
  • Honasa Consumer
  • Kenvue Brands LLC
  • Kjaer Weis
  • Korres
  • Loccitane International SA
  • Loreal SA
  • Natura International Inc.
  • Nuxe
  • RMS Beauty
  • Tata Natural Alchemy LLC
  • The Estee Lauder Co
  • The Honest Co. Inc.
  • Unilever PLC
  • Weleda

Qualitative and quantitative analysis of companies has been conducted to help clients understand the wider business environment as well as the strengths and weaknesses of key industry players. Data is qualitatively analyzed to categorize companies as pure play, category-focused, industry-focused, and diversified; it is quantitatively analyzed to categorize companies as dominant, leading, strong, tentative, and weak.

Recent Development and News in Natural cosmetics market

  • In January 2025, Burt's Bees introduced significant additions to its Rescue Lip Relief line, emphasizing the brand's commitment to sustainable and high-performance ingredients with new, naturally derived formulations.
  • In March 2025, Medicube launched its PDRN Pink Collagen Gel Mask, which leverages salmon DNA to deliver collagen-boosting and skin-repairing benefits through an innovative natural bio-active delivery system.
  • In June 2025, Unilever Plc. completed its acquisition of Dr. Squatch, a prominent personal care brand known for its natural extract-based soaps and body washes, to strengthen its portfolio in sustainable grooming.
  • In July 2025, L'Oréal Paris introduced the Colorsonic device in major US retail outlets, a significant technological advancement for applying hair colorants designed to cater to diverse hair types and textures.

Dive into Technavio’s robust research methodology, blending expert interviews, extensive data synthesis, and validated models for unparalleled Natural Cosmetics Market insights. See full methodology.

Market Scope
Page number 288
Base year 2025
Historic period 2020-2024
Forecast period 2026-2030
Growth momentum & CAGR Accelerate at a CAGR of 6.2%
Market growth 2026-2030 USD 9732.5 million
Market structure Fragmented
YoY growth 2025-2026(%) 5.9%
Key countries Germany, France, UK, Italy, Spain, The Netherlands, China, Japan, South Korea, India, Australia, Indonesia, US, Canada, Mexico, Brazil, Argentina, Chile, Saudi Arabia, UAE, South Africa, Egypt and Turkey
Competitive landscape Leading Companies, Market Positioning of Companies, Competitive Strategies, and Industry Risks

Request Free Sample

Research Analyst Overview

  • The natural cosmetics market is advancing through a sophisticated convergence of green chemistry and digital transparency, moving far beyond basic organic ingredients. This evolution is defined by the industrialization of green biotechnology, enabling the creation of lab-grown nature-identical actives like bio-collagen and pure squalane through precision fermentation and yeast engineering. Such innovations provide high-purity, sustainable alternatives to volatile, earth-harvested materials.
  • The focus is on performance, with plant-derived peptides and bio-identical proteins delivering clinical results. This shift supports the rise of metabolic beauty, which targets cellular longevity using adaptogens and nootropics that interact with the skin microbiome. Concurrently, sustainability is a core boardroom-level concern, driving the adoption of waterless formulations, circular packaging, and upcycled natural ingredients.
  • Leading brands demonstrate this commitment, with some achieving a nearly 80% reduction in virgin plastic use via refill programs. This reflects a market where ethical sourcing, eco-friendly packaging, and clean beauty standards are non-negotiable for maintaining a competitive edge.

What are the Key Data Covered in this Natural Cosmetics Market Research and Growth Report?

  • What is the expected growth of the Natural Cosmetics Market between 2026 and 2030?

    • USD 9.73 billion, at a CAGR of 6.2%

  • What segmentation does the market report cover?

    • The report is segmented by Distribution Channel (Offline, and Online), Type (Personal care, Skin care, and Others), Product Type (Herbal, Organic, and Others) and Geography (Europe, APAC, North America, South America, Middle East and Africa)

  • Which regions are analyzed in the report?

    • Europe, APAC, North America, South America and Middle East and Africa

  • What are the key growth drivers and market challenges?

    • Integration of metabolic beauty and cellular longevity initiatives, Escalating regulatory rigor and mandatory substantiation of safety data

  • Who are the major players in the Natural Cosmetics Market?

    • Adel Natural Cosmetics, Arbonne International LLC, Beiersdorf AG, Bloomtown Ltd., Burts Bees, Honasa Consumer, Kenvue Brands LLC, Kjaer Weis, Korres, Loccitane International SA, Loreal SA, Natura International Inc., Nuxe, RMS Beauty, Tata Natural Alchemy LLC, The Estee Lauder Co, The Honest Co. Inc., Unilever PLC and Weleda

Market Research Insights

  • The natural cosmetics market is shaped by a strategic pivot toward verifiable performance and sustainability, influencing consumer behavior and operational standards. The adoption of waterless formulations is a key dynamic, with such products reducing formulation water by up to 70% and enhancing active ingredient concentration. This aligns with the preferences of wellness-focused demographics and the sober-curious movement.
  • Concurrently, the rise of conscious science and a performance-oriented industry is evident, as biotech-derived ingredients demonstrate over 30% greater stability than certain plant-harvested alternatives.
  • The push for a resource-efficient industry is further supported by digital transparency; for instance, the female worker population ratio in India has grown to 40%, boosting spending on premium natural products, where digital platforms are key for verifying clean-label claims and engaging with the skinimalism movement and regenerative beauty principles.

We can help! Our analysts can customize this natural cosmetics market research report to meet your requirements.

Get in touch

1. Executive Summary

1.1 Market overview

Executive Summary - Chart on Market Overview
Executive Summary - Data Table on Market Overview
Executive Summary - Chart on Global Market Characteristics
Executive Summary - Chart on Market by Geography
Executive Summary - Chart on Market Segmentation by Distribution Channel
Executive Summary - Chart on Market Segmentation by Type
Executive Summary - Chart on Market Segmentation by Product Type
Executive Summary - Chart on Incremental Growth
Executive Summary - Data Table on Incremental Growth
Executive Summary - Chart on Company Market Positioning

2. Technavio Analysis

2.1 Analysis of price sensitivity, lifecycle, customer purchase basket, adoption rates, and purchase criteria

2.2 Criticality of inputs and Factors of differentiation

Chart on Overview on criticality of inputs and factors of differentiation

2.3 Factors of disruption

Chart on Overview on factors of disruption

2.4 Impact of drivers and challenges

Chart on Impact of drivers and challenges in 2025 and 2030

3. Market Landscape

3.1 Market ecosystem

Chart on Parent Market
Data Table on - Parent Market

3.2 Market characteristics

Chart on Market characteristics analysis

3.3 Value chain analysis

Chart on Value chain analysis

4. Market Sizing

4.1 Market definition

Data Table on Offerings of companies included in the market definition

4.2 Market segment analysis

Market segments

4.3 Market size 2025

4.4 Market outlook: Forecast for 2025-2030

Chart on Global - Market size and forecast 2025-2030 ($ million)
Data Table on Global - Market size and forecast 2025-2030 ($ million)
Chart on Global Market: Year-over-year growth 2025-2030 (%)
Data Table on Global Market: Year-over-year growth 2025-2030 (%)

5. Historic Market Size

5.1 Global Natural Cosmetics Market 2020 - 2024

Historic Market Size - Data Table on Global Natural Cosmetics Market 2020 - 2024 ($ million)

5.2 Distribution Channel segment analysis 2020 - 2024

Historic Market Size - Distribution Channel Segment 2020 - 2024 ($ million)

5.3 Type segment analysis 2020 - 2024

Historic Market Size - Type Segment 2020 - 2024 ($ million)

5.4 Product Type segment analysis 2020 - 2024

Historic Market Size - Product Type Segment 2020 - 2024 ($ million)

5.5 Geography segment analysis 2020 - 2024

Historic Market Size - Geography Segment 2020 - 2024 ($ million)

5.6 Country segment analysis 2020 - 2024

Historic Market Size - Country Segment 2020 - 2024 ($ million)

6. Qualitative Analysis

6.1 Impact of AI in global natural cosmetics market

7. Five Forces Analysis

7.1 Five forces summary

Five forces analysis - Comparison between 2025 and 2030

7.2 Bargaining power of buyers

Bargaining power of buyers - Impact of key factors 2025 and 2030

7.3 Bargaining power of suppliers

Bargaining power of suppliers - Impact of key factors in 2025 and 2030

7.4 Threat of new entrants

Threat of new entrants - Impact of key factors in 2025 and 2030

7.5 Threat of substitutes

Threat of substitutes - Impact of key factors in 2025 and 2030

7.6 Threat of rivalry

Threat of rivalry - Impact of key factors in 2025 and 2030

7.7 Market condition

Chart on Market condition - Five forces 2025 and 2030

8. Market Segmentation by Distribution Channel

8.1 Market segments

Chart on Distribution Channel - Market share 2025-2030 (%)
Data Table on Distribution Channel - Market share 2025-2030 (%)

8.2 Comparison by Distribution Channel

Chart on Comparison by Distribution Channel
Data Table on Comparison by Distribution Channel

8.3 Offline - Market size and forecast 2025-2030

Chart on Offline - Market size and forecast 2025-2030 ($ million)
Data Table on Offline - Market size and forecast 2025-2030 ($ million)
Chart on Offline - Year-over-year growth 2025-2030 (%)
Data Table on Offline - Year-over-year growth 2025-2030 (%)

8.4 Online - Market size and forecast 2025-2030

Chart on Online - Market size and forecast 2025-2030 ($ million)
Data Table on Online - Market size and forecast 2025-2030 ($ million)
Chart on Online - Year-over-year growth 2025-2030 (%)
Data Table on Online - Year-over-year growth 2025-2030 (%)

8.5 Market opportunity by Distribution Channel

Market opportunity by Distribution Channel ($ million)
Data Table on Market opportunity by Distribution Channel ($ million)

9. Market Segmentation by Type

9.1 Market segments

Chart on Type - Market share 2025-2030 (%)
Data Table on Type - Market share 2025-2030 (%)

9.2 Comparison by Type

Chart on Comparison by Type
Data Table on Comparison by Type

9.3 Personal care - Market size and forecast 2025-2030

Chart on Personal care - Market size and forecast 2025-2030 ($ million)
Data Table on Personal care - Market size and forecast 2025-2030 ($ million)
Chart on Personal care - Year-over-year growth 2025-2030 (%)
Data Table on Personal care - Year-over-year growth 2025-2030 (%)

9.4 Skin care - Market size and forecast 2025-2030

Chart on Skin care - Market size and forecast 2025-2030 ($ million)
Data Table on Skin care - Market size and forecast 2025-2030 ($ million)
Chart on Skin care - Year-over-year growth 2025-2030 (%)
Data Table on Skin care - Year-over-year growth 2025-2030 (%)

9.5 Others - Market size and forecast 2025-2030

Chart on Others - Market size and forecast 2025-2030 ($ million)
Data Table on Others - Market size and forecast 2025-2030 ($ million)
Chart on Others - Year-over-year growth 2025-2030 (%)
Data Table on Others - Year-over-year growth 2025-2030 (%)

9.6 Market opportunity by Type

Market opportunity by Type ($ million)
Data Table on Market opportunity by Type ($ million)

10. Market Segmentation by Product Type

10.1 Market segments

Chart on Product Type - Market share 2025-2030 (%)
Data Table on Product Type - Market share 2025-2030 (%)

10.2 Comparison by Product Type

Chart on Comparison by Product Type
Data Table on Comparison by Product Type

10.3 Herbal - Market size and forecast 2025-2030

Chart on Herbal - Market size and forecast 2025-2030 ($ million)
Data Table on Herbal - Market size and forecast 2025-2030 ($ million)
Chart on Herbal - Year-over-year growth 2025-2030 (%)
Data Table on Herbal - Year-over-year growth 2025-2030 (%)

10.4 Organic - Market size and forecast 2025-2030

Chart on Organic - Market size and forecast 2025-2030 ($ million)
Data Table on Organic - Market size and forecast 2025-2030 ($ million)
Chart on Organic - Year-over-year growth 2025-2030 (%)
Data Table on Organic - Year-over-year growth 2025-2030 (%)

10.5 Others - Market size and forecast 2025-2030

Chart on Others - Market size and forecast 2025-2030 ($ million)
Data Table on Others - Market size and forecast 2025-2030 ($ million)
Chart on Others - Year-over-year growth 2025-2030 (%)
Data Table on Others - Year-over-year growth 2025-2030 (%)

10.6 Market opportunity by Product Type

Market opportunity by Product Type ($ million)
Data Table on Market opportunity by Product Type ($ million)

11. Customer Landscape

11.1 Customer landscape overview

Analysis of price sensitivity, lifecycle, customer purchase basket, adoption rates, and purchase criteria

12. Geographic Landscape

12.1 Geographic segmentation

Chart on Market share by geography 2025-2030 (%)
Data Table on Market share by geography 2025-2030 (%)

12.2 Geographic comparison

Chart on Geographic comparison
Data Table on Geographic comparison

12.3 Europe - Market size and forecast 2025-2030

Chart on Europe - Market size and forecast 2025-2030 ($ million)
Data Table on Europe - Market size and forecast 2025-2030 ($ million)
Chart on Europe - Year-over-year growth 2025-2030 (%)
Data Table on Europe - Year-over-year growth 2025-2030 (%)
Chart on Regional Comparison - Europe
Data Table on Regional Comparison - Europe

12.3.1 Germany - Market size and forecast 2025-2030

Chart on Germany - Market size and forecast 2025-2030 ($ million)
Data Table on Germany - Market size and forecast 2025-2030 ($ million)
Chart on Germany - Year-over-year growth 2025-2030 (%)
Data Table on Germany - Year-over-year growth 2025-2030 (%)

12.3.2 France - Market size and forecast 2025-2030

Chart on France - Market size and forecast 2025-2030 ($ million)
Data Table on France - Market size and forecast 2025-2030 ($ million)
Chart on France - Year-over-year growth 2025-2030 (%)
Data Table on France - Year-over-year growth 2025-2030 (%)

12.3.3 UK - Market size and forecast 2025-2030

Chart on UK - Market size and forecast 2025-2030 ($ million)
Data Table on UK - Market size and forecast 2025-2030 ($ million)
Chart on UK - Year-over-year growth 2025-2030 (%)
Data Table on UK - Year-over-year growth 2025-2030 (%)

12.3.4 Italy - Market size and forecast 2025-2030

Chart on Italy - Market size and forecast 2025-2030 ($ million)
Data Table on Italy - Market size and forecast 2025-2030 ($ million)
Chart on Italy - Year-over-year growth 2025-2030 (%)
Data Table on Italy - Year-over-year growth 2025-2030 (%)

12.3.5 Spain - Market size and forecast 2025-2030

Chart on Spain - Market size and forecast 2025-2030 ($ million)
Data Table on Spain - Market size and forecast 2025-2030 ($ million)
Chart on Spain - Year-over-year growth 2025-2030 (%)
Data Table on Spain - Year-over-year growth 2025-2030 (%)

12.3.6 The Netherlands - Market size and forecast 2025-2030

Chart on The Netherlands - Market size and forecast 2025-2030 ($ million)
Data Table on The Netherlands - Market size and forecast 2025-2030 ($ million)
Chart on The Netherlands - Year-over-year growth 2025-2030 (%)
Data Table on The Netherlands - Year-over-year growth 2025-2030 (%)

12.4 APAC - Market size and forecast 2025-2030

Chart on APAC - Market size and forecast 2025-2030 ($ million)
Data Table on APAC - Market size and forecast 2025-2030 ($ million)
Chart on APAC - Year-over-year growth 2025-2030 (%)
Data Table on APAC - Year-over-year growth 2025-2030 (%)
Chart on Regional Comparison - APAC
Data Table on Regional Comparison - APAC

12.4.1 China - Market size and forecast 2025-2030

Chart on China - Market size and forecast 2025-2030 ($ million)
Data Table on China - Market size and forecast 2025-2030 ($ million)
Chart on China - Year-over-year growth 2025-2030 (%)
Data Table on China - Year-over-year growth 2025-2030 (%)

12.4.2 Japan - Market size and forecast 2025-2030

Chart on Japan - Market size and forecast 2025-2030 ($ million)
Data Table on Japan - Market size and forecast 2025-2030 ($ million)
Chart on Japan - Year-over-year growth 2025-2030 (%)
Data Table on Japan - Year-over-year growth 2025-2030 (%)

12.4.3 South Korea - Market size and forecast 2025-2030

Chart on South Korea - Market size and forecast 2025-2030 ($ million)
Data Table on South Korea - Market size and forecast 2025-2030 ($ million)
Chart on South Korea - Year-over-year growth 2025-2030 (%)
Data Table on South Korea - Year-over-year growth 2025-2030 (%)

12.4.4 India - Market size and forecast 2025-2030

Chart on India - Market size and forecast 2025-2030 ($ million)
Data Table on India - Market size and forecast 2025-2030 ($ million)
Chart on India - Year-over-year growth 2025-2030 (%)
Data Table on India - Year-over-year growth 2025-2030 (%)

12.4.5 Australia - Market size and forecast 2025-2030

Chart on Australia - Market size and forecast 2025-2030 ($ million)
Data Table on Australia - Market size and forecast 2025-2030 ($ million)
Chart on Australia - Year-over-year growth 2025-2030 (%)
Data Table on Australia - Year-over-year growth 2025-2030 (%)

12.4.6 Indonesia - Market size and forecast 2025-2030

Chart on Indonesia - Market size and forecast 2025-2030 ($ million)
Data Table on Indonesia - Market size and forecast 2025-2030 ($ million)
Chart on Indonesia - Year-over-year growth 2025-2030 (%)
Data Table on Indonesia - Year-over-year growth 2025-2030 (%)

12.5 North America - Market size and forecast 2025-2030

Chart on North America - Market size and forecast 2025-2030 ($ million)
Data Table on North America - Market size and forecast 2025-2030 ($ million)
Chart on North America - Year-over-year growth 2025-2030 (%)
Data Table on North America - Year-over-year growth 2025-2030 (%)
Chart on Regional Comparison - North America
Data Table on Regional Comparison - North America

12.5.1 US - Market size and forecast 2025-2030

Chart on US - Market size and forecast 2025-2030 ($ million)
Data Table on US - Market size and forecast 2025-2030 ($ million)
Chart on US - Year-over-year growth 2025-2030 (%)
Data Table on US - Year-over-year growth 2025-2030 (%)

12.5.2 Canada - Market size and forecast 2025-2030

Chart on Canada - Market size and forecast 2025-2030 ($ million)
Data Table on Canada - Market size and forecast 2025-2030 ($ million)
Chart on Canada - Year-over-year growth 2025-2030 (%)
Data Table on Canada - Year-over-year growth 2025-2030 (%)

12.5.3 Mexico - Market size and forecast 2025-2030

Chart on Mexico - Market size and forecast 2025-2030 ($ million)
Data Table on Mexico - Market size and forecast 2025-2030 ($ million)
Chart on Mexico - Year-over-year growth 2025-2030 (%)
Data Table on Mexico - Year-over-year growth 2025-2030 (%)

12.6 South America - Market size and forecast 2025-2030

Chart on South America - Market size and forecast 2025-2030 ($ million)
Data Table on South America - Market size and forecast 2025-2030 ($ million)
Chart on South America - Year-over-year growth 2025-2030 (%)
Data Table on South America - Year-over-year growth 2025-2030 (%)
Chart on Regional Comparison - South America
Data Table on Regional Comparison - South America

12.6.1 Brazil - Market size and forecast 2025-2030

Chart on Brazil - Market size and forecast 2025-2030 ($ million)
Data Table on Brazil - Market size and forecast 2025-2030 ($ million)
Chart on Brazil - Year-over-year growth 2025-2030 (%)
Data Table on Brazil - Year-over-year growth 2025-2030 (%)

12.6.2 Argentina - Market size and forecast 2025-2030

Chart on Argentina - Market size and forecast 2025-2030 ($ million)
Data Table on Argentina - Market size and forecast 2025-2030 ($ million)
Chart on Argentina - Year-over-year growth 2025-2030 (%)
Data Table on Argentina - Year-over-year growth 2025-2030 (%)

12.6.3 Chile - Market size and forecast 2025-2030

Chart on Chile - Market size and forecast 2025-2030 ($ million)
Data Table on Chile - Market size and forecast 2025-2030 ($ million)
Chart on Chile - Year-over-year growth 2025-2030 (%)
Data Table on Chile - Year-over-year growth 2025-2030 (%)

12.7 Middle East and Africa - Market size and forecast 2025-2030

Chart on Middle East and Africa - Market size and forecast 2025-2030 ($ million)
Data Table on Middle East and Africa - Market size and forecast 2025-2030 ($ million)
Chart on Middle East and Africa - Year-over-year growth 2025-2030 (%)
Data Table on Middle East and Africa - Year-over-year growth 2025-2030 (%)
Chart on Regional Comparison - Middle East and Africa
Data Table on Regional Comparison - Middle East and Africa

12.7.1 Saudi Arabia - Market size and forecast 2025-2030

Chart on Saudi Arabia - Market size and forecast 2025-2030 ($ million)
Data Table on Saudi Arabia - Market size and forecast 2025-2030 ($ million)
Chart on Saudi Arabia - Year-over-year growth 2025-2030 (%)
Data Table on Saudi Arabia - Year-over-year growth 2025-2030 (%)

12.7.2 UAE - Market size and forecast 2025-2030

Chart on UAE - Market size and forecast 2025-2030 ($ million)
Data Table on UAE - Market size and forecast 2025-2030 ($ million)
Chart on UAE - Year-over-year growth 2025-2030 (%)
Data Table on UAE - Year-over-year growth 2025-2030 (%)

12.7.3 South Africa - Market size and forecast 2025-2030

Chart on South Africa - Market size and forecast 2025-2030 ($ million)
Data Table on South Africa - Market size and forecast 2025-2030 ($ million)
Chart on South Africa - Year-over-year growth 2025-2030 (%)
Data Table on South Africa - Year-over-year growth 2025-2030 (%)

12.7.4 Egypt - Market size and forecast 2025-2030

Chart on Egypt - Market size and forecast 2025-2030 ($ million)
Data Table on Egypt - Market size and forecast 2025-2030 ($ million)
Chart on Egypt - Year-over-year growth 2025-2030 (%)
Data Table on Egypt - Year-over-year growth 2025-2030 (%)

12.7.5 Turkey - Market size and forecast 2025-2030

Chart on Turkey - Market size and forecast 2025-2030 ($ million)
Data Table on Turkey - Market size and forecast 2025-2030 ($ million)
Chart on Turkey - Year-over-year growth 2025-2030 (%)
Data Table on Turkey - Year-over-year growth 2025-2030 (%)

12.8 Market opportunity by geography

Market opportunity by geography ($ million)
Data Tables on Market opportunity by geography ($ million)

13. Drivers, Challenges, and Opportunity

13.1 Market drivers

Integration of metabolic beauty and cellular longevity initiatives
Mainstream proliferation of waterless formulations and circular packaging solutions
Industrialization of green biotechnology and lab-grown nature-identical actives

13.2 Market challenges

Escalating regulatory rigor and mandatory substantiation of safety data
Supply chain fragility and volatility of high-purity botanical feedstock
Proliferation of greenwashing and crisis of consumer verification

13.3 Impact of drivers and challenges

Impact of drivers and challenges in 2025 and 2030

13.4 Market opportunities

Proliferation of circular beauty and upcycled ingredient innovation
Expansion of climate-adaptive skin care and environmental resilience
Structural transition toward waterless beauty and anhydrous concentration

14. Competitive Landscape

14.1 Overview

14.2

Overview on criticality of inputs and factors of differentiation

14.3 Landscape disruption

Overview on factors of disruption

14.4 Industry risks

Impact of key risks on business

15. Competitive Analysis

15.1 Companies profiled

Companies covered

15.2 Company ranking index

15.3 Market positioning of companies

Matrix on companies position and classification

15.4 Adel Natural Cosmetics

Adel Natural Cosmetics - Overview
Adel Natural Cosmetics - Product / Service
Adel Natural Cosmetics - Key offerings
SWOT

15.5 Arbonne International LLC

Arbonne International LLC - Overview
Arbonne International LLC - Product / Service
Arbonne International LLC - Key offerings
SWOT

15.6 Beiersdorf AG

Beiersdorf AG - Overview
Beiersdorf AG - Business segments
Beiersdorf AG - Key news
Beiersdorf AG - Key offerings
Beiersdorf AG - Segment focus
SWOT

15.7 Bloomtown Ltd.

Bloomtown Ltd. - Overview
Bloomtown Ltd. - Product / Service
Bloomtown Ltd. - Key offerings
SWOT

15.8 Honasa Consumer

Honasa Consumer - Overview
Honasa Consumer - Product / Service
Honasa Consumer - Key offerings
SWOT

15.9 Kenvue Brands LLC

Kenvue Brands LLC - Overview
Kenvue Brands LLC - Product / Service
Kenvue Brands LLC - Key offerings
SWOT

15.10 Kjaer Weis

Kjaer Weis - Overview
Kjaer Weis - Product / Service
Kjaer Weis - Key offerings
SWOT

15.11 Korres

Korres - Overview
Korres - Product / Service
Korres - Key offerings
SWOT

15.12 Loccitane International SA

Loccitane International SA - Overview
Loccitane International SA - Product / Service
Loccitane International SA - Key offerings
SWOT

15.13 Loreal SA

Loreal SA - Overview
Loreal SA - Business segments
Loreal SA - Key news
Loreal SA - Key offerings
Loreal SA - Segment focus
SWOT

15.14 RMS Beauty

RMS Beauty - Overview
RMS Beauty - Product / Service
RMS Beauty - Key offerings
SWOT

15.15 Tata Natural Alchemy LLC

Tata Natural Alchemy LLC - Overview
Tata Natural Alchemy LLC - Product / Service
Tata Natural Alchemy LLC - Key offerings
SWOT

15.16 The Estee Lauder Co

The Estee Lauder Co - Overview
The Estee Lauder Co - Product / Service
The Estee Lauder Co - Key offerings
SWOT

15.17 The Honest Co. Inc.

The Honest Co. Inc. - Overview
The Honest Co. Inc. - Product / Service
The Honest Co. Inc. - Key offerings
SWOT

15.18 Unilever PLC

Unilever PLC - Overview
Unilever PLC - Business segments
Unilever PLC - Key offerings
Unilever PLC - Segment focus
SWOT

16. Appendix

16.1 Scope of the report

Market definition
Objectives
Notes and caveats

16.2 Inclusions and exclusions checklist

Inclusions checklist
Exclusions checklist

16.3 Currency conversion rates for US$

16.4 Research methodology

16.5 Data procurement

Information sources

16.6 Data validation

16.7 Validation techniques employed for market sizing

16.8 Data synthesis

16.9 360 degree market analysis

16.10 List of abbreviations

Research Methodology

Technavio presents a detailed picture of the market by way of study, synthesis, and summation of data from multiple sources. The analysts have presented the various facets of the market with a particular focus on identifying the key industry influencers. The data thus presented is comprehensive, reliable, and the result of extensive research, both primary and secondary.

INFORMATION SOURCES

Primary sources

  • Manufacturers and suppliers
  • Channel partners
  • Industry experts
  • Strategic decision makers

Secondary sources

  • Industry journals and periodicals
  • Government data
  • Financial reports of key industry players
  • Historical data
  • Press releases

DATA ANALYSIS

Data Synthesis

  • Collation of data
  • Estimation of key figures
  • Analysis of derived insights

Data Validation

  • Triangulation with data models
  • Reference against proprietary databases
  • Corroboration with industry experts

REPORT WRITING

Qualitative

  • Market drivers
  • Market challenges
  • Market trends
  • Five forces analysis

Quantitative

  • Market size and forecast
  • Market segmentation
  • Geographical insights
  • Competitive landscape

Interested in this report?

Get your sample now to see our research methodology and insights!

Download Now

Frequently Asked Questions

Natural Cosmetics market growth will increase by USD 9732.5 million during 2026-2030.

The Natural Cosmetics market is expected to grow at a CAGR of 6.2% during 2026-2030.

Natural Cosmetics market is segmented by Distribution channel (Offline, Online) Type (Personal care, Skin care, Others) Product type (Herbal, Organic, Others)

Adel Natural Cosmetics, Arbonne International LLC, Beiersdorf AG, Bloomtown Ltd., Burts Bees, Honasa Consumer, Kenvue Brands LLC, Kjaer Weis, Korres, Loccitane International SA, Loreal SA, Natura International Inc., Nuxe, RMS Beauty, Tata Natural Alchemy LLC, The Estee Lauder Co, The Honest Co. Inc., Unilever PLC, Weleda are a few of the key vendors in the Natural Cosmetics market.

Europe will register the highest growth rate of 38.2% among the other regions. Therefore, the Natural Cosmetics market in Europe is expected to garner significant business opportunities for the vendors during the forecast period.

Germany, France, UK, Italy, Spain, The Netherlands, China, Japan, South Korea, India, Australia, Indonesia, US, Canada, Mexico, Brazil, Argentina, Chile, Saudi Arabia, UAE, South Africa, Egypt, Turkey

  • Integration of metabolic beauty and cellular longevity initiatives is the driving factor this market.

The Natural Cosmetics market vendors should focus on grabbing business opportunities from the Distribution channel segment as it accounted for the largest market share in the base year.
RIA - Research AI Assistant
Ask RIA