
Noodles Market Size 2024-2028
The noodles market size is forecast to increase by USD 9.67 billion, at a CAGR of 3.2% between 2023 and 2028.
- The market is characterized by the surging demand for diverse regional and ethnic flavors, presenting a significant growth opportunity for market participants. Consumers' increasing preference for natural additives in their food, driven by health consciousness, further fuels market expansion. However, the market faces challenges with the volatility of raw material prices, which can impact profitability and operational planning for manufacturers. Navigating these dynamics requires strategic sourcing and pricing strategies to mitigate risks and capitalize on consumer trends. Companies that successfully cater to evolving consumer preferences and effectively manage raw material costs are well-positioned to thrive in this dynamic market.
What will be the Size of the Noodles Market during the forecast period?

Explore in-depth regional segment analysis with market size data - historical 2018-2022 and forecasts 2024-2028 - in the full report.
Request Free Sample
The noodle market continues to evolve, driven by consumer preferences and industry innovations. Udon and soba noodles, made from wheat flour, remain popular choices, while eggplant noodles and vegetable alternatives gain traction. Flour milling plays a crucial role in ensuring fiber content and quality control. Import markets influence pricing strategies, with fiber content and food safety regulations being key considerations. Ramen noodles, a staple in many cuisines, are produced using various methods, including fresh and instant varieties. Pasta makers employ advanced technology in noodle cutting machines to cater to diverse culinary applications. Food safety regulations and calorie counts are increasingly important factors in consumer decision-making.
New product development, such as gluten-free and whole wheat noodles, cater to dietary restrictions. Noodle dishes, including noodle soup, stir-fried noodles, and noodle salad, offer various carbohydrate content and protein profiles. Packaging materials and marketing campaigns further influence consumer choices. The food service industry and retail channels continue to shape the noodle market, with sodium content and food allergies being critical concerns. The ongoing unfolding of market activities reveals a dynamic industry, where fiber content, pricing strategies, and consumer preferences intertwine, shaping the future of noodle production and consumption.
How is this Noodles Industry segmented?
The noodles industry research report provides comprehensive data (region-wise segment analysis), with forecasts and estimates in "USD billion" for the period 2024-2028, as well as historical data from 2018-2022 for the following segments.
- Product
- Instant noodles
- Dried and others
- Distribution Channel
- Offline
- Online
- Supermarkets and Hypermarkets
- Convenience Stores
- Foodservice
- Type
- Wheat-Based
- Rice-Based
- Soba
- Udon
- Ramen
- Consumer Segment
- Household
- Commercial (Restaurants, Food Stalls)
- Institutional
- Geography
- North America
- US
- Canada
- Mexico
- Europe
- France
- Germany
- UK
- Middle East and Africa
- UAE
- APAC
- Indonesia
- Malaysia
- South Korea
- Thailand
- South America
- Brazil
- Rest of World (ROW)
- North America
By Product Insights
The instant noodles segment is estimated to witness significant growth during the forecast period.
The market encompasses a diverse range of products, including wheat flour-based noodles derived from wheat harvesting, as well as rice and other plant-based alternatives. Ingredient sourcing plays a crucial role in maintaining the desired fiber content and quality control. The shelf life of various noodle types, achieved through drying processes, varies significantly. Shell pasta, such as elbow macaroni, and Asian noodles, like udon and soba, cater to distinct consumer preferences. Egg noodles and vegetable noodles, including shirataki, are popular choices for those with dietary restrictions. Recipe development continues to evolve, with new product offerings in noodle salads and stir-fried dishes.
Pricing strategies and marketing campaigns influence consumer behavior, with instant noodles gaining traction due to their affordability and convenience. Food safety regulations and packaging materials are essential considerations for manufacturers. In the food service industry, noodles are a staple ingredient for various dishes, from ramen and noodle soup to fresh pasta and Asian-inspired creations. Retail channels offer a wide array of dried noodles, fresh pasta, and instant noodles, catering to diverse culinary applications and consumer preferences. The protein content and calorie count of noodles are essential factors for health-conscious consumers. Product innovation, such as gluten-free and whole wheat noodles, and the introduction of new flavors cater to evolving consumer demands.
The market, with companies expanding their reach to cater to international consumers. The sodium content and food allergies are critical concerns for manufacturers and consumers alike. In conclusion, The market is a dynamic and diverse industry, driven by consumer preferences, ingredient sourcing, and food technological advancements. The market is expected to witness continued growth, with companies focusing on product innovation, marketing strategies, and catering to various dietary restrictions.
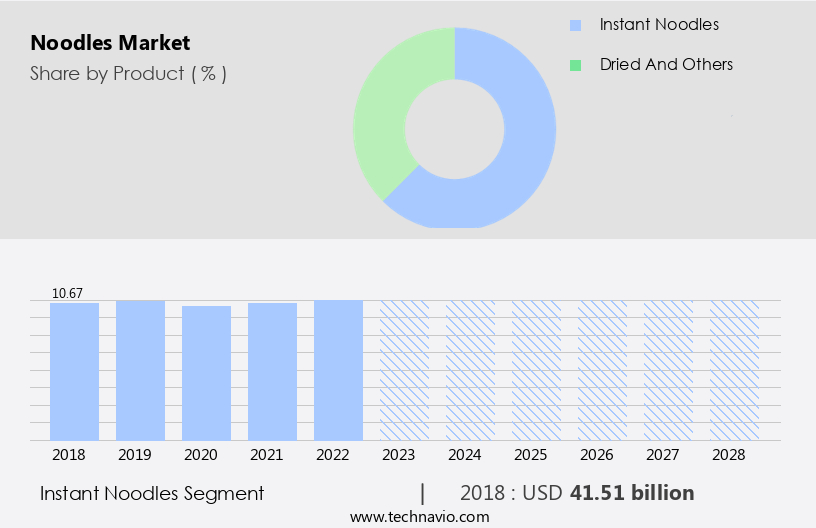
The Instant noodles segment was valued at USD 41.51 billion in 2018 and showed a gradual increase during the forecast period.
Regional Analysis
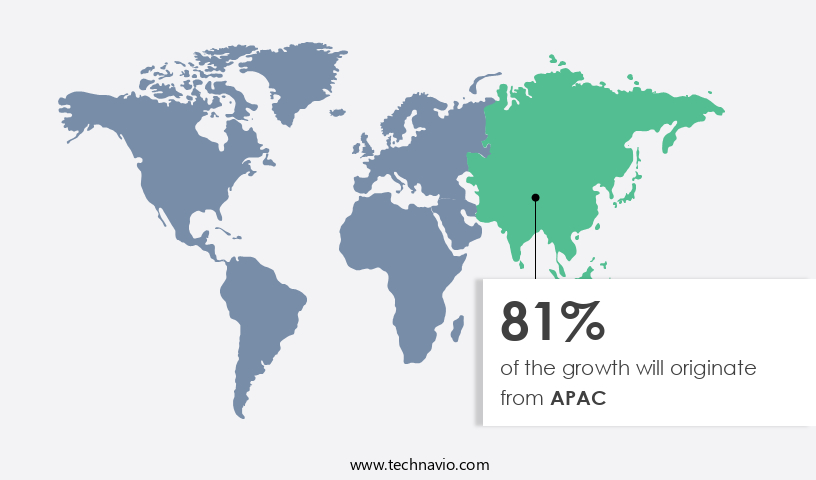
APAC is estimated to contribute 81% to the growth of the global market during the forecast period.Technavio's analysts have elaborately explained the regional trends and drivers that shape the market during the forecast period.
The market in Asia Pacific (APAC) experiences moderate growth, fueled by rising per capita income and population expansion. Urbanization and increasing disposable income contribute significantly to market expansion. However, recent product recalls, particularly in India and Vietnam, have affected growth. Consumer preferences for locally tailored products stimulate new product launches, driving market growth. Ingredient sourcing, including wheat harvesting and flour milling, plays a crucial role in noodle production. Shelf life and drying processes are essential considerations for manufacturers. Various noodle types, such as egg noodles, udon noodles, soba noodles, eggplant noodles, shirataki noodles, fresh noodles, and rice noodles, cater to diverse culinary applications and dietary restrictions.
Pricing strategies, food safety regulations, and quality control are essential factors shaping market dynamics. Instant noodles, noodle soup, and noodle dishes remain popular choices in the food service industry and retail channels. Noodle production techniques, including pasta makers and noodle cutting machines, influence product innovation and calorie count. Export markets and packaging materials are also crucial elements in the evolving the market landscape. Protein content, sodium content, and food allergies are significant concerns for manufacturers and consumers alike. Brands strive to build loyalty through marketing campaigns and new product development, while adhering to food safety regulations.
Market Dynamics
Our researchers analyzed the data with 2023 as the base year, along with the key drivers, trends, and challenges. A holistic analysis of drivers will help companies refine their marketing strategies to gain a competitive advantage.
B2B noodle supply solutions leverage advanced noodle processing technologies for quality. Noodles market growth opportunities 2025 include gluten-free noodle products and instant noodles for retail, meeting demand. Noodle supply chain software optimizes operations, while noodles market competitive analysis highlights players like Nissin Foods. Sustainable instant noodle production aligns with eco-friendly food trends. Noodles regulations 2024-2028 shape noodle demand in Asia-Pacific 2025. Premium noodle solutions and noodles market insights boost adoption. Noodles for foodservice and customized noodle formulations target niches. Noodles market challenges and solutions address health concerns, with direct procurement strategies for noodles and noodle pricing optimization enhancing profitability. Data-driven noodle market analytics and ethnic cuisine trends drive innovation.
What are the key market drivers leading to the rise in the adoption of Noodles Industry?
- The surge in consumer preference for regional and ethnic flavors serves as the primary catalyst for market growth.
- The global noodle market is experiencing growth due to the increasing popularity of Asian cuisine and the expanding multicultural population. In the food service industry, the rising number of noodle shops and restaurants is driving demand for a diverse range of noodles, making them easily accessible to consumers. This trend is particularly noticeable in countries with significant expatriate populations, such as the US, where the Italian and Asian communities account for approximately 6% of the population each. Consequently, there is a growing demand for noodles with Italian and Asian flavors, including wheat flour-based pasta like shell pasta and egg noodles, as well as vegetable noodles, noodle salads, and alternative options like shirataki noodles.
- The drying process and ingredient sourcing are crucial factors in maintaining the shelf life and quality of these noodles. Recipe development and innovation are also essential to cater to evolving consumer preferences and dietary requirements.
What are the market trends shaping the Noodles Industry?
- The use of natural additives is gaining popularity in the market, making it a significant trend in the industry. As a professional and knowledgeable assistant, I can help you navigate this trend and provide you with up-to-date information on natural additives and their applications.
- Noodle markets have seen a focus on natural additives in the production of udon, soba, and eggplant noodles, among others. The protein content in wheat flour plays a significant role in the cooking quality of these noodles and noodle products. Adding natural proteins to the dough not only enhances nutritional value but also strengthens the dough structure. Exogenous proteins can interact with gluten proteins in the dough, improving the noodle's chewiness and texture. Major industry players are committed to using only natural additives in their noodle and noodle product lines, which is expected to fuel market growth.
- Pricing strategies for these products depend on factors such as raw material costs, production methods, and market demand. Traditional noodle-making techniques, such as flour milling and hand-kneading, are being replaced with modern methods like pasta makers and noodle cutting machines to increase efficiency and maintain food safety regulations. The use of advanced technology in noodle production ensures consistent fiber content and quality control, contributing to the growing popularity of noodle soups and noodle dishes.
What challenges does the Noodles Industry face during its growth?
- The volatility of raw material prices poses a significant challenge to the industry's growth trajectory.
- The market faces challenges due to volatile raw material prices and the increasing gap between supply and demand. Raw materials, such as wheat and packaging materials like aluminum, paper, and plastics, significantly impact the market. Fluctuations in their availability and prices increase manufacturing costs, resulting in lower profit margins for companies. To stay competitive, some manufacturers explore low-cost substitutes, potentially affecting product quality. Additionally, suppliers can increase prices based on demand, further increasing costs. These factors hinder market growth and necessitate careful consideration in noodle production. Instant noodles, including flavor profiles with elbow macaroni, rice noodles, and dried noodles, cater to various dietary restrictions, such as gluten-free and whole wheat.
- New product development continues, focusing on culinary applications and managing carbohydrate content to meet evolving consumer preferences. Despite these challenges, the market remains dynamic and innovative, with ongoing efforts to address raw material costs and maintain product quality.
Exclusive Customer Landscape
The noodles market forecasting report includes the adoption lifecycle of the market, covering from the innovator's stage to the laggard's stage. It focuses on adoption rates in different regions based on penetration. Furthermore, the noodles market report also includes key purchase criteria and drivers of price sensitivity to help companies evaluate and develop their market growth analysis strategies.

Customer Landscape
Key Companies & Market Insights
Companies are implementing various strategies, such as strategic alliances, noodles market forecast, partnerships, mergers and acquisitions, geographical expansion, and product/service launches, to enhance their presence in the industry.
Acecook Vietnam Joint Stock Co. - This company specializes in the design and manufacturing of high-performance sports equipment, leveraging innovative materials and cutting-edge technology to enhance athlete experience and optimize performance. Their product offerings cater to various sports, ensuring versatility and adaptability for athletes at all levels.
The industry research and growth report includes detailed analyses of the competitive landscape of the market and information about key companies, including:
- Acecook Vietnam Joint Stock Co.
- Ajinomoto Co. Inc.
- Beltek (Huizhou) Foods Co. Ltd.
- Capital Foods Pvt. Ltd.
- CJ CheilJedang Corp.
- Conagra Brands Inc.
- House Foods Group Inc.
- ITC Ltd.
- Mandarin Noodle
- Nestle SA
- Nissin Foods Holdings Co. Ltd.
- NONGSHIM AMERICA INC.
- Ottogi Co. Ltd.
- PT INDOFOOD SUKSES MAKMUR Tbk
- QQ Famous Noodles
- S.K Food Foods Pvt. Ltd.
- Sanyo Foods Corp. of America
- Thai President Foods Public Co. Ltd.
- Uni President Enterprises Corp.
- Unilever PLC
Qualitative and quantitative analysis of companies has been conducted to help clients understand the wider business environment as well as the strengths and weaknesses of key industry players. Data is qualitatively analyzed to categorize companies as pure play, category-focused, industry-focused, and diversified; it is quantitatively analyzed to categorize companies as dominant, leading, strong, tentative, and weak.
Recent Development and News in Noodles Market
- In January 2024, Noodles & Company, a leading American restaurant chain specializing in quick-service noodle dishes, announced the launch of its new "Noodles at Home" meal kit service (NoodlesandCompany.Com). This offering allows customers to prepare restaurant-quality noodle dishes at home, expanding the company's reach beyond its brick-and-mortar locations.
- In March 2024, PepsiCo's Quaker Foods North America division, a significant player in the market, entered into a strategic partnership with Beyond Meat, Inc. To develop plant-based protein noodles for Quaker's instant noodle brands (BeyondMeat.Com). This collaboration aimed to cater to the growing demand for plant-based food options in the market.
- In May 2024, Maruchan, a leading instant noodle manufacturer, secured a USD100 million investment from private equity firm KKR & Co. (KKR.Com). This funding will support Maruchan's continued growth and expansion, as well as potential acquisitions in the market.
- In April 2025, the European Union (EU) approved the use of genetically modified (GM) soybean varieties in the production of noodles and other food products (EU Parliament). This regulatory approval is expected to boost the production capacity and efficiency of noodle manufacturers in the EU, potentially reducing costs and increasing market competitiveness.
Research Analyst Overview
- The market, a significant segment of the food industry, reflects cultural significance as a staple in various cuisines worldwide. Consumer behavior towards convenience foods, such as meal kits and ready-to-eat meals, has led to an increase in demand for noodles. Fusion cuisine trends have influenced the market, with consumers seeking new and exciting flavor combinations. Health consciousness is driving the demand for noodles with ethical sourcing, organic, vegetarian, and vegan options. Culinary trends indicate a focus on regional variations, with demand forecasting essential for supply chain management. Food delivery services and e-commerce sales have transformed the market, necessitating careful storage conditions and waste management.
- Noodle additives, such as flavor enhancers and texture modifiers, continue to influence consumer preferences. Restaurant menus offer a diverse range of traditional recipes and innovative fusion dishes, while the use of online retail platforms expands market reach. The market is dynamic, with ongoing trends shaping consumer behavior and industry practices.
Dive into Technavio's robust research methodology, blending expert interviews, extensive data synthesis, and validated models for unparalleled Noodles Market insights. See full methodology.
|
Market Scope |
|
|
Report Coverage |
Details |
|
Page number |
165 |
|
Base year |
2023 |
|
Historic period |
2018-2022 |
|
Forecast period |
2024-2028 |
|
Growth momentum & CAGR |
Accelerate at a CAGR of 3.2% |
|
Market growth 2024-2028 |
USD 9.67 billion |
|
Market structure |
Fragmented |
|
YoY growth 2023-2024(%) |
3.06 |
|
Key countries |
US, Malaysia, Indonesia, Germany, UK, South Korea, France, Canada, Brazil, Thailand, UAE, and Mexico |
|
Competitive landscape |
Leading Companies, Market Positioning of Companies, Competitive Strategies, and Industry Risks |
What are the Key Data Covered in this Noodles Market Research and Growth Report?
- CAGR of the Noodles industry during the forecast period
- Detailed information on factors that will drive the growth and forecasting between 2024 and 2028
- Precise estimation of the size of the market and its contribution of the industry in focus to the parent market
- Accurate predictions about upcoming growth and trends and changes in consumer behaviour
- Growth of the market across APAC, North America, Europe, Middle East and Africa, and South America
- Thorough analysis of the market's competitive landscape and detailed information about companies
- Comprehensive analysis of factors that will challenge the noodles market growth of industry companies
We can help! Our analysts can customize this noodles market research report to meet your requirements.
 RIA -
RIA - 
