North America Drywall Repair Services Market Size 2025-2029
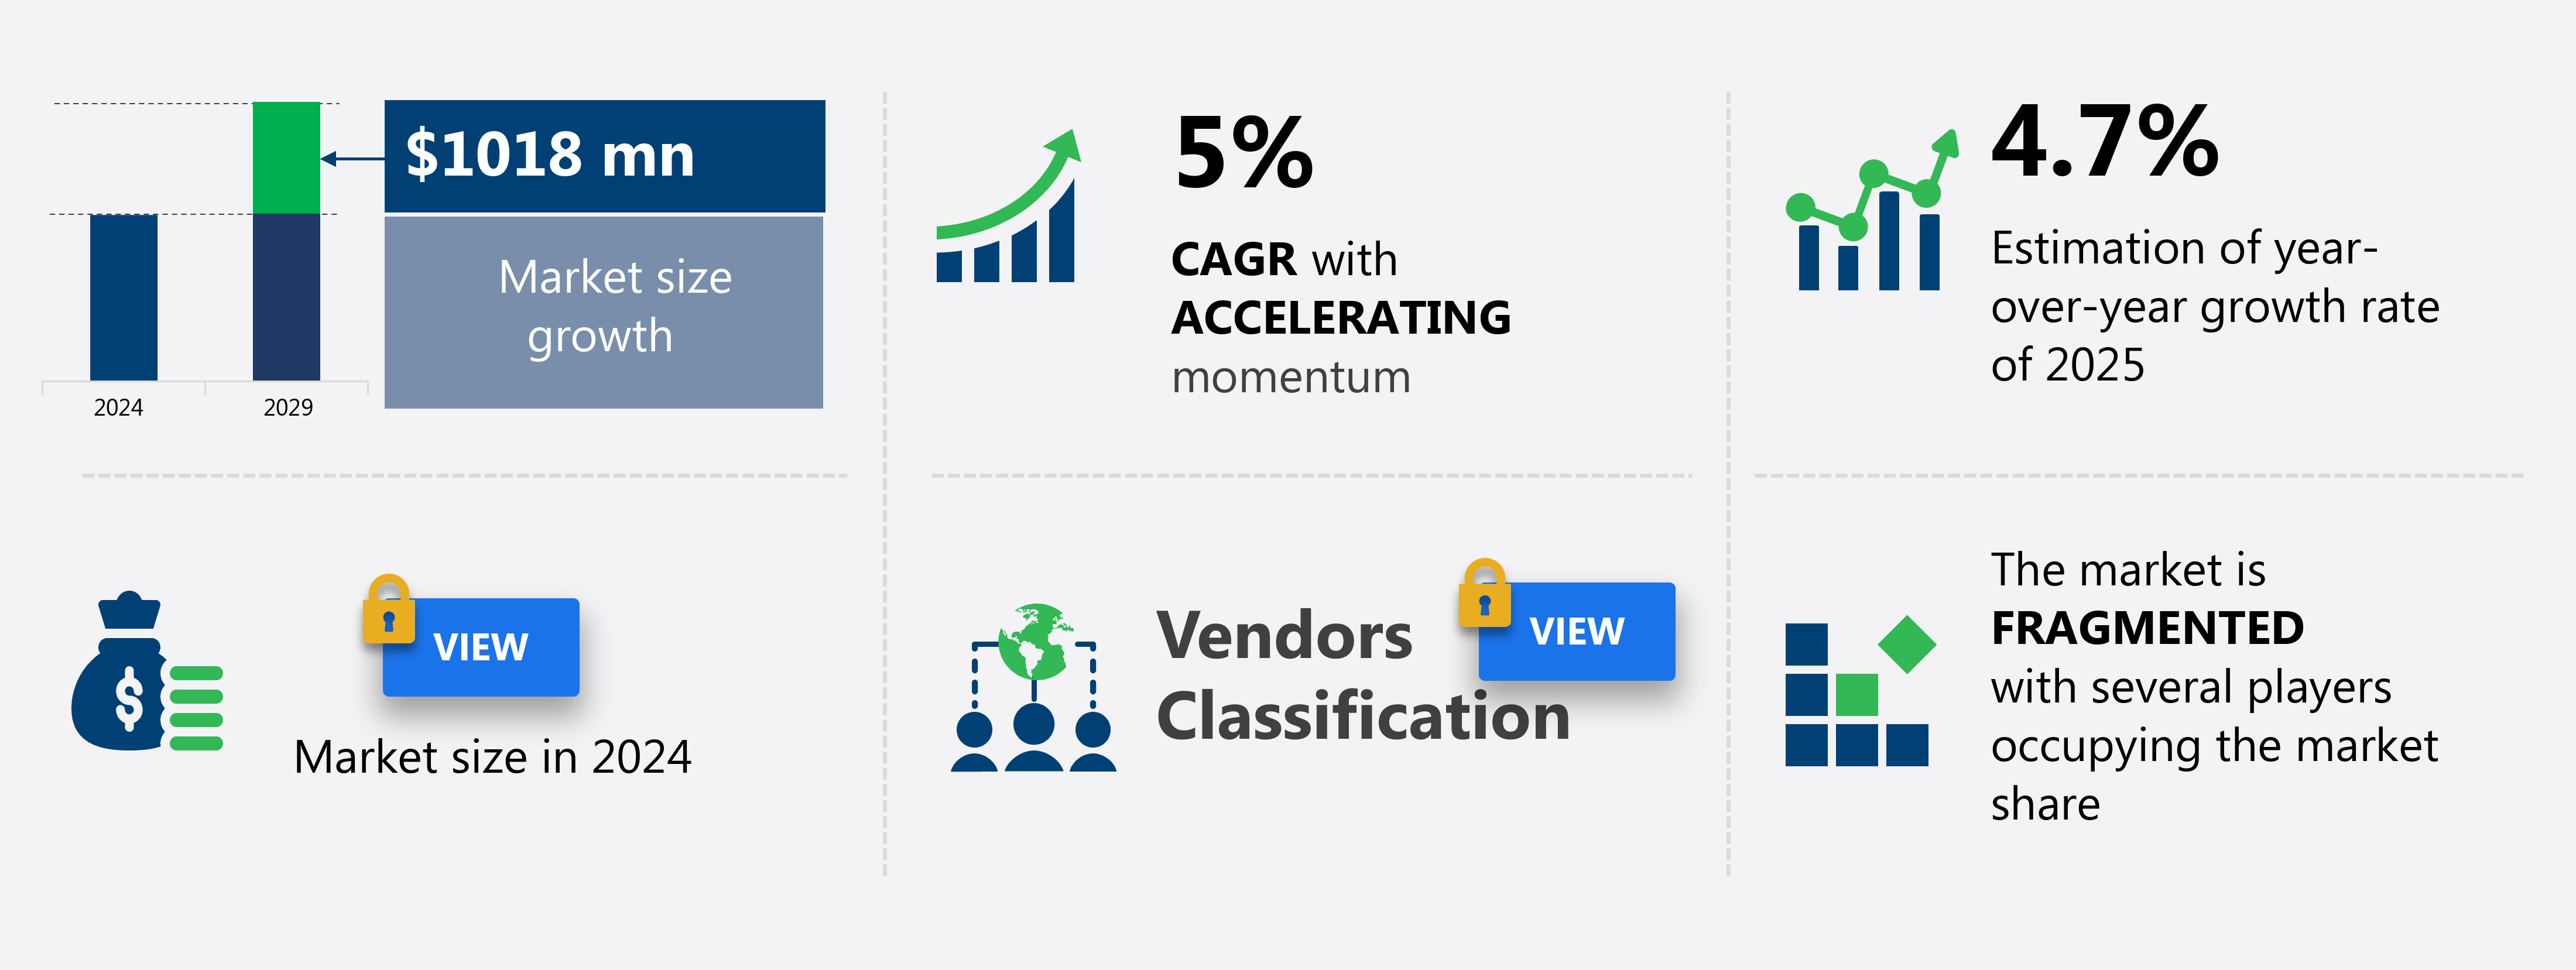
The drywall repair services market size in North America is forecast to increase by USD 1.02 billion at a CAGR of 5% between 2024 and 2029.
-
The Drywall Repair Services Market is experiencing significant growth, driven by the aging housing stock in the US. With many homes reaching the end of their life cycle, the demand for repair and maintenance services, including drywall repair, is on the rise. Furthermore, technological integration in drywall repair services is transforming the industry, enabling faster and more efficient repairs through advanced tools and techniques. However, labor shortages pose a challenge to market growth, as the demand for skilled labor outpaces the supply. The market is benefiting from advancements in logistics, which streamline the distribution of products, ensuring timely delivery and reducing costs for construction projects. However, challenges persist in the market, including the complexity of texture application and the need for skilled labor.
-
The market is witnessing significant growth due to several key factors. The rising number of infrastructural and construction activities is driving market growth, as drywall texturing is a popular choice for interior finishing in new and renovated buildings. Additionally, the increasing focus on organized retailing is boosting market demand, as home improvement stores and large retailers offer a wide range of drywall texturing products and services. Proper training and the use of advanced tools and techniques can help mitigate these challenges and ensure high-quality results. Overall, the market is expected to continue its growth trajectory, driven by these market dynamics. As the housing market continues to recover and homeowners prioritize maintenance and upkeep, the Drywall Repair Services Market is poised for continued expansion.
What will be the Size of the market During the Forecast Period?
-
The drywall repair services market encompasses a range of offerings, from customer service and business development to product solutions such as anchors, adhesives, and sealants. Drywall marketing strategies prioritize effective communication and high-quality service to attract and retain clients. In addition to traditional fasteners, the market also caters to the use of drywall screws and nails for improved installation and structural integrity. Drywall estimation software streamlines the quoting process, enabling businesses to provide accurate and timely proposals. Building codes and industry standards dictate the use of specific drywall materials and installation techniques for safety and compliance. Moisture control, mold remediation, and fireproofing are essential services in the drywall industry, addressing common issues that can impact the longevity and quality of drywall installations.
-
Drywall certification programs ensure professionals possess the necessary skills and knowledge to deliver top-notch services. Sound reflection, absorption, and thermal resistance are essential considerations for both residential and commercial projects, with various design tools and primers available to optimize acoustic and energy performance. Drywall ventilation is another crucial aspect, preventing moisture buildup and ensuring indoor air quality. Asbestos removal services address health and safety concerns associated with older buildings, while drywall licensing regulations ensure that contractors meet the necessary requirements to operate legally. Drywall coatings and fireproofing materials offer additional protection and durability to installations. The drywall market is continually evolving, with ongoing advancements in materials, tools, and techniques driving innovation and growth. To ensure optimal performance and safety, it is essential to follow the manufacturer's manual and use necessary gear like safety glasses and gloves.
-
The drywall repair services market in North America is expanding as homeowners and contractors seek efficient solutions for damaged walls. Comprehensive drywall repair kits simplify minor fixes, while professional drywall removal and drywall replacement address extensive damage. Enhanced drywall texture and specialized drywall crack repair techniques restore aesthetics. Safety considerations drive demand for drywall fire rating, drywall impact resistance, and drywall soundproofing, ensuring durable interiors. Experts rely on high-quality drywall trowels and drywall taping knives for precision. Consumer confidence is reinforced through drywall warranty and drywall insurance offerings. Rising drywall labor costs highlight the need for streamlined drywall scheduling systems. Adhesives and toppings joint compounds are essential for securing drywall textures to various surfaces.
How is this market segmented and which is the largest segment?
The market research report provides comprehensive data (region-wise segment analysis), with forecasts and estimates in "USD million" for the period 2025-2029, as well as historical data from 2019-2023 for the following segments.
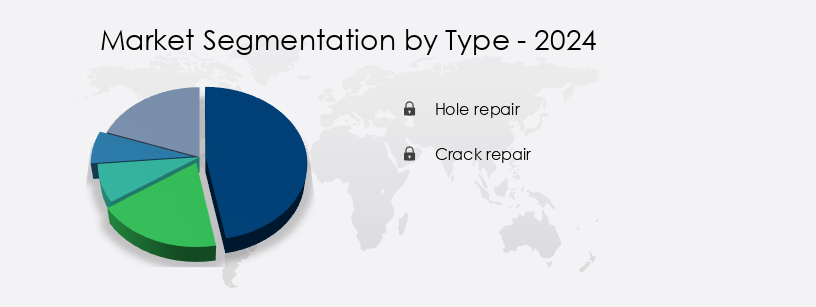
- Type
- Hole repair
- Crack repair
- Application
- Interior space
- Exterior space
- End-user
- Residential
- Commercial
- Geography
- North America
- US
- Canada
- Mexico
- North America
By Type Insights
The hole repair segment is estimated to witness significant growth during the forecast period. The market is marked by the prevalence of hole repair, a critical segment catering to various needs, from cosmetic to structural restoration. Holes in drywall surfaces result from everyday activities, such as fixture installations or removals, accidental impacts, and general wear and tear, affecting both residential and commercial spaces. These damages, which can range from small to extensive, are classified into three categories based on size and severity. Drywall code compliance is paramount in hole repair, ensuring that the repaired areas meet regulatory standards. Drywall mud and joint compound are essential tools for filling and smoothing the repaired areas. Fire damage repair and ceiling repair are specialized services, requiring unique expertise and equipment. The industry's ongoing evolution underscores the importance of staying informed about the latest trends, techniques, and technologies. Drywall's adaptability ensures its continued relevance in the construction sector.
Drywall contractors offer scheduling flexibility and expertise for larger-scale projects, while insurance coverage protects property owners from potential liabilities. Drywall acoustics and soundproofing are essential considerations for both residential and commercial applications. Drywall cost estimation, disposal, and labor costs are essential factors in the repair process. Drywall technicians employ various techniques, including taping and sanding, to ensure a seamless finish. Drywall project timeline management is crucial for minimizing downtime and maintaining client satisfaction. Fire rating and moisture resistance are essential drywall properties for ensuring safety and durability. Drywall painting and water damage repair are common additional services. The home improvement industry plays a significant role in the market, with DIY applications contributing to its growth.
Drywall installation, removal, and recycling are also part of the market's scope. Drywall equipment, including scaffolding and lifting equipment, facilitate efficient repairs. Drywall project management involves coordinating various aspects, from estimation to completion. Drywall pricing, warranties, and repair kits ensure customer satisfaction and repeat business. Ceiling repair and fire damage repair are additional services that cater to specific needs. Drywall sustainability, insulation, and impact resistance are emerging trends in the market. Drywall businesses that prioritize customer service, adhere to industry standards, and invest in continuous learning and improvement will thrive in this competitive landscape. The numerous advantages offered by nail guns for various carpentry projects, including framing, fence installation, deck building, and drywall, their usage comes with certain challenges.
Get a glance at the market report of share of various segments Request Free Sample
Market Dynamics
Our North America Drywall Repair Services Market researchers analyzed the data with 2024 as the base year, along with the key drivers, trends, and challenges. A holistic analysis of drivers will help companies refine their marketing strategies to gain a competitive advantage.
What are the key market drivers leading to the rise in adoption of North America Drywall Repair Services Market?
-
Aging housing stock is the key driver of the market. The North American drywall repair services market is experiencing significant growth due to the aging housing inventory. In the US, the median age of owner-occupied homes reached 41 years in 2023, indicating a substantial portion was built before the 1980s. This increasing age necessitates maintenance and structural updates, including drywall repair and replacement. Similarly, in Canada, the average home age is approximately 39 years. Drywall repair services encompass various aspects, such as fire rating, water damage repair, joint compound application, drywall patching, and texture application.
-
Drywall safety standards are crucial in this industry, ensuring the use of appropriate impact resistance materials and adherence to fire safety regulations. Overall, the demand for drywall repair services in North America is expected to continue due to the aging housing stock and the need for ongoing maintenance and structural updates. Drywall estimators utilize advanced equipment, including drywall scaffolding and moisture resistance testing devices, to assess damage and determine the extent of repairs. Known as whiteboard or regular drywall, this type of gypsum board is commonly used for walls and ceilings due to its versatility and affordability.
What are the market trends shaping the North America Drywall Repair Services Market?
-
Technological integration in drywall repair services is the upcoming trend in the market. The North American drywall repair services market is experiencing significant advancements, driven by the integration of innovative technologies. Augmented reality (AR) tools are leading the charge, enabling contractors to visualize repair areas and projected outcomes before initiating work. These tools enhance damage assessment accuracy and material estimation, reducing misunderstandings and project delays. AR applications overlay repair plans directly onto wall surfaces via smartphones or tablets, streamlining communication between service providers and clients.
-
Drywall budgeting, crack repair, and project management are all set to benefit from these technological innovations, leading to increased efficiency and customer satisfaction. Drywall material costs, sanding techniques, warranty, repair kits, taping knives, trowels, and fire damage repair are also areas where technological advancements are making a difference. The drywall pricing model is evolving, with a shift towards more transparent and competitive pricing, ensuring that clients get the best value for their investment. Furthermore, automation and robotics are gradually influencing the sector, with robotic systems for drywall installation and finishing reducing the reliance on manual labor. Although still in the early stages of adoption, these advancements are poised to revolutionize the drywall repair services industry.
What challenges does North America Drywall Repair Services Market face during the growth?
-
Labor shortages is a key challenge affecting the market growth. The market faces a considerable challenge due to persistent labor shortages. According to recent reports, the US construction industry had over 456,000 unfilled positions as of early 2024, approaching the record high observed in 2022. The Home Builders Institute stresses the need for an annual influx of new workers to address housing and infrastructure demands. This labor deficiency directly affects the availability of skilled drywall professionals, leading to project delays and increased labor expenses. In Canada, the skilled trades labor shortage is equally pressing. Employment and Social Development Canada has reported ongoing shortages in the construction sector.
-
Drywall repair services encompass various aspects, including drywall tools, drywall cutters, drywall inspection, ceiling repair, drywall sustainability, drywall insulation, drywall sanding equipment, drywall installation, drywall knives, drywall finishing, and tape application. The labor shortage affects each of these processes, potentially leading to delays and increased costs. Drywall recycling and drywall lifting equipment are also essential components of the market, further impacted by the labor shortage. The market dynamics are influenced by several factors, including the availability of skilled labor, demand for housing and infrastructure development, and advancements in drywall technology. The labor crunch is intensified by the growing demand for housing and infrastructure development, with projections indicating that Canada may require around 500,000 additional construction workers by 2030 to meet national requirements.
Exclusive Customer Landscape
The market forecasting report includes the adoption lifecycle of the market, covering from the innovator's stage to the laggard's stage. It focuses on adoption rates in different regions based on penetration. Furthermore, the market report also includes key purchase criteria and drivers of price sensitivity to help companies evaluate and develop their market growth analysis strategies.

Customer Landscape
Key Companies & Market Insights
Companies are implementing various strategies, such as strategic alliances, market forecast, partnerships, mergers and acquisitions, geographical expansion, and product/service launches, to enhance their presence in the market.
Acousti Engineering Co of Florida - This company specializes in comprehensive interior solutions, providing expertise in drywall repair services, including drywall systems, acoustical ceilings, framing, carpentry, metal decking, and exterior insulated finish systems.
The market research and growth report includes detailed analyses of the competitive landscape of the market and information about key companies, including:
- Acousti Engineering Co of Florida
- Anning-Johnson Co
- BakerTriangle
- California Drywall Corp
- Certa ProPainters Ltd.
- Daleys Drywall
- Interstate Drywall Corp
- J and B Acoustical
- Mr. Handyman
- North America Drywall LLC.
- Patch Dudes
- PatchMaster Franchise LLC
- Performance Contracting Inc.
- Precision Walls Inc
- South Valley Drywall
- Standard Drywall Inc
- The Lee Co.
- The Patch Boys
- The Raymond Group
- Tri-City Drywall Inc
Qualitative and quantitative analysis of companies has been conducted to help clients understand the wider business environment as well as the strengths and weaknesses of key market players. Data is qualitatively analyzed to categorize companies as pure play, category-focused, industry-focused, and diversified; it is quantitatively analyzed to categorize companies as dominant, leading, strong, tentative, and weak.
Recent Development and News in Drywall Repair Services Market In North America
- In February 2023, PPG Industries, a leading paints, coatings, and specialty materials company, announced the expansion of its Drywall Repair Solutions business through the acquisition of a leading drywall repair company in the Midwest region of the United States (PPG Industries Press Release, 2023). This strategic move is expected to enhance PPG's presence in the drywall repair services market and broaden its customer base.
- In March 2024, 3M, a global innovation company, launched a new line of drywall repair products under its renowned "Scotch-Weld" brand (3M Press Release, 2024). The new product line includes a range of adhesives, sealants, and patching compounds designed to provide professional-grade results for both residential and commercial applications.
- In May 2024, the U.S. Environmental Protection Agency (EPA) introduced new regulations aimed at reducing the use of traditional gypsum-based drywall in favor of more eco-friendly alternatives (EPA Press Release, 2024). This initiative is expected to create significant opportunities for companies offering green drywall repair solutions, as the construction industry shifts towards more sustainable practices.
Research Analyst Overview
The drywall repair services market continues to evolve, driven by the diverse needs of various sectors. Drywall's versatility, as a building material, is showcased through its applications in fire rating, painting, water damage repair, and joint compound use. The industry's dynamics are shaped by the ongoing demand for drywall patching, texture application, and equipment innovation. Drywall estimators play a crucial role in the market, ensuring accurate cost estimation for projects. Safety standards are paramount, with drywall moisture resistance, impact resistance, and fire safety ratings being essential considerations. Drywall scaffolding and lifting equipment facilitate efficient wall repair and installation processes.
The market's continuous unfolding is reflected in the emergence of drywall sustainability, insulation, and acoustics as key concerns. Drywall disposal and recycling are gaining importance as environmental considerations become more prominent. The role of drywall contractors and technicians remains pivotal, with their expertise in drywall project timeline management and budgeting essential for successful projects. Drywall tools, such as knives, trowels, and sanding equipment, continue to evolve, enhancing productivity and quality. The market's dynamics are further shaped by insurance, labor costs, and project management complexities. Drywall pricing and warranty remain critical factors, with repair kits and taping knives offering cost-effective solutions for smaller repairs.
The drywall repair services market in North America is witnessing steady growth due to increasing demand for structural integrity and aesthetic restoration. Professionals rely on high-quality drywall anchors, drywall fasteners, and drywall nails to ensure secure installations. The use of drywall adhesives, drywall primers, and drywall sealants enhances durability and surface finish. Addressing environmental concerns, drywall mold remediation, drywall asbestos removal, and drywall moisture control are crucial services. Safety is paramount, leading to advancements in drywall fireproofing, drywall sound absorption, drywall sound reflection, and drywall thermal resistance. Compliance with drywall building codes and drywall safety training strengthens industry practices. Innovations in drywall industry standards, drywall software, and drywall design tools drive efficiency. Effective drywall business development, drywall customer service, and positive drywall reviews ensure sustained market expansion.
Dive into Technavio's strong research methodology, blending expert interviews, extensive data synthesis, and validated models for unparalleled Drywall Repair Services Market in North America insights. See full methodology.
|
Market Scope |
|
|
Report Coverage |
Details |
|
Page number |
178 |
|
Base year |
2024 |
|
Historic period |
2019-2023 |
|
Forecast period |
2025-2029 |
|
Growth momentum & CAGR |
Accelerate at a CAGR of 5% |
|
Market growth 2025-2029 |
USD 1.02 billion |
|
Market structure |
Fragmented |
|
YoY growth 2024-2025(%) |
4.7 |
|
Key countries |
US, Canada, and Mexico |
|
Competitive landscape |
Leading Companies, Market Positioning of Companies, Competitive Strategies, and Industry Risks |
What are the Key Data Covered in this Market Research and Growth Report?
- CAGR of the market during the forecast period
- Detailed information on factors that will drive the market growth and forecasting between 2025 and 2029
- Precise estimation of the size of the market and its contribution of the market in focus to the parent market
- Accurate predictions about upcoming market growth and trends and changes in consumer behaviour
- Growth of the market across North America
- Thorough analysis of the market's competitive landscape and detailed information about companies
- Comprehensive analysis of factors that will challenge the growth of market companies
We can help! Our analysts can customize this market research report to meet your requirements. Get in touch
 RIA -
RIA - 
