Nuclear Grade Ion Exchange Resin Market Size 2024-2028
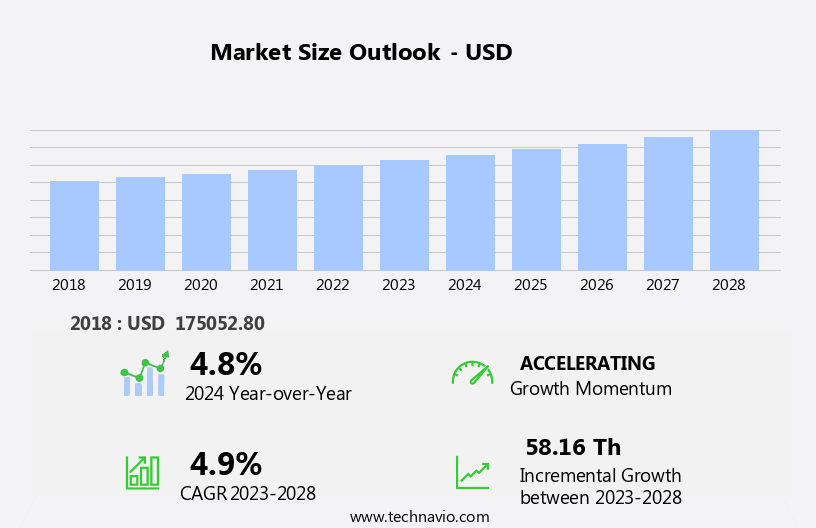
The nuclear grade ion exchange resin market size is forecast to increase by USD 58.16 thousand at a CAGR of 4.9% between 2023 and 2028.
- The market is experiencing significant growth due to the increasing demand for nuclear energy worldwide. This trend is driven by the need to reduce greenhouse gas emissions and the reliability and efficiency of nuclear power plants. companies in this market are responding to this demand by launching new products to cater to the growing market. In addition, Borated resins are employed in deborating beds to reduce boron concentration, while lithiated resins are utilized in lithium removal beds. Additionally, the high cost of nuclear grade ion exchange resins and the complex regulatory environment are hindering market growth. Despite these challenges, the market is expected to continue growing due to the increasing demand for clean energy and the reliability of nuclear power.
What will be the Size of the Nuclear Grade Ion Exchange Resin Market During the Forecast Period?
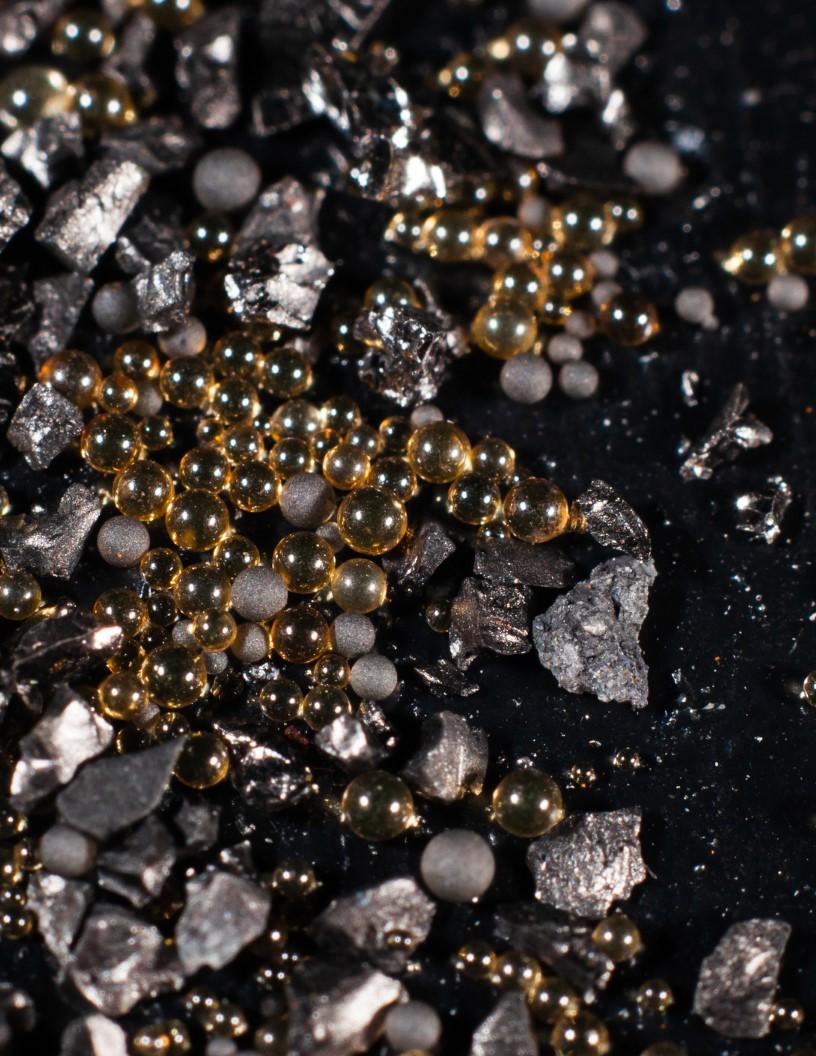
- The market encompasses the production and supply of specialized resins used in the nuclear power industry for various water purification applications. These resins play a crucial role in maintaining the efficiency and safety of nuclear power plants by removing dissolved contaminants from ultrapure water used in steam cycles and reactor coolant systems. Nuclear grade ion exchange resins come in various forms, including anion and cation resins, and are available in high capacity, highly crosslinked versions for borated and lithiated applications. These resins are essential for the removal of cations such as boron and anions like lithium from the water. Applications include condensate polishers, deborating beds for boron reduction, fuel pool demineralizers, and lithium removal beds, among others.
- Furthermore, the market is driven by the increasing demand for nuclear power generation and the need for efficient and effective water purification technologies. Mixed-bed columns, elution, and the use of specialty forms of anion and cation resins in reactor water cleanup, stator cooling, and radwaste demineralization further expand the market's scope.
How is this Nuclear Grade Ion Exchange Resin Industry segmented and which is the largest segment?
The nuclear grade ion exchange resin industry research report provides comprehensive data (region-wise segment analysis), with forecasts and estimates in "Thousand" for the period 2024-2028, as well as historical data from 2018-2022 for the following segments.
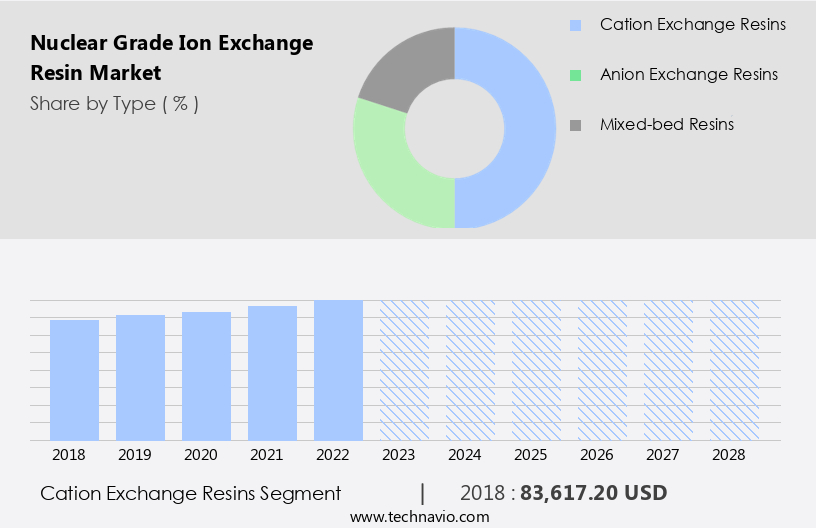
- Type
- Cation exchange resins
- Anion exchange resins
- Mixed-bed resins
- End-user
- Nuclear power generation
- Research facilities
- Medical applications
- Geography
- North America
- Canada
- US
- Europe
- Germany
- UK
- France
- APAC
- China
- India
- South America
- Brazil
- Middle East and Africa
- South Africa
- North America
By Type Insights
- The cation exchange resins segment is estimated to witness significant growth during the forecast period.
Cation exchange resins are essential components in the nuclear industry due to their ability to attract and exchange positively charged ions, including calcium, magnesium, and radioactive isotopes. In nuclear power plants, these resins play a crucial role in maintaining ultrapure water quality for reactor efficiency and equipment protection. By selectively removing harmful cations, they reduce contamination risks and extend the operational lifespan of nuclear systems. Cation exchange resins are primarily used in demineralization processes, ensuring water meets stringent safety standards. In nuclear waste treatment and disposal, these resins are indispensable for cleaning reactor cooling water and processing radioactive liquid waste.
Get a glance at the Nuclear Grade Ion Exchange Resin Industry report of share of various segments Request Free Sample
The cation exchange resins segment was valued at USD 83,617.20 in 2018 and showed a gradual increase during the forecast period.
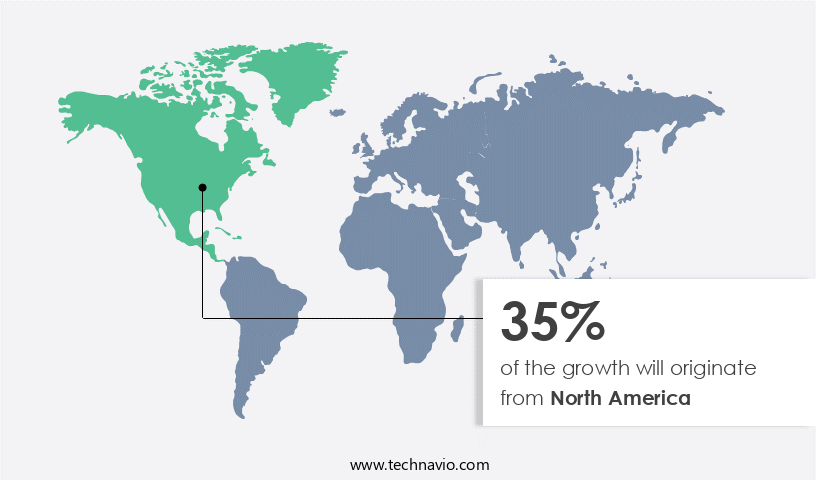
Regional Analysis
- North America is estimated to contribute 35% to the growth of the global market during the forecast period.
Technavio's analysts have elaborately explained the regional trends and drivers that shape the market during the forecast period.
For more insights on the market share of various regions, Request Free Sample
The market in North America is significant, driven primarily by the United States and Canada. With approximately 93 commercial nuclear reactors in 54 power plants across 28 states, the US produces around 20% of its electricity from nuclear sources. Given the extensive nuclear infrastructure, there is a substantial demand for high-quality ion exchange resins to support water treatment and radioactive waste management processes. Strict water purity regulations in nuclear facilities necessitate effective ion exchange solutions to ensure regulatory compliance. These resins, available in various forms such as mixed bed, anionic, and cationic, play a vital role in the removal of dissolved contaminants, including radioactive ions, from ultrapure water used in steam cycles and reactor coolant systems.
Market Dynamics
Our researchers analyzed the data with 2023 as the base year, along with the key drivers, trends, and challenges. A holistic analysis of drivers will help companies refine their marketing strategies to gain a competitive advantage.
What are the key market drivers leading to the rise in the adoption of Nuclear Grade Ion Exchange Resin Industry?
Rising demand for nuclear energy is the key driver of the market.
- The market is experiencing significant growth due to the increasing demand for nuclear energy as a reliable and low-carbon power source. In 2023, nuclear power plants generated 2,602 terawatt-hours of electricity, a 2.5% increase from the previous year. This trend is driven by countries' efforts to reduce greenhouse gas emissions and meet the increasing global energy demand. Nuclear power plants provide a stable alternative to intermittent renewable sources like wind and solar. Ion exchange resins play a crucial role in the nuclear power industry by purifying ultrapure water used in various applications, including the Reactor Coolant System, Boron concentration control, and Reactor Water Cleanup.
- In addition, these resins are available in different forms, such as Mixed bed, Anion resins, and Cation resins, each with unique properties to address specific contaminants. Highly crosslinked resins, Borated resins, and Lithiated resins are commonly used in Nuclear power plants. These resins are designed to have high capacity, making them ideal for removing dissolved contaminants from the water. The ion-exchange process involves elution, where the resins are cleaned using a saline solution, desorbing the radioactive ions. The nuclear industry's operational parameters require rigorous cleaning systems, including conditioning, washing, and elution, to maintain the resins' performance. The desorption process follows a linear model, and the specific activity and storage time of the radioactive nuclides determine the regeneration frequency.
What are the market trends shaping the Nuclear Grade Ion Exchange Resin Industry?
New product launches by companies is the upcoming market trend.
- The market is witnessing significant growth due to the increasing demand for advanced resin formulations in nuclear power plants. The focus on enhancing efficiency, sustainability, and regulatory compliance in various applications, such as water purification, reactor coolant systems, and radioactive waste management, is driving market expansion. Manufacturers are introducing new products to cater to these demands. For example, Lanxess launched Lewatit S 1567 Scopeblue on April 29, 2024, a strongly acidic cation exchange resin designed for industrial applications. This resin, produced through a solvent-free process, offers enhanced resistance to disinfectants. Advanced resins, such as borated resins, lithiated resins, and specialty forms, are crucial in applications like boron concentration control, deborating beds, boron reduction, fuel pool demineralizers, lithium removal beds, radwaste demineralizers, reactor water cleanup, stator cooling, and elution.
- Furthermore, these resins undergo various pretreatment operations, including elution, washing, conditioning, and regeneration, to ensure optimal performance. The ion-exchange process plays a vital role in the desorption of radioactive nuclides from the resins using saline solutions. The desorption process follows a linear model, and the specific activity and storage time of the nuclear waste impact the efficiency of the process. The market dynamics involve various factors, including operational parameters, cleaning system design, and the choice of cationic resins and anionic resins for eluting radioactive ions. Technological advancements in the desorption process, such as vacuum filtration, centrifugation, grinding, pulverization, and thermal methods, are also contributing to market growth.
What challenges does the Nuclear Grade Ion Exchange Resin Industry face during its growth?
Competition from alternative technologies is a key challenge affecting the industry growth.
- The market encounters notable challenges from emerging membrane filtration technologies, particularly reverse osmosis (RO) and nanofiltration. These advanced methods are gaining popularity due to their efficiency and cost-effectiveness in water treatment and radioactive waste management. Membrane technologies effectively remove contaminants, including radionuclides, without requiring chemical regeneration, which is a common necessity for ion exchange resins. In the nuclear industry, membrane filtration systems are increasingly being utilized for decontaminating wastewater. For instance, RO systems have been adopted at the Fukushima Daiichi Nuclear Power Plant to treat contaminated water, highlighting their capability to handle radioactive isotopes efficiently. The ion-exchange process, a key application of nuclear grade ion exchange resins, involves the use of resins to remove dissolved contaminants from ultrapure water in nuclear power plants.
- In addition, this process includes various steps such as conditioning, washing, elution, and regeneration. Anionic and cationic resins, such as highly crosslinked borated and lithiated resins, are commonly used in this process. The specific activity and storage time of radioactive nuclides, operational parameters, and pretreatment operations like vacuum filtration, centrifugation, grinding, and pulverization, are critical factors affecting the ion-exchange process. The immobilization of nuclear waste through vitrification and the desorption process of radioactive ions using saline solution are also essential aspects of this technology.
Exclusive Customer Landscape
The nuclear grade ion exchange resin market forecasting report includes the adoption lifecycle of the market, covering from the innovator's stage to the laggard's stage. It focuses on adoption rates in different regions based on penetration. Furthermore, the nuclear grade ion exchange resin market report also includes key purchase criteria and drivers of price sensitivity to help companies evaluate and develop their market growth analysis strategies.

Customer Landscape
Key Companies & Market Insights
Companies are implementing various strategies, such as strategic alliances, nuclear grade ion exchange resin market forecast, partnerships, mergers and acquisitions, geographical expansion, and product/service launches, to enhance their presence in the industry.
The industry research and growth report includes detailed analyses of the competitive landscape of the market and information about key companies, including:
- Aldex Chemical Co. Ltd.
- Auchtel Products Ltd.
- Bengbu Dongli Chemical Co. Ltd.
- DuPont de Nemours Inc.
- Evoqua Water Technologies LLC
- Graver Technologies LLC
- Idreco Srl
- Ion Exchange India Ltd.
- Lanxess AG
- Mitsubishi Chemical Group Corp.
- Ovivo Inc.
- Purolite Corp.
- ResinTech Inc.
- Samco Technologies Inc.
- Samyang Corporation
- Sunresin New Materials Co. Ltd.
- Suqing Group
- Taiyuan Lanlang Technology Industrial Corp.
- Thermax Ltd.
- Zhejiang Zhengguang Industrial Co. Ltd.
Qualitative and quantitative analysis of companies has been conducted to help clients understand the wider business environment as well as the strengths and weaknesses of key industry players. Data is qualitatively analyzed to categorize companies as pure play, category-focused, industry-focused, and diversified; it is quantitatively analyzed to categorize companies as dominant, leading, strong, tentative, and weak.
Research Analyst Overview
The market encompasses a specialized segment of the water treatment industry, catering to the unique demands of the nuclear power sector. This market is driven by the need for ultrapure water in various nuclear applications, including steam cycle processes and reactor coolant systems. Nuclear power plants rely on ion exchange resins to remove dissolved contaminants from water, ensuring the production of high-purity water essential for the safe and efficient operation of the plant. These resins, available in various forms such as mixed bed, anion, and cation, play a crucial role in the purification process. Mixed bed resins, a common choice in nuclear applications, are characterized by their high capacity and high crosslinking.
Moreover, they are designed to provide efficient removal of both anionic and cationic ions. Anion resins, specifically, are effective in removing negatively charged ions, while cation resins target positively charged ions. Borated and lithiated resins are specialty forms of ion exchange resins used in nuclear applications. Both types of resins are integral to the boron reduction process and the removal of radwaste. The ion-exchange process, a fundamental aspect of nuclear water purification, involves the exchange of ions between the resin and the water.
In addition, elution, a critical step in the process, involves the desorption of ions from the resin using a saline solution. This process is crucial for the regeneration of the resin, allowing it to be reused in the water purification system. The hazardous waste management sector also benefits from ion exchange resins. These resins play a significant role in the immobilization and vitrification of nuclear waste, ensuring the safe and efficient storage and disposal of radioactive materials. Pretreatment operations, such as vacuum filtration, centrifugation, grinding, and pulverization, are often employed to prepare feedwater for ion exchange processes. These operations help to remove large particles and suspended solids, ensuring the optimal performance of the ion exchange resins.
Furthermore, the operational parameters of research nuclear reactors and the conditioning, washing, and eluting of the resins are all critical factors that influence the performance and longevity of the ion exchange system. A linear model can be used to analyze the desorption process and optimize the operational parameters for maximum efficiency and cost-effectiveness.
|
Market Scope |
|
|
Report Coverage |
Details |
|
Page number |
209 |
|
Base year |
2023 |
|
Historic period |
2018-2022 |
|
Forecast period |
2024-2028 |
|
Growth momentum & CAGR |
Accelerate at a CAGR of 4.9% |
|
Market growth 2024-2028 |
USD 58.16 th |
|
Market structure |
Fragmented |
|
YoY growth 2023-2024(%) |
4.8 |
|
Key countries |
US, China, France, Germany, Canada, India, UK, Brazil, Russia, and South Africa |
|
Competitive landscape |
Leading Companies, market growth and forecasting, Market Positioning of Companies, Competitive Strategies, and Industry Risks |
What are the Key Data Covered in this Nuclear Grade Ion Exchange Resin Market Research and Growth Report?
- CAGR of the Nuclear Grade Ion Exchange Resin industry during the forecast period
- Detailed information on factors that will drive the growth and forecasting between 2024 and 2028
- Precise estimation of the size of the market and its contribution of the industry in focus to the parent market
- Accurate predictions about upcoming growth and trends and changes in consumer behaviour
- Growth of the market across North America, Europe, APAC, South America, and Middle East and Africa
- Thorough analysis of the market's competitive landscape and detailed information about companies
- Comprehensive analysis of factors that will challenge the nuclear grade ion exchange resin market growth of industry companies
We can help! Our analysts can customize this nuclear grade ion exchange resin market research report to meet your requirements.