Oil and Chemical Spill Kits Market Analysis North America,APAC,Europe,South America,Middle East and Africa - US,Canada,China,India,Germany - Size and Forecast 2024-2028

Oil and Chemical Spill Kits Market Analysis North America,APAC,Europe,South America,Middle East and Africa - US,Canada,China,India,Germany - Size and Forecast 2024-2028

Published: Dec 2023 159 Pages SKU: IRTNTR73867

Market Overview at a Glance

$69.68 Mn
Market Opportunity
4.61%
CAGR
3.5
YoY growth 2023-2024(%)

Oil and Chemical Spill Kits Market Size 2024-2028

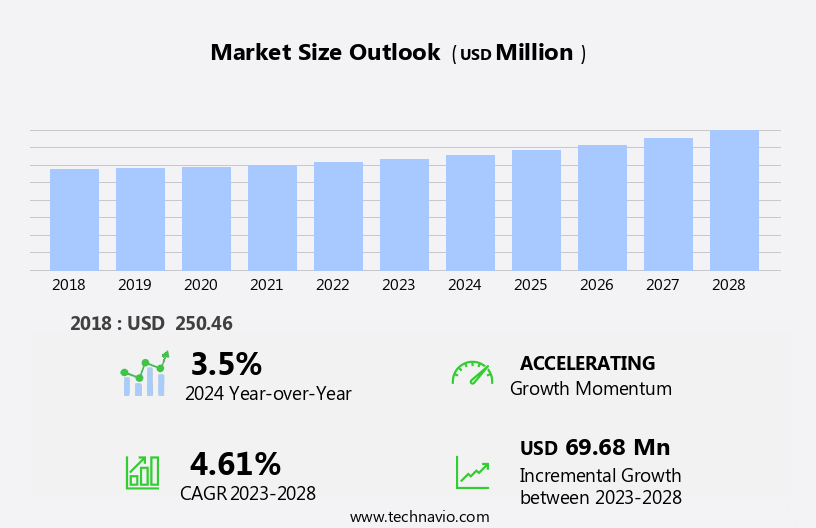
The oil and chemical spill kits market size is forecast to increase by USD 69.68 million at a CAGR of 4.61% between 2023 and 2028.

  • The market is witnessing significant growth due to several key trends. The increase in trading activities, particularly In the maritime industry, is driving market growth. Additionally, the launch of mobile spill response kits, which offer greater flexibility and convenience, is gaining popularity. Another factor fueling market growth is the volatility in raw material prices, leading to the adoption of cost-effective solutions. However, challenges such as stringent regulatory requirements and the high cost of spill response equipment pose significant obstacles to market growth. To mitigate these challenges, market participants are focusing on innovation and technology to develop cost-effective and compliant solutions.
  • Overall, the market is expected to continue its growth trajectory, driven by these trends and challenges.

  • What will be the Size of the Oil and Chemical Spill Kits Market During the Forecast Period?

    Oil and Chemical Spill Kits Market Size

     Request Free Sample

  • The market encompasses a range of products designed to mitigate the environmental and health risks associated with hydrocarbon spills, including those from petroleum products, and the release of hazardous chemicals. Key market drivers include the ongoing demand for oil and gas extraction, both onshore and offshore, as well as the growth of maritime trade and marine operations. Spill response solutions include absorbent materials such as sand, rags, kitty litter, and innovative absorbents, as well as containment instruments like booms and skimmers. Additionally, personal protective equipment, cleanup supplies, and solvents like mineral spirits are essential components of comprehensive spill response strategies.
  • The petrochemicals sector and transportation sector are significant markets for oil and chemical spill kits, with a focus on minimizing environmental pollution and ensuring human health and safety. The Internet of Things (IoT) is increasingly being integrated into spill response technology to improve efficiency and response times. Overall, the market is expected to continue growing in response to the expanding demand for effective spill response solutions in various industries.

  • How is this Oil and Chemical Spill Kits Industry segmented and which is the largest segment?

    The oil and chemical spill kits industry research report provides comprehensive data (region-wise segment analysis), with forecasts and estimates in "USD million" for the period 2024-2028, as well as historical data from 2018-2022 for the following segments.

    • End-user
      • Oil
      • Chemical
    • Type
      • Blood spill kit
      • Universal absorbent pads
    • Geography
      • North America
        • Canada
        • US
      • APAC
        • China
        • India
      • Europe
        • Germany
      • South America
        • Middle East and Africa

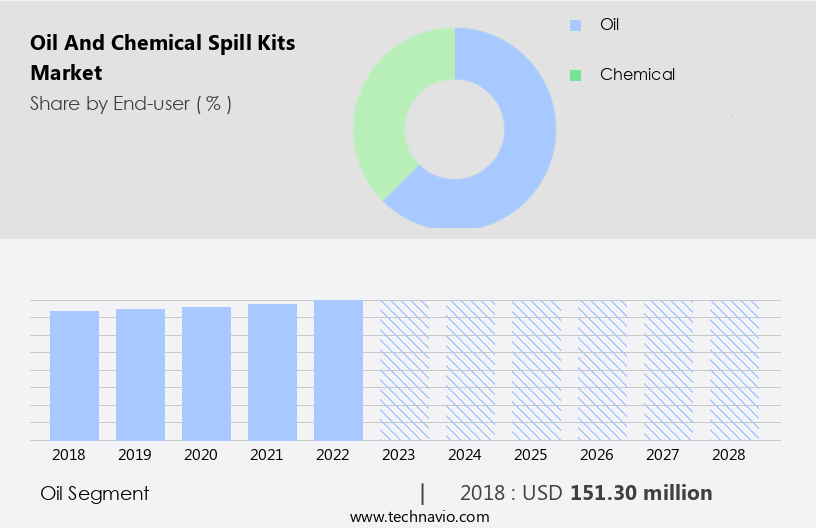
        By End-user Insights

        The oil segment is estimated to witness significant growth during the forecast period. The market encompasses a range of products utilized for managing oil and chemical spills in various industries. In 2023, the oil spill kits segment held the second-largest market share. Oil spills can originate from crude and non-crude sources, including diesel oil, marine gas oil, petrol, aviation gasoline, oily water mixture, and others. Most oil spills stem from equipment failure and human error, posing significant threats to the environment. Oil spill kits are essential for mitigating the adverse effects of oil spills on land and aquatic life. These kits effectively absorb oil from water bodies and various industries, preventing further damage.

        Key components of oil spill kits include absorbent materials, such as sand, rags, kitty litter, solvents, mineral spirits, and acetone. Safety gear, including goggles, gloves, and respirators, is also integral to these kits. The energy industry, particularly the oil and gas sector, accounts for a significant portion of the market demand. Other key sectors include natural gas, petrochemicals, transportation, and marine operations. Incorporating eco-friendly products and innovative technologies, such as nanofibers and IoT, is a growing trend In the market. Global sustainability goals and regulations emphasize the importance of effective spill management and prevention.


        Oil and Chemical Spill Kits Market Size

        Get a glance at the market report of various segments Request Free Sample

        The Oil segment was valued at USD 151.30 million in 2018 and showed a gradual increase during the forecast period.
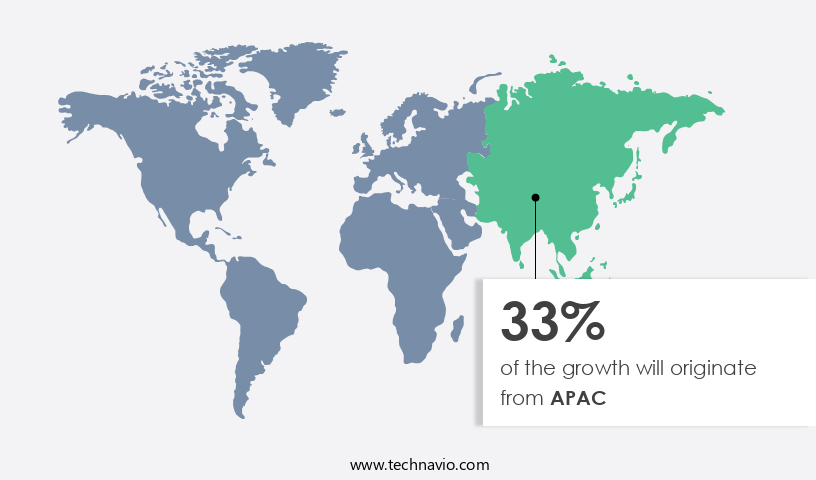
        Regional Analysis

        APAC is estimated to contribute 33% to the growth of the global market during the forecast period. Technavio’s analysts have elaborately explained the regional trends and drivers that shape the market during the forecast period.

        Oil and Chemical Spill Kits Market Share by Geography

        For more insights on the market size of various regions, Request Free Sample

        Oil and chemical spills pose significant risks to human health and the environment, particularly in North America where a substantial number of incidents occur each year. According to the Oil Spill Task Force, between 2002 and 2021, over 17,000 spills with a combined volume of 13.6 million gallons were reported on the US West Coast. In 2021 alone, there were 1,115 spills, including 36 crude oil spills, reported in this region. Oil leaks can originate from various sources, such as oil extraction, transportation, and emissions. Chemical spills can stem from the petrochemicals sector, transportation sector, or marine operations sector. To mitigate the impact of oil and chemical spills, it's crucial to have effective spill management solutions in place.

        Oil spill management tools include absorbent materials like sand, rags, kitty litter, solvents, mineral spirits, and acetone, as well as safety gear such as goggles, gloves, and respirators. Containment instruments like suits, pads, booms, pillows, granules, containment barriers, pumps, and neutralizing agents are also essential for spill prevention and cleanup. Innovative absorbents, IoT, and digital technologies are increasingly being integrated into spill control and cleanup solutions. Global sustainability goals emphasize the use of eco-friendly products, such as nanofibers, in spill prevention and response.


        Market Dynamics

        Our researchers analyzed the data with 2023 as the base year, along with the key drivers, trends, and challenges. A holistic analysis of drivers will help companies refine their marketing strategies to gain a competitive advantage.

        What are the key market drivers leading to the rise In the adoption of Oil and Chemical Spill Kits Industry?

        • Growth in trading activities is the key driver of the market.The global market for oil and chemical spill kits is witnessing significant growth due to the increasing demand for hydrocarbons and petroleum products in various industries, including oil extraction, shipping, and energy. The risk of oil leaks and chemical spills is a major concern for onshore and offshore operations, necessitating the use of effective oil spill management solutions. Chemical spill kits are essential for containing and cleaning up spills of hazardous substances, such as solvents, mineral spirits, acetone, and other chemicals. The energy industry, including oil and gas, natural gas, and electricity, is a major consumer of absorbent materials, sand, rags, kitty litter, and other containment instruments for spill prevention and control.

          The petrochemicals sector and transportation sector, particularly marine operations, are significant users of absorbents, containment barriers, pumps, neutralizing agents, and personal protective equipment, such as suits, pads, booms, pillows, and granules. The increasing focus on global sustainability goals and eco-friendly products is driving the demand for innovative absorbents and digital technologies, such as IoT and digital solutions, for spill control and cleanup. The maritime trade sector is also adopting advanced spill management technologies to minimize the environmental impact of spills in marine environments. Universal spill kits equipped with safety gear, including goggles, gloves, and respirators, are essential for ensuring the safety of personnel during spill response and cleanup operations.

          The market for oil and chemical spill kits is expected to grow further due to the increasing consumption of hydrocarbons and petroleum products and the need for effective spill prevention and control solutions.

        What are the market trends shaping the Oil and Chemical Spill Kits market?

        • Launch of mobile spill kits is the upcoming market trend.Oil and chemical spill kits play a crucial role in managing accidents involving hydrocarbons and petroleum products, including oil leaks and emissions from onshore and offshore oil extraction, shipping, and marine operations. These spill kits are essential for the energy industry, including oil and gas, natural gas, and electricity sectors, as they help contain and clean up spills of crude oil, fuel sources, and hazardous chemicals. Spill prevention is a key focus, with companies providing a range of absorbent materials such as sand, rags, kitty litter, and absorbent pads, booms, pillows, and granules. Containment barriers like suits, pads, and booms, as well as pumps and neutralizing agents, are also included.

          Personal protective equipment, such as goggles, gloves, and respirators, are provided for safety. companies offer UV-inhibited emergency spill kits for outdoor use and provide spill management solutions for maritime trade and transportation sectors. Innovative absorbents, IoT, and digital technologies are being integrated into spill control and cleanup solutions, aligning with global sustainability goals and promoting eco-friendly products.

        What challenges does the Oil and Chemical Spill Kits Industry face during its growth?

        • Volatility in raw materials is a key challenge affecting the industry growth.The market encompasses a range of products used for managing oil leaks and chemical spills. These kits include absorbent materials such as hydrocarbon pads and cushions, made from polypropylene and robust polyethylene (PE), as well as sand, rags, kitty litter, solvents like mineral spirits and acetone, safety gear including goggles, gloves, and respirators, and containment instruments such as suits, pads, booms, pillows, granules, containment barriers, pumps, and neutralizing agents. Raw material costs significantly impact the market, with fluctuations in prices of plastic polymers posing challenges for companies. For instance, the gap between global demand and supply of plastic polymers has resulted in decreased raw material prices, as evidenced by the decrease in crude oil prices in 2021 due to increased petroleum demand and easing pandemic-related restrictions.

          Absorbent materials are essential for spill management in various industries, including the energy sector, which relies heavily on oil and gas, natural gas, and crude oil as fuel sources for electricity generation. In addition, the petrochemicals sector and transportation sector, including marine operations, require spill prevention and cleanup supplies due to the potential hazards of hydrocarbons and hazardous chemicals. Innovative absorbents, IoT, and digital technologies are transforming spill control and cleanup solutions, offering eco-friendly and sustainable alternatives to traditional absorbents. Global sustainability goals, such as reducing environmental pollution, are driving the demand for eco-friendly products, including nanofibers, In the market.

          Keywords: hydrocarbons, petroleum products, oil leaks, oil spill management, chemical spill kits, onshore, offshore, oil extraction, shipping, emissions, absorbent materials, sand, rags, kitty litter, solvents, mineral spirits, acetone, safety gear, goggles, gloves, respirators, energy industry, oil and gas, natural gas, crude oil, fuel source, electricity, Hazardous chemicals, Environmental pollution, Absorbents, Containment instruments, Personal protective equipment, Cleanup supplies, Petrochemicals sector, Transportation sector, Marine operations sector, Suits, Pads, Booms, Pillows, Granules, Containment barriers, Pumps, Neutralizing agents, Spill prevention, Spill kit technologies, Global sustainability goals, Eco-friendly products, Hazardous materials, Nanofibers.

        Exclusive Customer Landscape

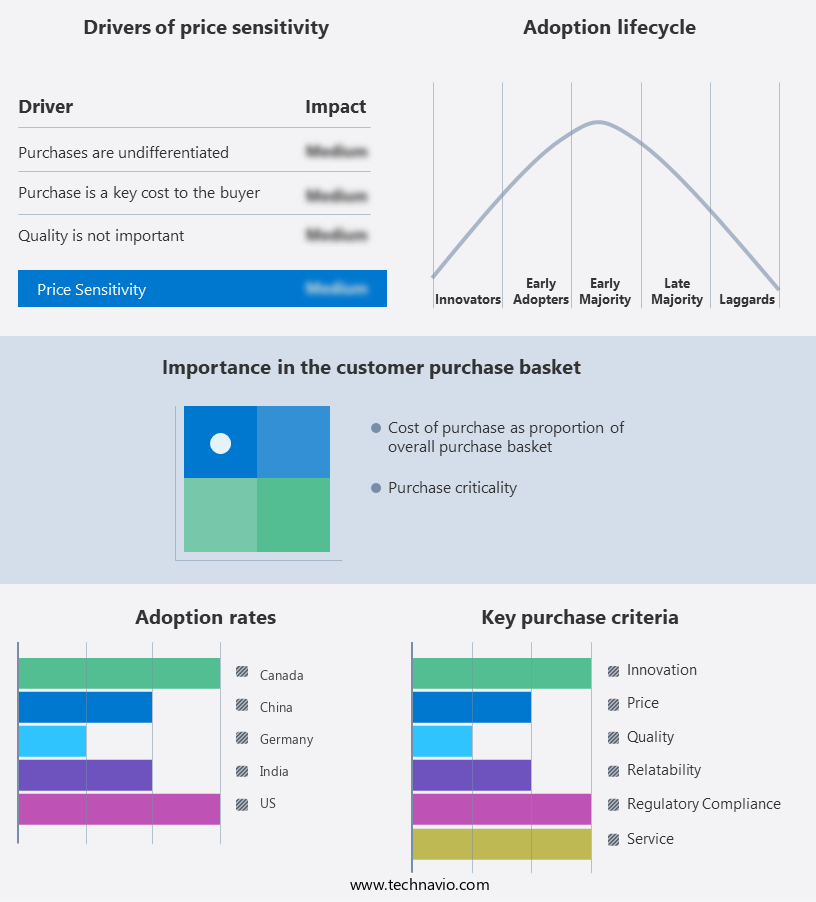
        The oil and chemical spill kits market forecasting report includes the adoption lifecycle of the market, covering from the innovator’s stage to the laggard’s stage. It focuses on adoption rates in different regions based on penetration. Furthermore, the oil and chemical spill kits market report also includes key purchase criteria and drivers of price sensitivity to help companies evaluate and develop their market growth analysis strategies.

        Oil and Chemical Spill Kits Market Share by Geography

         Customer Landscape

        Key Companies & Market Insights

        Companies are implementing various strategies, such as strategic alliances, oil and chemical spill kits market forecast, partnerships, mergers and acquisitions, geographical expansion, and product/service launches, to enhance their presence In the industry.

        3M Co. - The company provides a range of oil and chemical spill response solutions, including the 3M Chemical Sorbent Folded Spill Kit, 3M Petroleum Sorbent Spill Kit, and 3M Chemical Sorbent Spill Kit. These kits are essential for addressing various types of spills effectively and efficiently. The 3M offerings cater to diverse spill scenarios, ensuring that organizations are prepared for potential incidents. These kits are renowned for their high-performance absorbents, which effectively contain and neutralize spills, minimizing environmental impact and promoting safety.

        The industry research and growth report includes detailed analyses of the competitive landscape of the market and information about key companies, including:

        • 3M Co.
        • American Textile and Supply Inc.
        • Brady Corp.
        • Darcy Products Ltd.
        • ENPAC
        • Global Spill and Safety
        • New Pig Corp.
        • Oil Dri Corp. of America
        • Safetec
        • Super Safety Services
        • Supremex Equipments
        • TOBIT ENGINEERS
        • Usha Fire Safety Equipments pvt. Ltd.
        • Vizag Chemical International
        • Yellow Shield Ltd.
        • Enviroguard Solutions LLP
        •  Perth Petroleum Services
        • Spill Station Australia Pty Ltd.
        • THADHANI SAFETY and CO.
        • Unique Safety Services

        Qualitative and quantitative analysis of companies has been conducted to help clients understand the wider business environment as well as the strengths and weaknesses of key industry players. Data is qualitatively analyzed to categorize companies as pure play, category-focused, industry-focused, and diversified; it is quantitatively analyzed to categorize companies as dominant, leading, strong, tentative, and weak.

        Research Analyst Overview

        The hydrocarbons market encompasses the production, refining, and distribution of petroleum products, including crude oil, natural gas, and other fuel sources. With the increasing demand for energy and the expansion of the oil and gas industry, the risk of oil leaks and chemical spills has become a significant concern. Oil spill management has gained prominence as a crucial aspect of ensuring safety and minimizing environmental damage. Chemical spill kits have emerged as essential tools in managing oil and chemical spills, both onshore and offshore. These kits contain various absorbent materials designed to contain and absorb hydrocarbons and hazardous chemicals.

        The market for chemical spill kits is driven by the energy industry, including oil and gas extraction, natural gas production, and the petrochemicals sector. The transportation sector, particularly marine operations, is another significant contributor to the demand for oil spill management solutions. Shipping, in particular, poses a significant risk due to the large volumes of petroleum products transported daily. Spills can occur during loading and unloading operations, as well as during transportation. The importance of spill prevention and containment is further highlighted by the potential environmental consequences of oil and chemical spills. Environmental pollution from these incidents can have long-lasting effects on marine environments and human health.

        The global sustainability goals emphasize the need for eco-friendly products and technologies to mitigate the impact of spills. Chemical spill kits typically include absorbent materials such as sand, rags, kitty litter, solvents, mineral spirits, and acetone. Safety gear, including goggles, gloves, and respirators, is also an essential component of these kits. Containment instruments like suits, pads, booms, pillows, granules, and containment barriers are also commonly found in spill kits. Neutralizing agents, pumps, and spill prevention technologies are also critical components of spill management solutions. Innovative absorbents, such as nanofibers, and digital technologies like IoT and digital sensors, are increasingly being integrated into spill control and cleanup solutions to improve efficiency and response times.

        The market for chemical spill kits is expected to grow as the demand for energy continues to increase, and the need to minimize the environmental impact of spills becomes more pressing. The market is also driven by the increasing awareness of the potential health hazards associated with exposure to hazardous chemicals and the need for effective spill management solutions. In conclusion, the market for chemical spill kits is a critical component of the hydrocarbons industry, with applications In the energy sector, transportation sector, and marine operations sector. The demand for these kits is driven by the need to minimize the environmental impact of oil and chemical spills and ensure the safety of workers and the public.

        Innovative absorbents, digital technologies, and eco-friendly products are expected to play an increasingly significant role In the market.


        Market Scope

        Report Coverage

        Details

        Page number

        159

        Base year

        2023

        Historic period

        2018-2022

        Forecast period

        2024-2028

        Growth momentum & CAGR

        Accelerate at a CAGR of 4.61%

        Market growth 2024-2028

        USD 69.68 million

        Market structure

        Fragmented

        YoY growth 2023-2024(%)

        3.5

        Key countries

        US, Canada, China, India, and Germany

        Competitive landscape

        Leading Companies, Market Positioning of Companies, Competitive Strategies, and Industry Risks

        Request Free Sample

        What are the Key Data Covered in this Oil and Chemical Spill Kits Market Research and Growth Report?

        • CAGR of the Oil and Chemical Spill Kits industry during the forecast period
        • Detailed information on factors that will drive the growth and forecasting between 2024 and 2028
        • Precise estimation of the size of the market and its contribution of the industry in focus to the parent market
        • Accurate predictions about upcoming growth and trends and changes in consumer behaviour
        • Growth of the market across North America, APAC, Europe, South America, and Middle East and Africa
        • Thorough analysis of the market’s competitive landscape and detailed information about companies
        • Comprehensive analysis of factors that will challenge the oil and chemical spill kits market growth of industry companies

        We can help! Our analysts can customize this oil and chemical spill kits market research report to meet your requirements.

        Get in touch


        1 Executive Summary

        • 1.1 Market overview
          • Exhibit 01: Executive Summary – Chart on Market Overview
          • Exhibit 02: Executive Summary – Data Table on Market Overview
          • Exhibit 03: Executive Summary – Chart on Global Market Characteristics
          • Exhibit 04: Executive Summary – Chart on Market by Geography
          • Exhibit 05: Executive Summary – Chart on Market Segmentation by End-user
          • Exhibit 06: Executive Summary – Chart on Market Segmentation by Type
          • Exhibit 07: Executive Summary – Chart on Incremental Growth
          • Exhibit 08: Executive Summary – Data Table on Incremental Growth
          • Exhibit 09: Executive Summary – Chart on Vendor Market Positioning

        2 Market Landscape

        • 2.1 Market ecosystem
          • Exhibit 10: Parent market
          • Exhibit 11: Market Characteristics

        3 Market Sizing

        • 3.1 Market definition
          • Exhibit 12: Offerings of vendors included in the market definition
        • 3.2 Market segment analysis
          • Exhibit 13: Market segments
        • 3.3 Market size 2023
          • 3.4 Market outlook: Forecast for 2023-2028
            • Exhibit 14: Chart on Global - Market size and forecast 2023-2028 ($ million)
            • Exhibit 15: Data Table on Global - Market size and forecast 2023-2028 ($ million)
            • Exhibit 16: Chart on Global Market: Year-over-year growth 2023-2028 (%)
            • Exhibit 17: Data Table on Global Market: Year-over-year growth 2023-2028 (%)

          4 Historic Market Size

          • 4.1 Global oil and chemical spill kits market 2018 - 2022
            • Exhibit 18: Historic Market Size – Data Table on global oil and chemical spill kits market 2018 - 2022 ($ million)
          • 4.2 End-user Segment Analysis 2018 - 2022
            • Exhibit 19: Historic Market Size – End-user Segment 2018 - 2022 ($ million)
          • 4.3 Type Segment Analysis 2018 - 2022
            • Exhibit 20: Historic Market Size – Type Segment 2018 - 2022 ($ million)
          • 4.4 Geography Segment Analysis 2018 - 2022
            • Exhibit 21: Historic Market Size – Geography Segment 2018 - 2022 ($ million)
          • 4.5 Country Segment Analysis 2018 - 2022
            • Exhibit 22: Historic Market Size – Country Segment 2018 - 2022 ($ million)

          5 Five Forces Analysis

          • 5.1 Five forces summary
            • Exhibit 23: Five forces analysis - Comparison between 2023 and 2028
          • 5.2 Bargaining power of buyers
            • Exhibit 24: Chart on Bargaining power of buyers – Impact of key factors 2023 and 2028
          • 5.3 Bargaining power of suppliers
            • Exhibit 25: Bargaining power of suppliers – Impact of key factors in 2023 and 2028
          • 5.4 Threat of new entrants
            • Exhibit 26: Threat of new entrants – Impact of key factors in 2023 and 2028
          • 5.5 Threat of substitutes
            • Exhibit 27: Threat of substitutes – Impact of key factors in 2023 and 2028
          • 5.6 Threat of rivalry
            • Exhibit 28: Threat of rivalry – Impact of key factors in 2023 and 2028
          • 5.7 Market condition
            • Exhibit 29: Chart on Market condition - Five forces 2023 and 2028

          6 Market Segmentation by End-user

          • 6.1 Market segments
            • Exhibit 30: Chart on End-user - Market share 2023-2028 (%)
            • Exhibit 31: Data Table on End-user - Market share 2023-2028 (%)
          • 6.2 Comparison by End-user
            • Exhibit 32: Chart on Comparison by End-user
            • Exhibit 33: Data Table on Comparison by End-user
          • 6.3 Oil - Market size and forecast 2023-2028
            • Exhibit 34: Chart on Oil - Market size and forecast 2023-2028 ($ million)
            • Exhibit 35: Data Table on Oil - Market size and forecast 2023-2028 ($ million)
            • Exhibit 36: Chart on Oil - Year-over-year growth 2023-2028 (%)
            • Exhibit 37: Data Table on Oil - Year-over-year growth 2023-2028 (%)
          • 6.4 Chemical - Market size and forecast 2023-2028
            • Exhibit 38: Chart on Chemical - Market size and forecast 2023-2028 ($ million)
            • Exhibit 39: Data Table on Chemical - Market size and forecast 2023-2028 ($ million)
            • Exhibit 40: Chart on Chemical - Year-over-year growth 2023-2028 (%)
            • Exhibit 41: Data Table on Chemical - Year-over-year growth 2023-2028 (%)
          • 6.5 Market opportunity by End-user
            • Exhibit 42: Market opportunity by End-user ($ million)
            • Exhibit 43: Data Table on Market opportunity by End-user ($ million)

          7 Market Segmentation by Type

          • 7.1 Market segments
            • Exhibit 44: Chart on Type - Market share 2023-2028 (%)
            • Exhibit 45: Data Table on Type - Market share 2023-2028 (%)
          • 7.2 Comparison by Type
            • Exhibit 46: Chart on Comparison by Type
            • Exhibit 47: Data Table on Comparison by Type
          • 7.3 Blood spill kit - Market size and forecast 2023-2028
            • Exhibit 48: Chart on Blood spill kit - Market size and forecast 2023-2028 ($ million)
            • Exhibit 49: Data Table on Blood spill kit - Market size and forecast 2023-2028 ($ million)
            • Exhibit 50: Chart on Blood spill kit - Year-over-year growth 2023-2028 (%)
            • Exhibit 51: Data Table on Blood spill kit - Year-over-year growth 2023-2028 (%)
          • 7.4 Universal absorbent pads - Market size and forecast 2023-2028
            • Exhibit 52: Chart on Universal absorbent pads - Market size and forecast 2023-2028 ($ million)
            • Exhibit 53: Data Table on Universal absorbent pads - Market size and forecast 2023-2028 ($ million)
            • Exhibit 54: Chart on Universal absorbent pads - Year-over-year growth 2023-2028 (%)
            • Exhibit 55: Data Table on Universal absorbent pads - Year-over-year growth 2023-2028 (%)
          • 7.5 Market opportunity by Type
            • Exhibit 56: Market opportunity by Type ($ million)
            • Exhibit 57: Data Table on Market opportunity by Type ($ million)

          8 Customer Landscape

          • 8.1 Customer landscape overview
            • Exhibit 58: Analysis of price sensitivity, lifecycle, customer purchase basket, adoption rates, and purchase criteria

          9 Geographic Landscape

          • 9.1 Geographic segmentation
            • Exhibit 59: Chart on Market share by geography 2023-2028 (%)
            • Exhibit 60: Data Table on Market share by geography 2023-2028 (%)
          • 9.2 Geographic comparison
            • Exhibit 61: Chart on Geographic comparison
            • Exhibit 62: Data Table on Geographic comparison
          • 9.3 North America - Market size and forecast 2023-2028
            • Exhibit 63: Chart on North America - Market size and forecast 2023-2028 ($ million)
            • Exhibit 64: Data Table on North America - Market size and forecast 2023-2028 ($ million)
            • Exhibit 65: Chart on North America - Year-over-year growth 2023-2028 (%)
            • Exhibit 66: Data Table on North America - Year-over-year growth 2023-2028 (%)
          • 9.4 APAC - Market size and forecast 2023-2028
            • Exhibit 67: Chart on APAC - Market size and forecast 2023-2028 ($ million)
            • Exhibit 68: Data Table on APAC - Market size and forecast 2023-2028 ($ million)
            • Exhibit 69: Chart on APAC - Year-over-year growth 2023-2028 (%)
            • Exhibit 70: Data Table on APAC - Year-over-year growth 2023-2028 (%)
          • 9.5 Europe - Market size and forecast 2023-2028
            • Exhibit 71: Chart on Europe - Market size and forecast 2023-2028 ($ million)
            • Exhibit 72: Data Table on Europe - Market size and forecast 2023-2028 ($ million)
            • Exhibit 73: Chart on Europe - Year-over-year growth 2023-2028 (%)
            • Exhibit 74: Data Table on Europe - Year-over-year growth 2023-2028 (%)
          • 9.6 South America - Market size and forecast 2023-2028
            • Exhibit 75: Chart on South America - Market size and forecast 2023-2028 ($ million)
            • Exhibit 76: Data Table on South America - Market size and forecast 2023-2028 ($ million)
            • Exhibit 77: Chart on South America - Year-over-year growth 2023-2028 (%)
            • Exhibit 78: Data Table on South America - Year-over-year growth 2023-2028 (%)
          • 9.7 Middle East and Africa - Market size and forecast 2023-2028
            • Exhibit 79: Chart on Middle East and Africa - Market size and forecast 2023-2028 ($ million)
            • Exhibit 80: Data Table on Middle East and Africa - Market size and forecast 2023-2028 ($ million)
            • Exhibit 81: Chart on Middle East and Africa - Year-over-year growth 2023-2028 (%)
            • Exhibit 82: Data Table on Middle East and Africa - Year-over-year growth 2023-2028 (%)
          • 9.8 US - Market size and forecast 2023-2028
            • Exhibit 83: Chart on US - Market size and forecast 2023-2028 ($ million)
            • Exhibit 84: Data Table on US - Market size and forecast 2023-2028 ($ million)
            • Exhibit 85: Chart on US - Year-over-year growth 2023-2028 (%)
            • Exhibit 86: Data Table on US - Year-over-year growth 2023-2028 (%)
          • 9.9 China - Market size and forecast 2023-2028
            • Exhibit 87: Chart on China - Market size and forecast 2023-2028 ($ million)
            • Exhibit 88: Data Table on China - Market size and forecast 2023-2028 ($ million)
            • Exhibit 89: Chart on China - Year-over-year growth 2023-2028 (%)
            • Exhibit 90: Data Table on China - Year-over-year growth 2023-2028 (%)
          • 9.10 India - Market size and forecast 2023-2028
            • Exhibit 91: Chart on India - Market size and forecast 2023-2028 ($ million)
            • Exhibit 92: Data Table on India - Market size and forecast 2023-2028 ($ million)
            • Exhibit 93: Chart on India - Year-over-year growth 2023-2028 (%)
            • Exhibit 94: Data Table on India - Year-over-year growth 2023-2028 (%)
          • 9.11 Germany - Market size and forecast 2023-2028
            • Exhibit 95: Chart on Germany - Market size and forecast 2023-2028 ($ million)
            • Exhibit 96: Data Table on Germany - Market size and forecast 2023-2028 ($ million)
            • Exhibit 97: Chart on Germany - Year-over-year growth 2023-2028 (%)
            • Exhibit 98: Data Table on Germany - Year-over-year growth 2023-2028 (%)
          • 9.12 Canada - Market size and forecast 2023-2028
            • Exhibit 99: Chart on Canada - Market size and forecast 2023-2028 ($ million)
            • Exhibit 100: Data Table on Canada - Market size and forecast 2023-2028 ($ million)
            • Exhibit 101: Chart on Canada - Year-over-year growth 2023-2028 (%)
            • Exhibit 102: Data Table on Canada - Year-over-year growth 2023-2028 (%)
          • 9.13 Market opportunity by geography
            • Exhibit 103: Market opportunity by geography ($ million)
            • Exhibit 104: Data Tables on Market opportunity by geography ($ million)

          10 Drivers, Challenges, and Trends

          • 10.1 Market drivers
            • 10.2 Market challenges
              • 10.3 Impact of drivers and challenges
                • Exhibit 105: Impact of drivers and challenges in 2023 and 2028
              • 10.4 Market trends

                11 Vendor Landscape

                • 11.1 Overview
                  • 11.2 Vendor landscape
                    • Exhibit 106: Overview on Criticality of inputs and Factors of differentiation
                  • 11.3 Landscape disruption
                    • Exhibit 107: Overview on factors of disruption
                  • 11.4 Industry risks
                    • Exhibit 108: Impact of key risks on business

                  12 Vendor Analysis

                  • 12.1 Vendors covered
                    • Exhibit 109: Vendors covered
                  • 12.2 Market positioning of vendors
                    • Exhibit 110: Matrix on vendor position and classification
                  • 12.3 3M Co.
                    • Exhibit 111: 3M Co. - Overview
                    • Exhibit 112: 3M Co. - Business segments
                    • Exhibit 113: 3M Co. - Key news
                    • Exhibit 114: 3M Co. - Key offerings
                    • Exhibit 115: 3M Co. - Segment focus
                  • 12.4 American Textile and Supply Inc.
                    • Exhibit 116: American Textile and Supply Inc. - Overview
                    • Exhibit 117: American Textile and Supply Inc. - Product / Service
                    • Exhibit 118: American Textile and Supply Inc. - Key offerings
                  • 12.5 Brady Corp.
                    • Exhibit 119: Brady Corp. - Overview
                    • Exhibit 120: Brady Corp. - Business segments
                    • Exhibit 121: Brady Corp. - Key news
                    • Exhibit 122: Brady Corp. - Key offerings
                    • Exhibit 123: Brady Corp. - Segment focus
                  • 12.6 Darcy Products Ltd.
                    • Exhibit 124: Darcy Products Ltd. - Overview
                    • Exhibit 125: Darcy Products Ltd. - Product / Service
                    • Exhibit 126: Darcy Products Ltd. - Key offerings
                  • 12.7 ENPAC
                    • Exhibit 127: ENPAC - Overview
                    • Exhibit 128: ENPAC - Product / Service
                    • Exhibit 129: ENPAC - Key offerings
                  • 12.8 Global Spill and Safety
                    • Exhibit 130: Global Spill and Safety - Overview
                    • Exhibit 131: Global Spill and Safety - Product / Service
                    • Exhibit 132: Global Spill and Safety - Key offerings
                  • 12.9 New Pig Corp.
                    • Exhibit 133: New Pig Corp. - Overview
                    • Exhibit 134: New Pig Corp. - Product / Service
                    • Exhibit 135: New Pig Corp. - Key offerings
                  • 12.10 Oil Dri Corp. of America
                    • Exhibit 136: Oil Dri Corp. of America - Overview
                    • Exhibit 137: Oil Dri Corp. of America - Business segments
                    • Exhibit 138: Oil Dri Corp. of America - Key offerings
                    • Exhibit 139: Oil Dri Corp. of America - Segment focus
                  • 12.11 Safetec
                    • Exhibit 140: Safetec - Overview
                    • Exhibit 141: Safetec - Product / Service
                    • Exhibit 142: Safetec - Key offerings
                  • 12.12 Super Safety Services
                    • Exhibit 143: Super Safety Services - Overview
                    • Exhibit 144: Super Safety Services - Product / Service
                    • Exhibit 145: Super Safety Services - Key offerings
                  • 12.13 Supremex Equipments
                    • Exhibit 146: Supremex Equipments - Overview
                    • Exhibit 147: Supremex Equipments - Product / Service
                    • Exhibit 148: Supremex Equipments - Key offerings
                  • 12.14 TOBIT ENGINEERS
                    • Exhibit 149: TOBIT ENGINEERS - Overview
                    • Exhibit 150: TOBIT ENGINEERS - Product / Service
                    • Exhibit 151: TOBIT ENGINEERS - Key offerings
                  • 12.15 Usha Fire Safety Equipments pvt. Ltd.
                    • Exhibit 152: Usha Fire Safety Equipments pvt. Ltd. - Overview
                    • Exhibit 153: Usha Fire Safety Equipments pvt. Ltd. - Product / Service
                    • Exhibit 154: Usha Fire Safety Equipments pvt. Ltd. - Key offerings
                  • 12.16 Vizag Chemical International
                    • Exhibit 155: Vizag Chemical International - Overview
                    • Exhibit 156: Vizag Chemical International - Product / Service
                    • Exhibit 157: Vizag Chemical International - Key offerings
                  • 12.17 Yellow Shield Ltd.
                    • Exhibit 158: Yellow Shield Ltd. - Overview
                    • Exhibit 159: Yellow Shield Ltd. - Product / Service
                    • Exhibit 160: Yellow Shield Ltd. - Key offerings

                  13 Appendix

                  • 13.1 Scope of the report
                    • 13.2 Inclusions and exclusions checklist
                      • Exhibit 161: Inclusions checklist
                      • Exhibit 162: Exclusions checklist
                    • 13.3 Currency conversion rates for US$
                      • Exhibit 163: Currency conversion rates for US$
                    • 13.4 Research methodology
                      • Exhibit 164: Research methodology
                      • Exhibit 165: Validation techniques employed for market sizing
                      • Exhibit 166: Information sources
                    • 13.5 List of abbreviations
                      • Exhibit 167: List of abbreviations

                    Research Methodology

                    Technavio presents a detailed picture of the market by way of study, synthesis, and summation of data from multiple sources. The analysts have presented the various facets of the market with a particular focus on identifying the key industry influencers. The data thus presented is comprehensive, reliable, and the result of extensive research, both primary and secondary.

                    INFORMATION SOURCES

                    Primary sources

                    • Manufacturers and suppliers
                    • Channel partners
                    • Industry experts
                    • Strategic decision makers

                    Secondary sources

                    • Industry journals and periodicals
                    • Government data
                    • Financial reports of key industry players
                    • Historical data
                    • Press releases

                    DATA ANALYSIS

                    Data Synthesis

                    • Collation of data
                    • Estimation of key figures
                    • Analysis of derived insights

                    Data Validation

                    • Triangulation with data models
                    • Reference against proprietary databases
                    • Corroboration with industry experts

                    REPORT WRITING

                    Qualitative

                    • Market drivers
                    • Market challenges
                    • Market trends
                    • Five forces analysis

                    Quantitative

                    • Market size and forecast
                    • Market segmentation
                    • Geographical insights
                    • Competitive landscape

                    Interested in this report?

                    Get your sample now to see our research methodology and insights!

                    Download Now

                    Frequently Asked Questions

                    Oil and Chemical Spill Kits market growth will increase by $ 69.68 mn during 2024-2028 .

                    The Oil and Chemical Spill Kits market is expected to grow at a CAGR of 4.61% during 2024-2028 .

                    Oil and Chemical Spill Kits market is segmented by End-user( Oil, Chemical) Type( Blood spill kit, Universal absorbent pads, Europe, South America, Middle East and Africa)

                    3M Co., American Textile and Supply Inc., Brady Corp., Darcy Products Ltd., ENPAC, Global Spill and Safety, New Pig Corp., Oil Dri Corp. of America, Safetec, Super Safety Services, Supremex Equipments, TOBIT ENGINEERS, Usha Fire Safety Equipments pvt. Ltd., Vizag Chemical International, Yellow Shield Ltd., Enviroguard Solutions LLP,  Perth Petroleum Services, Spill Station Australia Pty Ltd., THADHANI SAFETY and CO., Unique Safety Services are a few of the key vendors in the Oil and Chemical Spill Kits market.

                    APAC will register the highest growth rate of 33% among the other regions. Therefore, the Oil and Chemical Spill Kits market in APAC is expected to garner significant business opportunities for the vendors during the forecast period.

                    US, Canada, China, India, Germany

                    • Growth in trading activitiesThe global demand for chemicals is the driving factor this market.
                    • specifically specialty chemicals and petrochemicals is the driving factor this market.
                    • has increased rapidly in the past few years and is mainly driven by the high consumption of the same in developing economies such as India and China. It is important for countries to have adequate storage facilities to stock these chemical raw materials to meet the rising demand from end-user industries. APAC is one of the leading geographies in terms of the production and consumption of chemical products due to the strong presence of chemical manufacturers and end-user industries in the region. The rising consumer purchasing power in APAC will translate into higher affordability is the driving factor this market.
                    • which will drive the demand for chemicals in the region during the forecast period. The EU has strong trade tie-ups with the US and Switzerland for the import and export of chemical products as they are the largest trade partners of the EU-28. Organic chemicals is the driving factor this market.
                    • chemicals for medical and pharmaceutical products is the driving factor this market.
                    • and plastics in primary and non-primary forms were some key traded products in the EU in 2021. A rapid increase in the global production and consumption of chemicals has positively influenced the international chemical trade. Chemicals are produced in different geographies across the world as per the availability of raw materials and labor. Therefore is the driving factor this market.
                    • nowadays is the driving factor this market.
                    • the prices of chemicals are normally established based on global supply and demand. An increase in the international trade of chemicals has intensified the competition in the market. Thus is the driving factor this market.
                    • chemical manufacturers are focusing on supplying their products regionally and globally. Basic chemicals and specialty chemicals are among the highly traded chemical products is the driving factor this market.
                    • and they cover nearly 75%-85% of the global chemical trade. The trade war between the US and China had a positive impact on the number of chemical products being exported to China is the driving factor this market.
                    • especially for the companies operating in the developing regions of the country. This enabled various chemical distributors to globalize their service portfolio and gain a strong presence in China. China has been one of the biggest consumers of chemical products is the driving factor this market.
                    • which has increased the demand for chemical warehouses in the country. An increase in trading activities is the driving factor this market.
                    • especially oil and chemical trading activities is the driving factor this market.
                    • will lead to more oil and chemical spills is the driving factor this market.
                    • which will further enhance the demand for oil and chemical spill kits. Therefore is the driving factor this market.
                    • the resumption of trading activities is expected to increase the demand for oil and chemical spill kits and drive the growth of the global oil and chemical spill kits market during the forecast period. is the driving factor this market.

                    The Oil and Chemical Spill Kits market vendors should focus on grabbing business opportunities from the Oil segment as it accounted for the largest market share in the base year.