Oil Quality Sensors Market Size 2025-2029
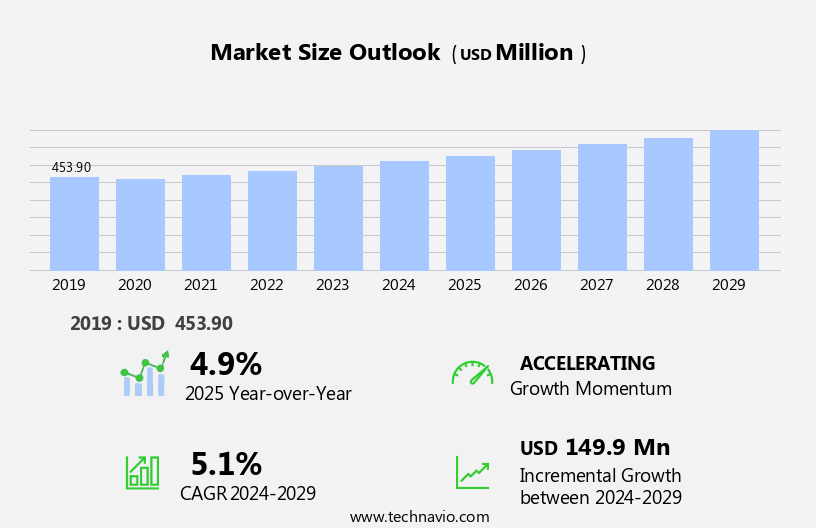
The oil quality sensors market size is forecast to increase by USD 149.9 million, at a CAGR of 5.1% between 2024 and 2029.
- The market is experiencing significant growth due to several key trends. The increasing demand for predictive maintenance in various industries is driving the market, as oil sensors enable early detection of potential issues, reducing downtime and maintenance costs. Additionally, the introduction of new oil sensor technologies is expanding the market's scope, offering advanced features such as real-time monitoring and remote diagnostics. However, data security and privacy concerns remain a challenge for market growth. As industries adopt digital transformation, ensuring the security of sensitive data transmitted through oil sensors is crucial to prevent cyber-attacks and data breaches. Overall, the market is poised for steady growth, driven by technological advancements and the need for efficient and reliable maintenance solutions.
What will be the Size of the Oil Quality Sensors Market During the Forecast Period?
- The market is experiencing significant growth due to the increasing importance of machinery lifespan optimization and remote asset monitoring in various industries. Industrial automation and digital transformation are driving the adoption of advanced sensor technology for machine health monitoring and oil quality analysis. This enables condition-based maintenance, optimization of equipment performance, and cost reduction through early detection of potential issues. Remote monitoring of machinery and equipment health, including vibration analysis and lubricant analysis, is becoming a crucial aspect of asset planning and scheduling in industries such as renewable energy, logistics and distribution, and manufacturing.
- The integration of digital twin technology and machine learning algorithms into asset software enables predictive maintenance and energy securitization, further enhancing the value proposition of oil quality sensors. The market's expansion is also influenced by the increasing focus on machinery reliability, cost optimization, and regulatory affairs in the context of the energy transition and sustainable development. Commodity markets and industrial data analytics are also key factors influencing the market's direction.
How is this Oil Quality Sensors Industry segmented and which is the largest segment?
The oil quality sensors industry research report provides comprehensive data (region-wise segment analysis), with forecasts and estimates in "USD million" for the period 2025-2029, as well as historical data from 2019-2023 for the following segments.
- Type
- Temperature sensors
- Viscosity sensors
- Wear debris sensors
- Moisture sensors
- Others
- Application
- Automotive
- Industrial equipment
- Power generation
- Marine industry
- Mining and agriculture
- Geography
- North America
- Canada
- US
- Europe
- Germany
- UK
- France
- Italy
- APAC
- China
- India
- Japan
- South Korea
- Middle East and Africa
- South America
- North America
By Type Insights
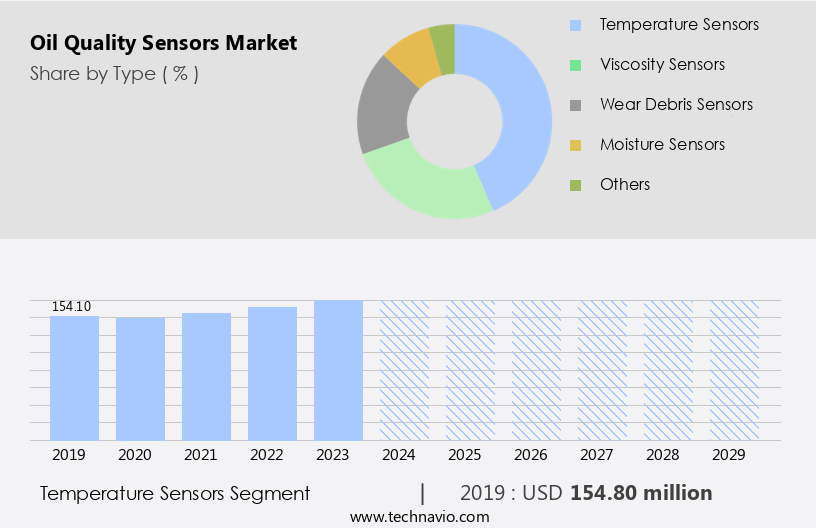
- The temperature sensors segment is estimated to witness significant growth during the forecast period.
Temperature sensors are a crucial component in the market, responsible for real-time monitoring of oil temperature. These sensors ensure optimal performance by preventing overheating or excessive cooling, which can negatively impact machinery and engine efficiency and longevity. By providing accurate and timely oil temperature readings, temperature sensors enable the maintenance of the correct oil viscosity and lubrication efficiency. Proper lubrication reduces friction and wear, enhancing machinery and engine performance and lifespan.
IoT and cloud-based platforms facilitate remote monitoring and data analytics, allowing for early detection of potential issues and minimizing unplanned downtime. Applications span various industries, including industrial machinery, energy, automotive, marine, and chemical products, among others. Temperature sensors contribute to sustainability efforts by optimizing fuel usage and reducing operational costs. Wear debris analysis and electrical monitoring are additional vital parameters for oil condition monitoring, ensuring equipment reliability and safety.
Get a glance at the market report of the share of various segments Request Free Sample
The temperature sensors segment was valued at USD 154.80 million in 2019 and showed a gradual increase during the forecast period.
Regional Analysis
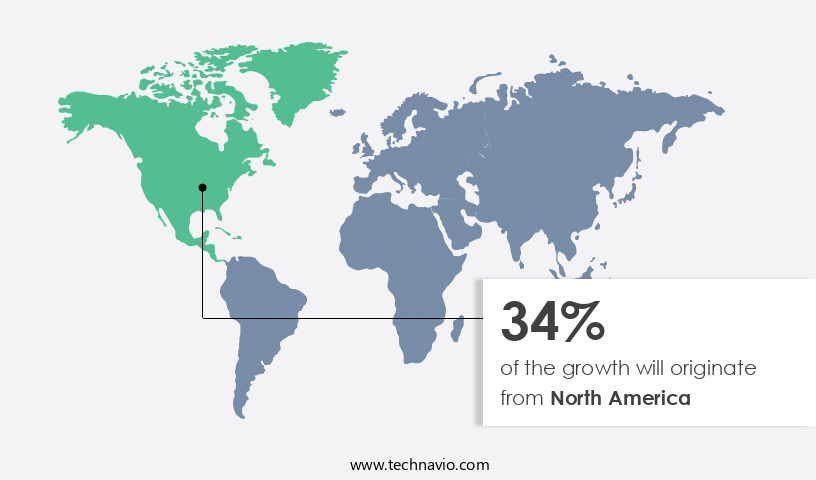
- North America is estimated to contribute 34% to the growth of the global market during the forecast period.
Technavio’s analysts have elaborately explained the regional trends and drivers that shape the market during the forecast period.
For more insights on the market size of various regions, Request Free Sample
The North American market is driven by increasing regulatory compliance requirements, particularly In the industrial and automotive sectors. The Environmental Protection Agency (EPA) in the U.S. Enforces stringent regulations on emissions and waste oil disposal, leading industries to invest in advanced oil condition monitoring systems. These systems enable real-time monitoring of vital parameters such as wear debris analysis, electrical monitoring, and oil condition monitoring, reducing unplanned downtime and enhancing equipment reliability. The Internet of Things (IoT) and cloud-based platforms are integral to these systems, allowing for remote monitoring and data analytics.
The market caters to various applications, including fuel oils, diesel oil, natural gas, liquefied petroleum gas, asphalt, refining, petrochemicals, plastics, and rail. The market's growth is further fueled by the need for operational cost savings, sustainability, and safety in industries such as marine applications, refineries, and chemical products. Oil analysis techniques like spectroscopy play a crucial role in ensuring operational efficiency and regulatory compliance.
Market Dynamics
Our researchers analyzed the data with 2024 as the base year, along with the key drivers, trends, and challenges. A holistic analysis of drivers will help companies refine their marketing strategies to gain a competitive advantage.
What are the key market drivers leading to the rise in the adoption of the Oil Quality Sensors Industry?
Increasing demand for predictive maintenance is the key driver of the market.
- The market is experiencing significant growth due to the increasing adoption of predictive maintenance strategies in various industries. Predictive maintenance, which utilizes real-time data and analytics to assess machinery conditions and anticipate potential failures, offers substantial benefits such as reduced unplanned downtime, lower maintenance costs, and extended equipment lifespan. Oil quality sensors play a vital role in predictive maintenance by continuously monitoring key parameters like viscosity, temperature, oxidation, and contamination levels in lubricating oils. These sensors enable operators to schedule maintenance only when necessary, rather than following fixed intervals. Early detection of oil degradation or contamination allows for timely intervention, preventing costly repairs and ensuring equipment reliability.
- The Internet of Things (IoT) and cloud-based platforms facilitate the implementation of predictive maintenance strategies by providing remote monitoring capabilities and real-time data access. Oil quality sensors are not only crucial for industrial machinery but also for the automotive sector, marine applications, and the downstream processing of energy sources like natural gas, fuel oils, diesel oil, LPG, asphalt, and chemical products. Applications in industries like petrochemicals, plastics, refining, and pharmaceuticals further expand the market's scope.
What are the market trends shaping the Oil Quality Sensors Industry?
Introduction of new products is the upcoming market trend.
- The market is experiencing growth due to the integration of IoT and cloud-based platforms in industrial machinery. This innovation enables real-time monitoring of vital parameters such as oil condition, electrical, and fluid for industries like oil and gas, hydrogen, and power generation. These sensors, including the XMTCpro, cater to gas, flow, and moisture measurement in harsh environments. The XMTCpro offers accurate and reliable gas concentration monitoring in hydrogen applications, featuring real-time error detection and minimal maintenance requirements. IoT-enabled oil quality monitoring plays a crucial role in preventing unplanned downtime, ensuring equipment reliability, and maintaining operational costs.
- Data analytics from these sensors allows for wear debris analysis, fuel oils monitoring, and chemical product quality control in industries like automotive, marine applications, refinery, LPG, asphalt, downstream, petrochemicals, plastics, refining, man and machines, rail, pharmaceuticals, and transportation. Spectroscopy, simulations, and wholesale marketing are additional applications of these sensors, contributing to the market's growth. The market encompasses a wide range of applications, from fuel oils and diesel oil to natural gas and purifying processes.
What challenges does the Oil Quality Sensors Industry face during its growth?
Data security and privacy concerns are key challenges affecting the industry growth.
- The market is experiencing significant growth due to the increasing adoption of IoT and cloud-based platforms for real-time monitoring and data analytics in various industries. However, the integration of these advanced technologies comes with challenges, particularly in the area of data security and privacy. Unauthorized access and cyber threats pose substantial risks to industries, as demonstrated by the August 2024 ransomware attack on Halliburton, resulting in a financial loss of USD 35 million.
- To mitigate these risks, companies are implementing strong security measures and regulatory compliance frameworks. Oil quality monitoring through spectroscopy and other advanced techniques enables the analysis of vital parameters, including wear debris analysis, electrical monitoring, and fuel oil quality, to prevent unplanned downtime and ensure sustainability in various applications such as refining, rail, pharmaceuticals, and liquefied petroleum gas. Operational costs are reduced through remote monitoring and simulations, while safety is enhanced through real-time monitoring and timely intervention.
Exclusive Customer Landscape
The oil quality sensors market forecasting report includes the adoption lifecycle of the market, covering from the innovator’s stage to the laggard’s stage. It focuses on adoption rates in different regions based on penetration. Furthermore, the oil quality sensors market report also includes key purchase criteria and drivers of price sensitivity to help companies evaluate and develop their market growth analysis strategies.

Customer Landscape
Key Companies & Market Insights
Companies are implementing various strategies, such as strategic alliances, oil quality sensors market forecast, partnerships, mergers and acquisitions, geographical expansion, and product/service launches, to enhance their presence in the industry.
Des-Case - The company offers oil quality sensors such as Des-Case OQS 2, which a plug and play data interface that fits into existing display and monitoring systems.
The industry research and growth report includes detailed analyses of the competitive landscape of the market and information about key companies, including:
- HYDAC International GmbH
- ifm electronic gmbh
- LOSI Getriebe-Steuerungen-Hydraulik GmbH
- Parker Hannifin Corp.
- Poseidon Systems
- Rivertrace
- Tan Delta Systems PLC
- TE Connectivity Ltd.
- Yateks
Qualitative and quantitative analysis of companies has been conducted to help clients understand the wider business environment as well as the strengths and weaknesses of key industry players. Data is qualitatively analyzed to categorize companies as pure play, category-focused, industry-focused, and diversified; it is quantitatively analyzed to categorize companies as dominant, leading, strong, tentative, and weak.
Research Analyst Overview
The market encompasses a range of advanced technologies designed to monitor and analyze the condition of various types of oils used in industrial applications. These sensors play a crucial role in ensuring the optimal performance and reliability of industrial machinery, as well as maintaining regulatory compliance and reducing operational costs. IoT and cloud-based platforms have revolutionized oil quality monitoring, enabling real-time analysis and data analytics. By continuously monitoring vital parameters such as wear debris analysis, electrical monitoring, and oil condition monitoring, these systems enable early detection of potential issues, reducing the risk of unplanned downtime and enhancing equipment reliability.
Further, oil quality sensors are essential in various industries, including automotive, marine, refining, petrochemicals, plastics, pharmaceuticals, rail, and energy. In the automotive sector, sensors help ensure the proper functioning of engines and transmission systems, while in the marine application, they are used to monitor fuel oils, diesel oil, and LPG. In the refinery, these sensors play a critical role in purifying crude oil and ensuring the quality of finished products. The use of oil quality sensors is not limited to industrial applications alone. They are also used in downstream processes such as natural gas and liquefied petroleum gas production, as well as In the production of chemical products, fertilizers, and asphalt.
In addition, the adoption of oil quality sensors is driven by several factors, including the need for operational efficiency, cost savings, and regulatory compliance. By providing real-time monitoring and data analytics, these sensors enable predictive maintenance, reducing the need for costly repairs and replacements. They also help ensure the sustainability of industrial processes by minimizing waste and optimizing energy usage. Several sensor technologies are used in oil quality monitoring, including spectroscopy, which provides detailed information about the chemical composition of the oil. These sensors help detect impurities and contaminants, ensuring the oil remains within the desired specifications. The integration of oil quality sensors with IoT and cloud-based platforms enables remote monitoring and data analysis, reducing the need for on-site inspections and maintenance.
|
Market Scope |
|
|
Report Coverage |
Details |
|
Page number |
206 |
|
Base year |
2024 |
|
Historic period |
2019-2023 |
|
Forecast period |
2025-2029 |
|
Growth momentum & CAGR |
Accelerate at a CAGR of 5.1% |
|
Market growth 2025-2029 |
USD 149.9 million |
|
Market structure |
Concentrated |
|
YoY growth 2024-2025(%) |
4.9 |
|
Key countries |
US, China, Germany, India, UK, Canada, Japan, France, South Korea, and Italy |
|
Competitive landscape |
Leading Companies, Market Positioning of Companies, Competitive Strategies, and Industry Risks |
What are the Key Data Covered in this Oil Quality Sensors Market Research and Growth Report?
- CAGR of the Oil Quality Sensors industry during the forecast period
- Detailed information on factors that will drive the market growth and forecasting between 2025 and 2029
- Precise estimation of the size of the market and its contribution of the industry in focus to the parent market
- Accurate predictions about upcoming growth and trends and changes in consumer behaviour
- Growth of the market across North America, Europe, APAC, Middle East and Africa, and South America
- Thorough analysis of the market’s competitive landscape and detailed information about companies
- Comprehensive analysis of factors that will challenge the oil quality sensors market growth of industry companies
We can help! Our analysts can customize this oil quality sensors market research report to meet your requirements.
 RIA -
RIA - 
