Oilfield Surfactants Market Size and Growth Forecast 2026-2030
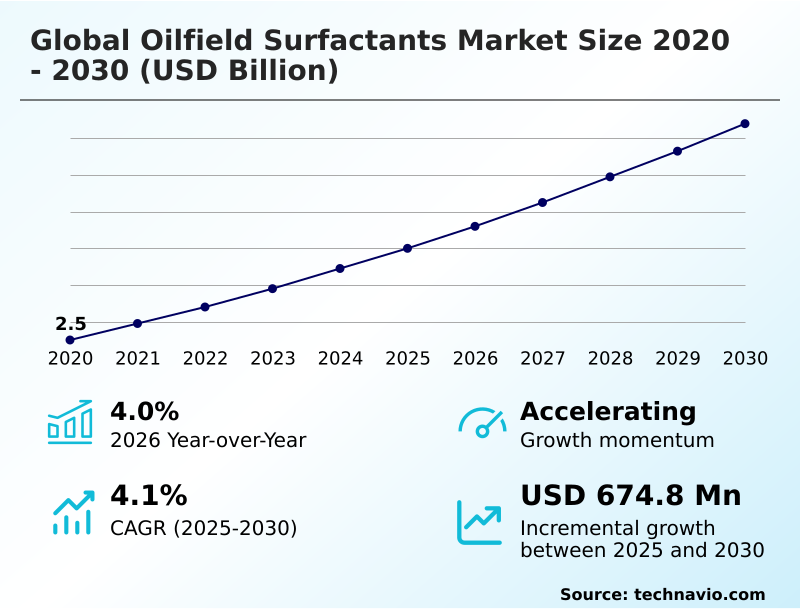
The Oilfield Surfactants Market size was valued at USD 3.00 billion in 2025 growing at a CAGR of 4.1% during the forecast period 2026-2030.
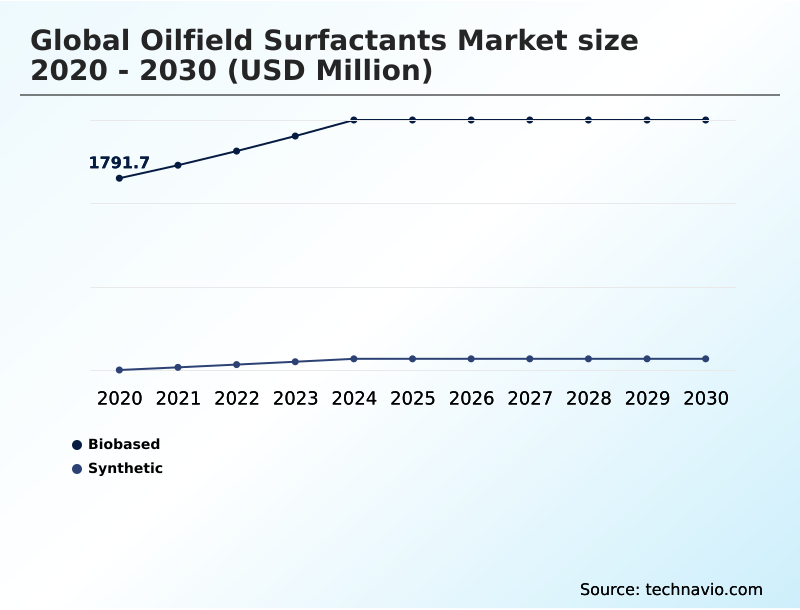
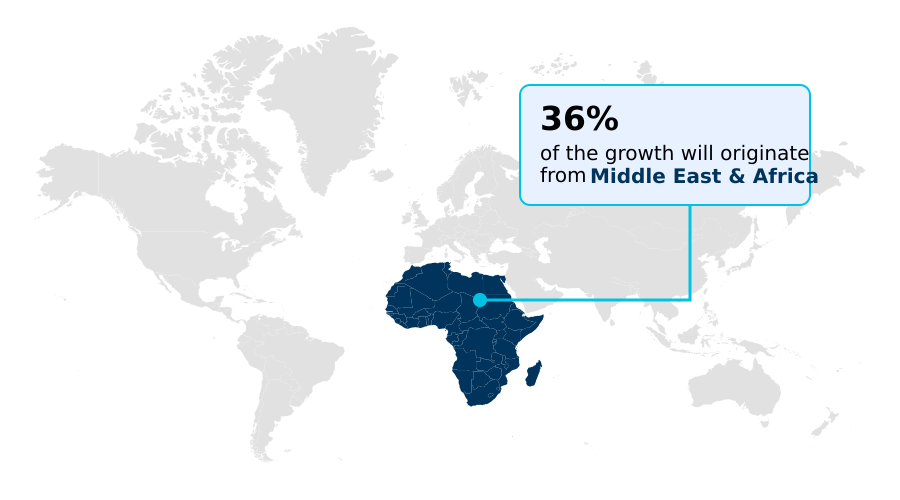
Middle East and Africa accounts for 36.4% of incremental growth during the forecast period. The Biobased segment by Source was valued at USD 2.12 billion in 2024, while the Anionic surfactants segment holds the largest revenue share by Product.
The market is projected to grow by USD 1.18 billion from 2020 to 2030, with USD 674.8 million of the growth expected during the forecast period of 2025 to 2030.
Get Key Insights on Market Forecast (PDF) Request Free Sample
Oilfield Surfactants Market Overview
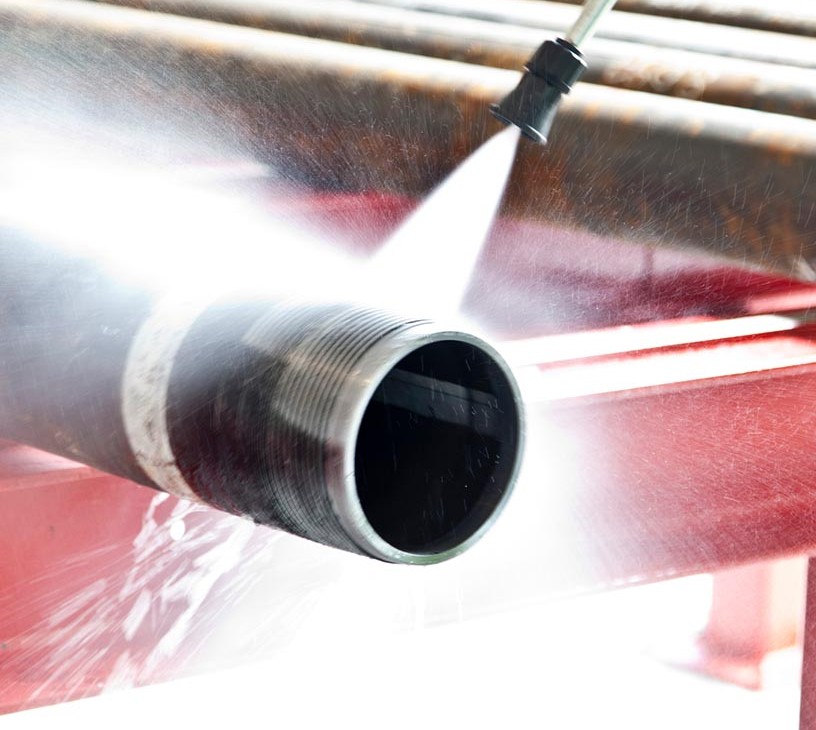
The oilfield surfactants market is defined by a strategic transition toward advanced chemical formulations designed to maximize hydrocarbon recovery while navigating stringent environmental regulations. A primary market force is the industrialization of chemical enhanced oil recovery to improve yields from mature fields, where specialized anionic surfactants and non-ionic surfactants are critical for mobilizing trapped resources. Concurrently, the industry is witnessing a pronounced shift toward bio-based surfactants, such as rhamnolipids, driven by tightening mandates like the EPA's PFAS reporting rules, which target persistent chemicals. This pivot is not just about compliance but also about de-risking supply chains from the volatility of ethylene oxide precursors. In practice, an operator managing a mature sandstone reservoir in the Permian Basin deploys AI-driven digital chemical dosing systems to optimize a surfactant-polymer flooding program. By using real-time downhole sensor data, the system adjusts the concentration of the surfactant blend to maintain optimal interfacial tension reduction, typically improving sweep efficiency by 15-20% compared to static injection schedules. This integration of smart fluid delivery and sustainable chemistry, with APAC poised to contribute over 13% of market growth, underpins the market's future trajectory.
Drivers, Trends, and Challenges in the Oilfield Surfactants Market
Procurement decisions within the global oilfield surfactants market 2026-2030 are increasingly complex, involving a detailed cost-benefit analysis of biosurfactants in oilfields versus traditional synthetic options. The central technical challenge is achieving consistent surfactant performance in high-salinity brines, which requires a sophisticated understanding of the anionic vs non-ionic surfactants in eor trade-offs.
An operator planning a hydraulic fracturing campaign in a water-scarce basin must evaluate formulations that not only deliver effective interfacial tension reduction but also comply with EPA regulations targeting PFAS chemicals. The role of surfactants in preventing emulsion blocks is critical for maintaining well productivity, especially in heavy oil applications where fluid separation is a constant challenge.
Furthermore, the impact of supply chain volatility on surfactant pricing, particularly for precursors like ethylene oxide, has become a primary boardroom concern. This volatility can increase operational expenditures by over 15% during periods of geopolitical tension, forcing a move toward more stable, albeit initially more expensive, bio-based feedstocks like sophorolipids.
This strategic shift underscores the market's move toward balancing performance, cost, and regulatory compliance.
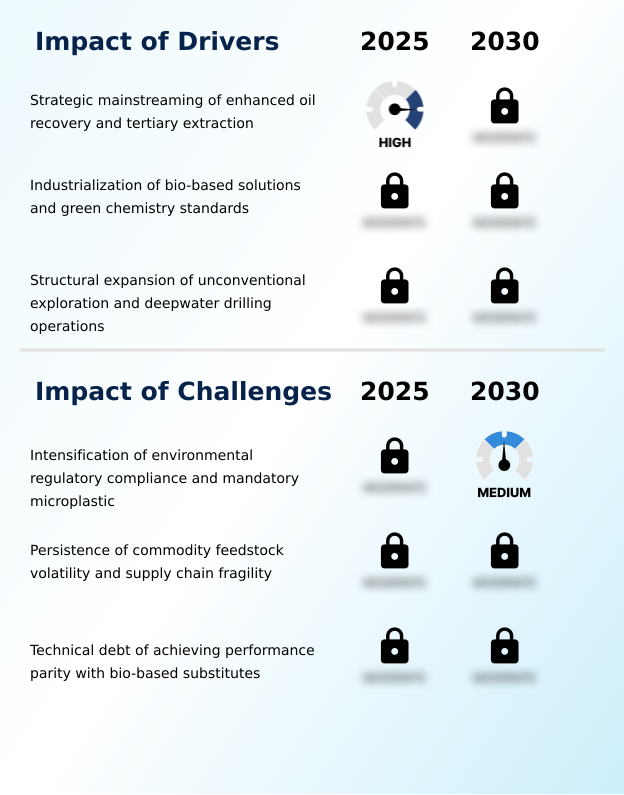
Primary Growth Driver: The strategic mainstreaming of enhanced oil recovery and tertiary extraction methods is a key driver, compelling operators to adopt advanced chemical solutions to maximize output from mature fields.
Market growth is primarily driven by the strategic mainstreaming of enhanced oil recovery (EOR) and tertiary extraction in mature reservoirs.
This shift creates a substantial demand for specialized anionic surfactants and non-ionic surfactants that can lower interfacial tension and mobilize trapped hydrocarbons under high-salinity and high-temperature conditions, contributing to a global surfactant volume of over nineteen million tons.
A second major driver is the industrialization of bio-based solutions and the adoption of green chemistry standards. The implementation of biosurfactants like rhamnolipids, which offer performance parity with reduced ecological footprints, is accelerating in response to stringent environmental mandates.
Lastly, the expansion of unconventional exploration and deepwater drilling operations necessitates high-performance additives, including amphoteric surfactants and silicone-based surfactants, that function as effective wetting agents and friction reducers in complex shale formations.
Emerging Market Trend: The proliferation of surfactant-polymer flooding and hybrid enhanced oil recovery architectures is an emerging trend. This shift moves beyond simple water-flooding to integrated chemical EOR for improved displacement and sweep efficiency.
Key market trends are centered on enhancing recovery efficiency and sustainability through technological innovation. The proliferation of surfactant-polymer flooding in mature fields is moving operations beyond simple water-flooding toward integrated chemical EOR systems that improve both microscopic displacement and macroscopic sweep efficiency, a market segment projected to surpass USD 2 billion.
Another significant development is the expansion of AI-driven real-time chemical optimization and digital chemical dosing systems. These platforms use machine learning algorithms to adjust surfactant concentrations based on downhole conditions, reducing waste and preventing formation damage. Furthermore, the industry is advancing toward nanotechnology surfactants and smart fluid delivery architectures.
These systems utilize nanoparticles to carry surfactant molecules deeper into the rock matrix, enabling precision reservoir management and unlocking previously inaccessible hydrocarbon reserves through atomic-level control.
Key Industry Challenge: The intensification of environmental regulatory compliance, including mandates on synthetic polymer microparticles, presents a significant challenge to market growth, requiring substantial investment in sustainable formulations.
The market faces formidable structural challenges, led by the intensification of environmental regulatory compliance. Mandates such as the European Union's REACH regulation for synthetic polymer microparticles and the EPA's expanding PFAS reporting obligations require a costly overhaul of product portfolios toward sustainable alternatives like alkyl polyglucoside.
A second critical restraint is the persistence of commodity feedstock volatility and supply chain fragility. The prices of essential precursors like ethylene oxide precursors and fatty alcohol feedstocks are subject to geopolitical tensions and crude oil price fluctuations, compressing margins for manufacturers. Finally, a significant technical hurdle is achieving performance parity between traditional synthetic products and emerging bio-based substitutes.
Many biosurfactants struggle to maintain stability in the high-temperature, high-salinity conditions typical of deep-well environments, creating a performance gap that remains a primary barrier to mass-market adoption.
Explore Full Market Dynamics Analysis Request Free Sample
Oilfield Surfactants Market Segmentation
The oilfield surfactants industry research report provides comprehensive data including region-wise segment analysis, with forecasts and analysis for the period 2026-2030, as well as historical data from 2020-2024 for the following segments.
Source Segment Analysis
The biobased segment is estimated to witness significant growth during the forecast period.
The biobased segment is undergoing transformative expansion, driven by a global strategic pivot toward sustainable chemistry and the decarbonization of upstream operations. These surfactants are derived from renewable feedstocks, including microbial fermentation products such as rhamnolipids and sophorolipids.
In oilfield applications, biobased variants are increasingly favored for their exceptional biodegradability and significantly lower aquatic toxicity compared to traditional petrochemical analogs, making them a preferred choice for offshore drilling in environmentally sensitive reservoirs.
Modern biobased surfactants also demonstrate robust performance, including high thermal stability and the ability to achieve the interfacial tension reduction critical for chemical enhanced oil recovery.
As production costs for fermentation-derived surfactants continue to decline, the biobased segment, which accounted for over 70% of the market, is projected to record the highest growth.
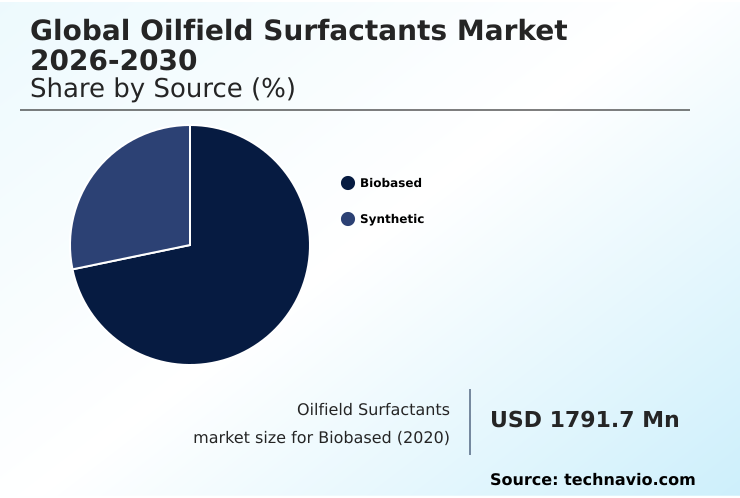
The Biobased segment was valued at USD 2.12 billion in 2024 and showed a gradual increase during the forecast period.
Oilfield Surfactants Market by Region: Middle East and Africa Leads with 36.4% Growth Share
Middle East and Africa is estimated to contribute 36.4% to the growth of the global market during the forecast period.
The geographic landscape of the oilfield surfactants market is characterized by varied regional drivers and technological adoption rates.
The Middle East and Africa is set to contribute approximately 36.4% of the market's incremental growth, driven by large-scale chemical enhanced oil recovery projects in its super-giant fields, requiring high volumes of anionic surfactants and polymer blends.
North America remains a crucial region, with the US market for hydraulic fracturing chemicals being substantial. Here, the focus is on optimizing unconventional shale resource extraction through advanced well stimulation chemistry and real-time chemical optimization.
Meanwhile, APAC is the fastest-growing region with a CAGR of 5.1%, fueled by rising energy demand and government initiatives in China and India to boost domestic production.
In Europe, the market is defined by stringent environmental standards, driving demand for biodegradable oilfield chemicals and green chemistry standards, particularly for offshore operations in the North Sea.
Customer Landscape Analysis for the Oilfield Surfactants Market
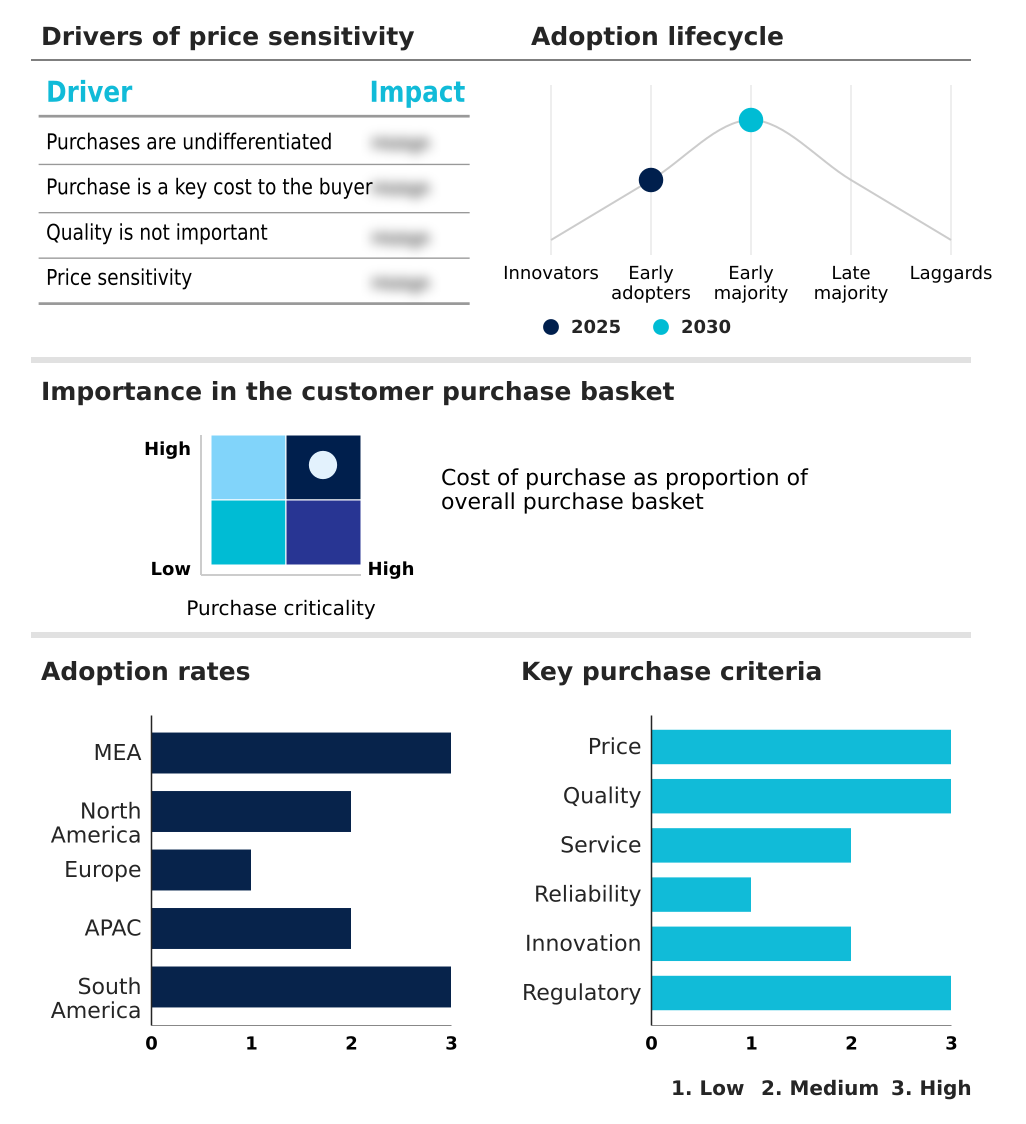
The oilfield surfactants market forecasting report includes the adoption lifecycle of the market, covering from the innovator’s stage to the laggard’s stage. It focuses on adoption rates in different regions based on penetration. Furthermore, the oilfield surfactants market report also includes key purchase criteria and drivers of price sensitivity to help companies evaluate and develop their market growth analysis strategies.
Competitive Landscape of the Oilfield Surfactants Market
Companies are implementing various strategies, such as strategic alliances, partnerships, mergers and acquisitions, geographical expansion, and product/service launches, to enhance their presence in the oilfield surfactants market industry.
3M Co. - Offerings include diverse surfactant classes, from anionic to silicone-based, tailored for applications ranging from enhanced oil recovery to drilling fluid formulation and production chemistry.
The industry research and growth report includes detailed analyses of the competitive landscape of the market and information about key companies, including:
- 3M Co.
- Arkema Group
- Ashland Inc.
- Baker Hughes Co.
- BASF SE
- Clariant International Ltd.
- Croda International Plc
- Dow Chemical Co.
- Evonik Industries AG
- Halliburton Co.
- Huntsman International LLC
- Indorama Ventures Public Co.
- Kao Corp.
- Nouryon Chemicals Holding B.V.
- Sasol Ltd.
- Schlumberger Ltd.
- Solvay SA
- Stepan Co.
- The Lubrizol Corp.
Qualitative and quantitative analysis of companies has been conducted to help clients understand the wider business environment as well as the strengths and weaknesses of key industry players. Data is qualitatively analyzed to categorize companies as pure play, category-focused, industry-focused, and diversified; it is quantitatively analyzed to categorize companies as dominant, leading, strong, tentative, and weak.
Recent Developments in the Oilfield Surfactants Market
- In May 2025, The Indonesian government announced adjustments to its palm oil export levy and tax tariffs, a fiscal move impacting the global cost structure and supply chain stability for oleochemical-based anionic surfactants.
- In October 2025, Sterling Specialty Chemicals launched a new comprehensive line of surfactants, including green long-chain alkoxylates specifically optimized for enhanced oil recovery in unconventional wells.
- In February 2026, Baker Hughes signed a multiyear preferred provider agreement with Marathon Petroleum to deploy its downstream chemical portfolio, including XERIC heavy oil demulsifiers and BIOQUEST renewable additives, across twelve refineries.
- In March 2026, BASF announced the successful scale-up of its rhamnolipid-based biosurfactant line, engineered for high-salinity reservoir conditions to meet stringent discharge mandates in the North Sea and APAC.
Research Analyst Overview: Oilfield Surfactants Market
The oilfield surfactants market is evolving beyond bulk commodity chemicals toward specialized, high-performance formulations where value is measured by recovery efficiency and environmental compliance. Boardroom-level decisions now center on the total cost of ownership, weighing the upfront expense of bio-based surfactants against the long-term risk of non-compliance with regulations like REACH.
The commercialization of rhamnolipids and sophorolipids, derived from renewable chemical feedstocks, marks a significant shift, even as synthetic anionic surfactants and non-ionic surfactants remain essential for high-temperature chemical enhanced oil recovery operations. A key development is the integration of nanotechnology surfactants with smart fluid delivery systems, enabling precise, trigger-based release within the reservoir to maximize interfacial tension reduction.
This is particularly vital in surfactant-polymer flooding programs aimed at revitalizing mature assets. With the bio-based segment alone representing a market of over USD 2.2 billion, investment in sustainable production chemicals and biodegradable drilling fluid additives is no longer optional but a core strategic imperative for maintaining market access and a social license to operate.
Dive into Technavio’s robust research methodology, blending expert interviews, extensive data synthesis, and validated models for unparalleled Oilfield Surfactants Market insights. See full methodology.
| Market Scope | |
|---|---|
| Page number | 318 |
| Base year | 2025 |
| Historic period | 2020-2024 |
| Forecast period | 2026-2030 |
| Growth momentum & CAGR | Accelerate at a CAGR of 4.1% |
| Market growth 2026-2030 | USD 674.8 million |
| Market structure | Fragmented |
| YoY growth 2025-2026(%) | 4.0% |
| Key countries | Saudi Arabia, UAE, Iran, South Africa, Israel, US, Canada, Mexico, UK, Germany, France, The Netherlands, Italy, Spain, China, India, Indonesia, Australia, Japan, South Korea, Brazil, Argentina and Chile |
| Competitive landscape | Leading Companies, Market Positioning of Companies, Competitive Strategies, and Industry Risks |
Oilfield Surfactants Market: Key Questions Answered in This Report
-
What is the expected growth of the Oilfield Surfactants Market between 2026 and 2030?
-
The Oilfield Surfactants Market is expected to grow by USD 674.8 million during 2026-2030, registering a CAGR of 4.1%. Year-over-year growth in 2026 is estimated at 4.0%%. This acceleration is shaped by strategic mainstreaming of enhanced oil recovery and tertiary extraction, which is intensifying demand across multiple end-use verticals covered in the report.
-
-
What segmentation does the market report cover?
-
The report is segmented by Source (Biobased, and Synthetic), Product (Anionic surfactants, Non-ionic surfactants, Amphoteric surfactants, Cationic surfactants, and Silicone-based), Application (Enhanced oil recovery, Drilling fluids, Stimulation, Production chemicals, and Others) and Geography (Middle East and Africa, North America, Europe, APAC, South America). Among these, the Biobased segment is estimated to witness significant growth during the forecast period, driven by rising adoption across key application areas. Each segment includes detailed qualitative and quantitative analysis, along with historical data from 2020-2024 and forecasts through 2030 with year-over-year growth rates.
-
-
Which regions are analyzed in the report?
-
The report covers Middle East and Africa, North America, Europe, APAC and South America. Middle East and Africa is estimated to contribute 36.4% to market growth during the forecast period. Country-level analysis includes Saudi Arabia, UAE, Iran, South Africa, Israel, US, Canada, Mexico, UK, Germany, France, The Netherlands, Italy, Spain, China, India, Indonesia, Australia, Japan, South Korea, Brazil, Argentina and Chile, with dedicated market size tables and year-over-year growth for each.
-
-
What are the key growth drivers and market challenges?
-
The primary driver is strategic mainstreaming of enhanced oil recovery and tertiary extraction, which is accelerating investment and industry demand. The main challenge is intensification of environmental regulatory compliance and mandatory microplastic, creating operational barriers for key market participants. The report quantifies the impact of each driver and challenge across 2026 and 2030 with comparative analysis.
-
-
Who are the major players in the Oilfield Surfactants Market?
-
Key vendors include 3M Co., Arkema Group, Ashland Inc., Baker Hughes Co., BASF SE, Clariant International Ltd., Croda International Plc, Dow Chemical Co., Evonik Industries AG, Halliburton Co., Huntsman International LLC, Indorama Ventures Public Co., Kao Corp., Nouryon Chemicals Holding B.V., Sasol Ltd., Schlumberger Ltd., Solvay SA, Stepan Co. and The Lubrizol Corp.. The report provides qualitative and quantitative analysis categorizing companies as dominant, leading, strong, tentative, and weak based on their market positioning. Company profiles include business segment analysis, SWOT assessment, key offerings, and recent strategic developments.
-
Oilfield Surfactants Market Research Insights
Market dynamics are increasingly shaped by the need for high-performance chemistry in technically demanding environments, contributing to a year-over-year growth of 4.0%. The expansion of deepwater drilling chemicals and unconventional shale resource extraction, particularly in North America, which accounts for nearly 30% of incremental growth, requires high-pressure high-temperature surfactants.
In a typical deepwater project, operators rely on advanced flow assurance chemicals and subsea chemical injection systems to manage production, where the failure of a demulsifier can halt operations. This operational dependency is compounded by regulatory pressures, with frameworks like REACH regulation compliance mandating the use of low aquatic toxicity surfactants and biodegradable oilfield chemicals.
This forces a strategic re-evaluation of formulations, moving away from legacy chemistries toward sustainable oleochemical-based surfactants and other green chemistry standards to ensure long-term operational viability.
We can help! Our analysts can customize this oilfield surfactants market research report to meet your requirements.
 RIA -
RIA - 
