Online Ad Spending Market Analysis, Size, and Forecast 2025-2029: North America (US, Canada, and Mexico), Europe (France, Germany, and UK), APAC (China, India, and Japan), South America (Brazil), and Rest of World (ROW)

Online Ad Spending Market Analysis, Size, and Forecast 2025-2029:
North America (US, Canada, and Mexico), Europe (France, Germany, and UK), APAC (China, India, and Japan), South America (Brazil), and Rest of World (ROW)

Published: May 2025 236 Pages SKU: IRTNTR72730

Market Overview at a Glance

$286.6 B
Market Opportunity
11.7%
CAGR
10.3
YoY growth 2024-2025(%)

Online Ad Spending Market Size 2025-2029

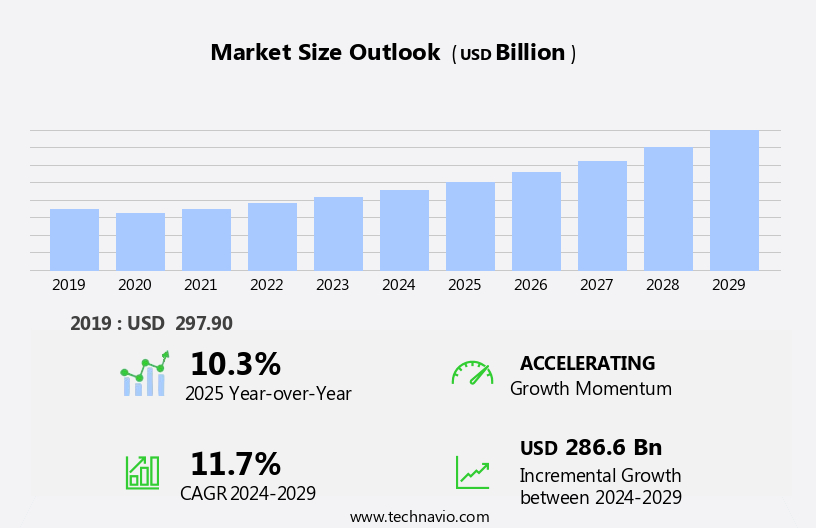
The online ad spending market size is forecast to increase by USD 286.6 billion, at a CAGR of 11.7% between 2024 and 2029.

  • The market is experiencing significant shifts, with a noticeable decline in offline advertising expenditures driving more businesses towards digital channels. This trend is fueled by the increasing popularity of online video and connected TV (CTV) advertising, as consumers increasingly engage with content on digital platforms. However, this market is not without challenges. The rise of click fraud activities poses a significant threat, requiring robust fraud detection mechanisms and continuous optimization of digital ad campaigns to mitigate potential losses. Companies seeking to capitalize on the opportunities presented by this dynamic market must stay abreast of these trends and proactively address the challenges to maintain a competitive edge.
  • Effective strategies include investing in advanced ad fraud prevention technologies, optimizing video and CTV ad placements, and leveraging data-driven insights to create targeted and personalized campaigns. By navigating these trends and challenges, businesses can maximize their online ad spending and effectively reach their audiences in the digital realm.

What will be the Size of the Online Ad Spending Market during the forecast period?

Online Ad Spending Market Size

Explore in-depth regional segment analysis with market size data - historical 2019-2023 and forecasts 2025-2029 - in the full report.  
Request Free Sample

The market continues to evolve, with digital marketing strategies becoming increasingly intricate and data-driven. Entities such as website structure, voice search optimization, and search network play pivotal roles in this dynamic landscape. Artificial intelligence and machine learning are revolutionizing the way businesses approach marketing, from keyword research and content marketing to predictive analytics and decision making. Marketing technology, including SEO tools and marketing automation, enables businesses to optimize their online presence and enhance user experience. Disruptive technologies like schema markup, ad extensions, and social media advertising are reshaping consumer behavior and influencing marketing ROI. Moreover, the importance of data security and privacy in the digital age cannot be overstated.

As businesses collect and analyze vast amounts of data, data ethics and privacy policies become essential components of marketing strategies. The ongoing unfolding of market activities also encompasses the integration of marketing technology, content syndication, and SEO reporting to streamline marketing efforts and improve marketing measurement. Ad copywriting and natural language processing are crucial elements in creating engaging and effective ad campaigns. Backlink analysis and page speed optimization are essential components of SEO, while link building and conversion tracking help businesses measure the success of their digital marketing initiatives. Core web vitals and mobile optimization are vital for ensuring a seamless user experience across devices.

In the ever-evolving digital marketing landscape, businesses must stay informed and adapt to the latest trends and technologies to remain competitive. From local SEO to e-commerce SEO, marketing budgets and strategies must be agile and responsive to the continuous shifts in consumer behavior and market dynamics.

How is this Online Ad Spending Industry segmented?

The online ad spending industry research report provides comprehensive data (region-wise segment analysis), with forecasts and estimates in "USD billion" for the period 2025-2029, as well as historical data from 2019-2023 for the following segments.

  • Platform
    • Mobile devices
    • Desktops
  • Application
    • Retail and e-commerce
    • Healthcare and pharma
    • Media and entertainment
    • Travel and hospitality
    • Others
  • Type
    • Search Ads
    • Social Media Ads
    • Display Ads
    • Video Ads
    • Others
  • Geography
    • North America
      • US
      • Canada
      • Mexico
    • Europe
      • France
      • Germany
      • UK
    • APAC
      • China
      • India
      • Japan
    • South America
      • Brazil
    • Rest of World (ROW)

By Platform Insights

The mobile devices segment is estimated to witness significant growth during the forecast period.

The digital advertising landscape is undergoing significant shifts, with mobile advertising emerging as a key driver of growth. The proliferation of smartphones and increasing mobile Internet usage has led to a surge in mobile advertising spend. In 2023, global smartphone shipments reached an impressive 1.17 billion units, fueling the demand for mobile ads. Major players in the smartphone market, including Samsung Electronics, Apple, Xiaomi, Oppo, and Vivo, have reported increased shipments, indicating a strong consumer preference for mobile devices. To maximize the potential of mobile advertising, businesses focus on various strategies. Website audits ensure mobile-friendliness, while email segmentation and automation cater to mobile users.

Rich snippets and schema markup enhance search engine results, making them more engaging and informative. Content repurposing and curation for mobile platforms are essential for reaching diverse audiences. User experience plays a crucial role in mobile advertising success. Image optimization, on-page optimization, and page speed are essential factors that contribute to a positive user experience. Data security and privacy are also critical concerns, with businesses implementing robust strategies to protect user data. Technical SEO, local SEO, and voice search optimization are essential for mobile search engine optimization. Machine learning and artificial intelligence algorithms are used to analyze user behavior and optimize ad targeting and bidding.

Social media marketing and management, along with social listening, help businesses engage with their audience and build brand awareness. Businesses also leverage data analytics, marketing automation, and customer relationship management tools to measure marketing performance, optimize conversion rates, and enhance customer experiences. Predictive analytics and big data help businesses make informed decisions and improve their marketing strategies. Influencer marketing, link building, and content marketing are effective strategies for building brand awareness and driving conversions. SEO consulting and auditing services help businesses optimize their websites and improve their search engine rankings. Schema markup, ad extensions, and structured data are essential for enhancing search engine results and driving traffic to websites.

Marketing budgets and strategies are increasingly focused on digital transformation and mobile optimization. Ad copywriting, natural language processing, and backlink analysis are essential skills for digital marketers. Core web vitals, conversion tracking, and lead generation are essential metrics for measuring marketing success. The future of digital marketing is characterized by disruptive technologies like augmented reality, virtual reality, and chatbots. Marketing technology and SEO tools are continually evolving to meet the demands of the digital marketing landscape. Ad targeting, ad bidding, and ad copywriting are essential skills for digital marketers in this rapidly changing environment. In conclusion, the mobile advertising market is experiencing significant growth, driven by the increasing number of smartphone users and the shift towards mobile Internet usage.

Businesses are focusing on various strategies, including website optimization, content marketing, social media marketing, data analytics, and influencer marketing, to maximize their mobile advertising ROI. The digital marketing landscape is continually evolving, with disruptive technologies and emerging trends shaping the future of marketing.

Online Ad Spending Market Size

Request Free Sample

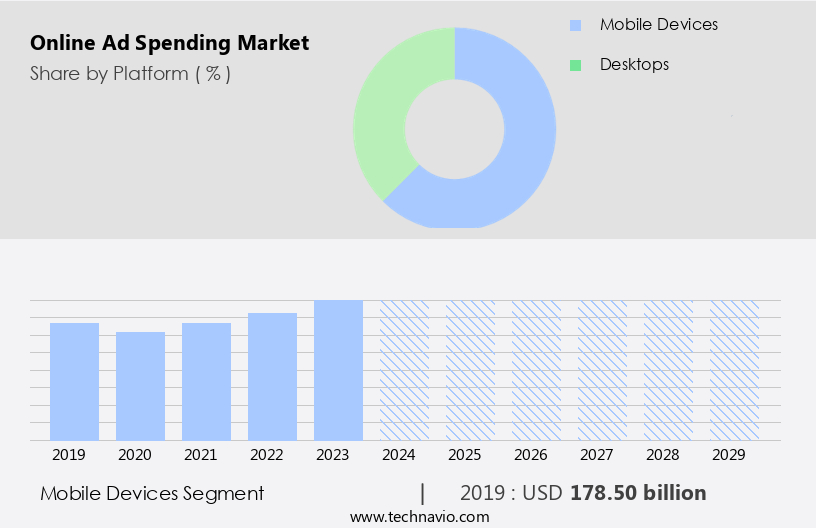
The Mobile devices segment was valued at USD 178.50 billion in 2019 and showed a gradual increase during the forecast period.
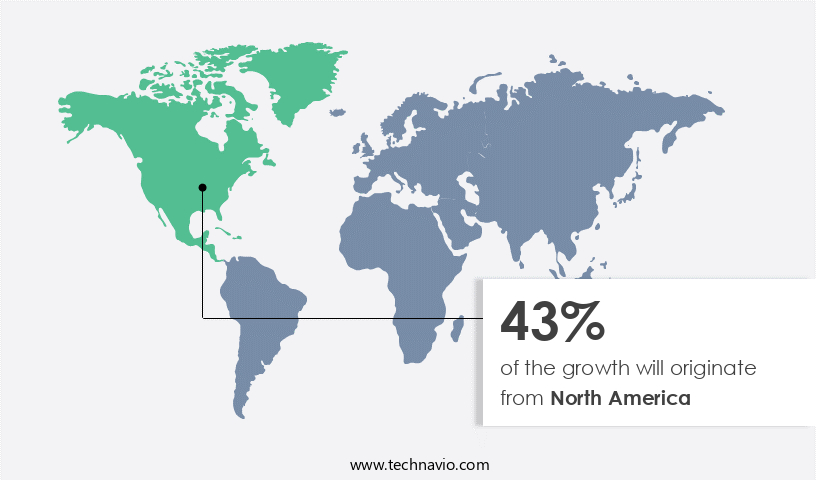
Regional Analysis

North America is estimated to contribute 43% to the growth of the global market during the forecast period. Technavio's analysts have elaborately explained the regional trends and drivers that shape the market during the forecast period.

Online Ad Spending Market Share by Geography

 Request Free Sample

The market in North America is experiencing significant growth, holding a substantial share in the global market. Factors driving this expansion include the increasing penetration of smartphones and robust broadband infrastructure. The saturation of traditional print newspaper and radio advertising in the region is also contributing to the market's growth. Mobile ad spending is a key catalyst, as more people spend an increased amount of time on mobile devices for daily activities and content consumption. Companies are recognizing the importance of integrating marketing efforts into mobile platforms to engage consumers effectively during the forecast period. User experience plays a crucial role in online advertising, with businesses focusing on optimizing websites for faster page speed and better mobile responsiveness to enhance user engagement.

Content strategy and quality are essential components, with businesses employing various tactics such as content repurposing, curation, and marketing automation to reach their target audience effectively. Email marketing remains a popular channel, with segmentation, personalization, and automation being essential elements to improve open rates and conversions. Data security and privacy are top priorities for businesses, with the implementation of privacy policies, data encryption, and machine learning algorithms to protect sensitive information. Technical SEO and schema markup are essential for search engine optimization, while ad extensions and ad targeting help businesses reach their desired audience more effectively. Social media marketing and management are integral parts of digital marketing strategies, with social listening and influencer marketing being key trends.

Marketing measurement and reporting are essential for businesses to evaluate the success of their campaigns and make data-driven decisions. Google Search Console, Google Analytics, and other SEO tools provide valuable insights into website performance and user behavior. E-commerce SEO and mobile optimization are essential for businesses selling products online, with conversion rate optimization and landing page optimization being critical components to improve sales and customer engagement. Digital transformation is a significant trend, with businesses adopting disruptive technologies like artificial intelligence, predictive analytics, and voice search optimization to streamline processes and enhance customer experiences. SEO consulting and marketing strategy development are crucial services provided by SEO agencies to help businesses stay competitive in the digital landscape.

In conclusion, the market in North America is witnessing substantial growth, with mobile ad spending being a major driver. User experience, content strategy, data security, and privacy are essential components of successful online advertising campaigns. Digital transformation and disruptive technologies are shaping the future of marketing, with businesses focusing on data-driven decisions and effective measurement and reporting.

Market Dynamics

Our researchers analyzed the data with 2024 as the base year, along with the key drivers, trends, and challenges. A holistic analysis of drivers will help companies refine their marketing strategies to gain a competitive advantage.

What are the key market drivers leading to the rise in the adoption of Online Ad Spending Industry?

  • The decline in offline advertising expenditures serves as the primary catalyst for the market's current dynamics. 
  • The digital transformation in marketing has led to a significant shift in advertising spending from traditional offline channels to online platforms. The affordability of digital advertising, particularly for small businesses, is a major factor driving this trend. According to recent research, the decline in spending on offline advertising, including magazines, newspapers, mail, radio, out-of-home (OOH), and cinema, is contributing to the growth of the market. Print advertising, which includes ads placed in newspapers and magazines, has been particularly affected by this trend. With the emergence of e-papers and e-magazines, the sales of print media have declined.
  • In India, for instance, the average issue readership of several leading newspapers has decreased in recent years. To maximize the effectiveness of digital advertising, businesses focus on various strategies such as keyword research, SEO audit, landing page optimization, conversion rate optimization, content marketing, social media marketing, and social listening. These tactics help improve quality score, page authority, and ad targeting, resulting in better return on investment. Moreover, the use of big data, predictive analytics, machine learning, and ad bidding enables businesses to make data-driven decisions and reach their target audience more effectively. Data ethics and privacy policies are also crucial considerations in digital advertising to maintain consumer trust.
  • Off-page optimization, social signals, and content curation are essential aspects of digital marketing that complement on-page optimization. Buyer personas, attribution modeling, and seo consulting can further help businesses understand their audience and optimize their marketing efforts. In conclusion, the digital advertising market is expected to continue growing as businesses increasingly shift their ad spending from traditional offline channels to online platforms. Effective implementation of digital marketing strategies, such as SEO, social media marketing, and content marketing, can help businesses maximize their online ad spending and reach their target audience more effectively.

What are the market trends shaping the Online Ad Spending Industry?

  • The trend in digital advertising is shifting towards online video and Connected TV (CTV), marking significant growth in these markets. Online video and CTV advertising represent the future of media consumption and advertising engagement.
  • The digital advertising landscape in 2024 witnessed significant growth in online video and connected TV (CTV) advertising, driven by evolving consumer media consumption habits and the maturation of digital advertising infrastructure. Advertisers increasingly allocated resources towards video formats that prioritize customer journey and marketing funnel, delivering high-impact storytelling and immersive brand experiences. This versatility enabled the distribution of visually engaging content across various devices, such as smart televisions, mobile phones, and desktops. Programmatic technology's advancements played a pivotal role in the expansion of online video advertising. These advancements allowed for more accurate audience targeting and real-time campaign optimization, enhancing the overall effectiveness of digital ad spending.
  • Furthermore, data analytics integration into video platforms facilitated the measurement of viewer engagement and campaign performance, providing valuable insights for informed media planning decisions. Marketing strategies evolved to include video optimization, mobile optimization, local SEO, marketing automation, and customer relationship management. Key elements such as structured data, data mining, data storytelling, A/B testing, cookie consent, and marketing budget allocation became essential components of a successful digital advertising campaign. Search engine algorithms continued to prioritize mobile-first indexing, emphasizing the importance of mobile optimization for businesses seeking high search engine rankings. In conclusion, the digital advertising market in 2024 experienced substantial growth due to the increasing importance of video formats, programmatic technology, and data analytics.
  • Advertisers recognized the value of immersive brand experiences and high-impact storytelling, leading to increased investment in video advertising across various devices. The integration of data analytics and marketing automation tools enabled more informed media planning decisions and optimized campaign performance.

What challenges does the Online Ad Spending Industry face during its growth?

  • Click fraud poses a significant challenge to the industry's growth, as malicious actors repeatedly and fraudulently click on ads to inflate costs for advertisers and deplete marketing budgets. 
  • Digital marketing continues to evolve, with online ad spending reaching significant levels. However, it's essential for businesses to be aware of potential threats, such as click fraud. This malicious activity involves repeatedly clicking on pay-per-click (PPC) ads without any intention of making a purchase, leading to unnecessary charges for advertisers. Click fraud can impact various types of ads, including search network and display network ads, and can result in increased advertising expenses, decreased conversion rates, and skewed user data. In highly competitive industries, it's not uncommon for rivals to engage in click fraud to deplete ad spend. To mitigate click fraud risks, businesses should focus on marketing technologies that offer advanced features, such as artificial intelligence, natural language processing, and backlink analysis.
  • SEO tools can help in optimizing website structure, improving search intent, and enhancing link building and rank tracking. Additionally, marketing ROI can be maximized by focusing on content syndication, SEO reporting, ad copywriting, and conversion tracking. Core web vitals, such as page speed, are also crucial for ensuring a positive user experience and reducing the likelihood of click fraud. Furthermore, businesses should prioritize voice search optimization and social media advertising to expand their reach and engage with their audience effectively. By staying informed about the latest marketing trends and technologies, businesses can protect their ad spend and optimize their digital marketing efforts for maximum impact.

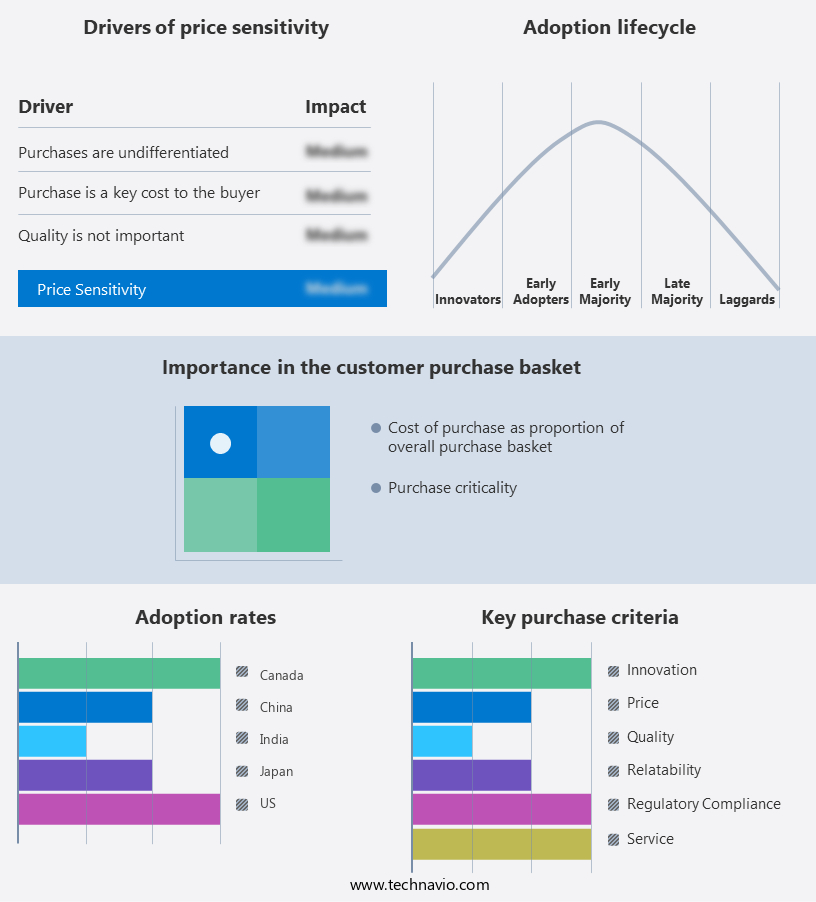
Exclusive Customer Landscape

The online ad spending market forecasting report includes the adoption lifecycle of the market, covering from the innovator's stage to the laggard's stage. It focuses on adoption rates in different regions based on penetration. Furthermore, the online ad spending market report also includes key purchase criteria and drivers of price sensitivity to help companies evaluate and develop their market growth analysis strategies.

Online Ad Spending Market Share by Geography

 Customer Landscape

Key Companies & Market Insights

Companies are implementing various strategies, such as strategic alliances, online ad spending market forecast, partnerships, mergers and acquisitions, geographical expansion, and product/service launches, to enhance their presence in the industry.

Alibaba Group Holding Ltd. - The company specializes in digital marketing solutions, providing online advertising services including Keyword Advertising. 

The industry research and growth report includes detailed analyses of the competitive landscape of the market and information about key companies, including:

  • Alibaba Group Holding Ltd.
  • Alphabet Inc.
  • Amazon.com Inc.
  • Baidu Inc.
  • Dentsu Group Inc.
  • Digital Turbine Inc.
  • Eniro AB
  • GroupM
  • Hakuhodo DY Media Partners Inc. Co. Ltd.
  • InterActiveCorp
  • Meta Platforms Inc.
  • Microsoft Corp.
  • SXM Media
  • Tencent Holdings Ltd.
  • The Interpublic Group of Companies Inc.
  • Yahoo B2B
  • X Corp.

Qualitative and quantitative analysis of companies has been conducted to help clients understand the wider business environment as well as the strengths and weaknesses of key industry players. Data is qualitatively analyzed to categorize companies as pure play, category-focused, industry-focused, and diversified; it is quantitatively analyzed to categorize companies as dominant, leading, strong, tentative, and weak.

Recent Development and News in Online Ad Spending Market

  • In January 2024, Google announced the launch of its new automated bidding strategy, "Smart Bidding with Machine Learning," designed to optimize ad spending for businesses by using machine learning algorithms to analyze historical data and real-time market conditions (Google Press Release, 2024). This innovation aimed to improve campaign performance and save advertisers time and resources.
  • In March 2025, Meta Platforms, Inc. (Facebook) and Amazon entered into a strategic partnership, allowing Meta to sell Amazon products directly through its social media and messaging apps, expanding Amazon's reach and Meta's advertising offerings (Meta Press Release, 2025). This collaboration represented a significant shift in the online advertising landscape, blurring the lines between social media and e-commerce.
  • In May 2025, Microsoft Corporation completed its acquisition of Metaswitch Networks, a leading provider of cloud communications software, for approximately USD1.8 billion (Microsoft Press Release, 2025). This acquisition was expected to enhance Microsoft's Teams platform with advanced communication features and strengthen its position in the growing market for cloud-based business communications.
  • In the same month, the European Union introduced the Digital Services Act, a comprehensive regulatory framework aimed at enhancing online safety, protecting consumer rights, and promoting fair competition in the digital sector (European Commission Press Release, 2025). The Act included provisions for increased transparency and accountability from online platforms, as well as new rules for targeted advertising and data protection.

Research Analyst Overview

  • In the dynamic online advertising market, data analytics tools play a pivotal role in optimizing marketing strategies. Website speed, a crucial factor in user experience, significantly impacts paid traffic performance. Data management platforms facilitate the organization and activation of first, second, and third-party data for targeted ad campaigns. Marketers leverage data visualization tools to gain insights from complex data sets, while keyword research tools inform effective search engine marketing. Email marketing platforms and marketing automation tools enhance audience engagement and conversion rates. SEO audit tools assess website performance, identifying areas for improvement in areas like domain rating, mobile friendliness, and backlink profile.
  • SERP analysis, click-through rate, pages per session, average session duration, and bounce rate are essential metrics for measuring campaign success. Content optimization tools, powered by machine learning algorithms, aid in creating high-performing content. Rank tracking tools monitor keyword rankings and search volume, while backlink analysis tools help build authoritative backlinks. Organic traffic, referral traffic, and direct traffic sources contribute to a comprehensive marketing mix. AI-powered marketing tools, including content management systems, enhance efficiency and improve conversion rates. Keyword difficulty and search volume are essential considerations for successful search engine marketing. Overall, these tools and metrics shape the evolving market.

Dive into Technavio's robust research methodology, blending expert interviews, extensive data synthesis, and validated models for unparalleled Online Ad Spending Market insights. See full methodology.

Market Scope

Report Coverage

Details

Page number

236

Base year

2024

Historic period

2019-2023

Forecast period

2025-2029

Growth momentum & CAGR

Accelerate at a CAGR of 11.7%

Market growth 2025-2029

USD 286.6 billion

Market structure

Fragmented

YoY growth 2024-2025(%)

10.3

Key countries

US, China, Canada, UK, Japan, Mexico, Brazil, Germany, India, and France

Competitive landscape

Leading Companies, Market Positioning of Companies, Competitive Strategies, and Industry Risks

Request Free Sample

What are the Key Data Covered in this Online Ad Spending Market Research and Growth Report?

  • CAGR of the Online Ad Spending industry during the forecast period
  • Detailed information on factors that will drive the growth and forecasting between 2025 and 2029
  • Precise estimation of the size of the market and its contribution of the industry in focus to the parent market
  • Accurate predictions about upcoming growth and trends and changes in consumer behaviour
  • Growth of the market across North America, APAC, Europe, South America, and Middle East and Africa
  • Thorough analysis of the market's competitive landscape and detailed information about companies
  • Comprehensive analysis of factors that will challenge the online ad spending market growth of industry companies

We can help! Our analysts can customize this online ad spending market research report to meet your requirements.

Get in touch

1 Executive Summary

  • 1.1 Market overview
    • Executive Summary - Chart on Market Overview
    • Executive Summary - Data Table on Market Overview
    • Executive Summary - Chart on Global Market Characteristics
    • Executive Summary - Chart on Market by Geography
    • Executive Summary - Chart on Market Segmentation by Platform
    • Executive Summary - Chart on Market Segmentation by Application
    • Executive Summary - Chart on Market Segmentation by Type
    • Executive Summary - Chart on Incremental Growth
    • Executive Summary - Data Table on Incremental Growth
    • Executive Summary - Chart on Company Market Positioning

2 Technavio Analysis

  • 2.1 Analysis of price sensitivity, lifecycle, customer purchase basket, adoption rates, and purchase criteria
    • Analysis of price sensitivity, lifecycle, customer purchase basket, adoption rates, and purchase criteria
  • 2.2 Criticality of inputs and Factors of differentiation
    • Overview on criticality of inputs and factors of differentiation
  • 2.3 Factors of disruption
    • Overview on factors of disruption
  • 2.4 Impact of drivers and challenges
    • Impact of drivers and challenges in 2024 and 2029

3 Market Landscape

  • 3.1 Market ecosystem
    • Parent Market
    • Data Table on - Parent Market
  • 3.2 Market characteristics
    • Market characteristics analysis
  • 3.3 Value chain analysis
    • Value chain analysis

4 Market Sizing

  • 4.1 Market definition
    • Offerings of companies included in the market definition
  • 4.2 Market segment analysis
    • Market segments
  • 4.3 Market size 2024
    • 4.4 Market outlook: Forecast for 2024-2029
      • Chart on Global - Market size and forecast 2024-2029 ($ billion)
      • Data Table on Global - Market size and forecast 2024-2029 ($ billion)
      • Chart on Global Market: Year-over-year growth 2024-2029 (%)
      • Data Table on Global Market: Year-over-year growth 2024-2029 (%)

    5 Historic Market Size

    • 5.1 Global Online Ad Spending Market 2019 - 2023
      • Historic Market Size - Data Table on Global Online Ad Spending Market 2019 - 2023 ($ billion)
    • 5.2 Platform segment analysis 2019 - 2023
      • Historic Market Size - Platform Segment 2019 - 2023 ($ billion)
    • 5.3 Application segment analysis 2019 - 2023
      • Historic Market Size - Application Segment 2019 - 2023 ($ billion)
    • 5.4 Type segment analysis 2019 - 2023
      • Historic Market Size - Type Segment 2019 - 2023 ($ billion)
    • 5.5 Geography segment analysis 2019 - 2023
      • Historic Market Size - Geography Segment 2019 - 2023 ($ billion)
    • 5.6 Country segment analysis 2019 - 2023
      • Historic Market Size - Country Segment 2019 - 2023 ($ billion)

    6 Qualitative Analysis

    • 6.1 The AI impact on global online ad spending market

      7 Five Forces Analysis

      • 7.1 Five forces summary
        • Five forces analysis - Comparison between 2024 and 2029
      • 7.2 Bargaining power of buyers
        • Bargaining power of buyers - Impact of key factors 2024 and 2029
      • 7.3 Bargaining power of suppliers
        • Bargaining power of suppliers - Impact of key factors in 2024 and 2029
      • 7.4 Threat of new entrants
        • Threat of new entrants - Impact of key factors in 2024 and 2029
      • 7.5 Threat of substitutes
        • Threat of substitutes - Impact of key factors in 2024 and 2029
      • 7.6 Threat of rivalry
        • Threat of rivalry - Impact of key factors in 2024 and 2029
      • 7.7 Market condition
        • Chart on Market condition - Five forces 2024 and 2029

      8 Market Segmentation by Platform

      • 8.1 Market segments
        • Chart on Platform - Market share 2024-2029 (%)
        • Data Table on Platform - Market share 2024-2029 (%)
      • 8.2 Comparison by Platform
        • Chart on Comparison by Platform
        • Data Table on Comparison by Platform
      • 8.3 Mobile devices - Market size and forecast 2024-2029
        • Chart on Mobile devices - Market size and forecast 2024-2029 ($ billion)
        • Data Table on Mobile devices - Market size and forecast 2024-2029 ($ billion)
        • Chart on Mobile devices - Year-over-year growth 2024-2029 (%)
        • Data Table on Mobile devices - Year-over-year growth 2024-2029 (%)
      • 8.4 Desktops - Market size and forecast 2024-2029
        • Chart on Desktops - Market size and forecast 2024-2029 ($ billion)
        • Data Table on Desktops - Market size and forecast 2024-2029 ($ billion)
        • Chart on Desktops - Year-over-year growth 2024-2029 (%)
        • Data Table on Desktops - Year-over-year growth 2024-2029 (%)
      • 8.5 Market opportunity by Platform
        • Market opportunity by Platform ($ billion)
        • Data Table on Market opportunity by Platform ($ billion)

      9 Market Segmentation by Application

      • 9.1 Market segments
        • Chart on Application - Market share 2024-2029 (%)
        • Data Table on Application - Market share 2024-2029 (%)
      • 9.2 Comparison by Application
        • Chart on Comparison by Application
        • Data Table on Comparison by Application
      • 9.3 Retail and e-commerce - Market size and forecast 2024-2029
        • Chart on Retail and e-commerce - Market size and forecast 2024-2029 ($ billion)
        • Data Table on Retail and e-commerce - Market size and forecast 2024-2029 ($ billion)
        • Chart on Retail and e-commerce - Year-over-year growth 2024-2029 (%)
        • Data Table on Retail and e-commerce - Year-over-year growth 2024-2029 (%)
      • 9.4 Healthcare and pharma - Market size and forecast 2024-2029
        • Chart on Healthcare and pharma - Market size and forecast 2024-2029 ($ billion)
        • Data Table on Healthcare and pharma - Market size and forecast 2024-2029 ($ billion)
        • Chart on Healthcare and pharma - Year-over-year growth 2024-2029 (%)
        • Data Table on Healthcare and pharma - Year-over-year growth 2024-2029 (%)
      • 9.5 Media and entertainment - Market size and forecast 2024-2029
        • Chart on Media and entertainment - Market size and forecast 2024-2029 ($ billion)
        • Data Table on Media and entertainment - Market size and forecast 2024-2029 ($ billion)
        • Chart on Media and entertainment - Year-over-year growth 2024-2029 (%)
        • Data Table on Media and entertainment - Year-over-year growth 2024-2029 (%)
      • 9.6 Travel and hospitality - Market size and forecast 2024-2029
        • Chart on Travel and hospitality - Market size and forecast 2024-2029 ($ billion)
        • Data Table on Travel and hospitality - Market size and forecast 2024-2029 ($ billion)
        • Chart on Travel and hospitality - Year-over-year growth 2024-2029 (%)
        • Data Table on Travel and hospitality - Year-over-year growth 2024-2029 (%)
      • 9.7 Others - Market size and forecast 2024-2029
        • Chart on Others - Market size and forecast 2024-2029 ($ billion)
        • Data Table on Others - Market size and forecast 2024-2029 ($ billion)
        • Chart on Others - Year-over-year growth 2024-2029 (%)
        • Data Table on Others - Year-over-year growth 2024-2029 (%)
      • 9.8 Market opportunity by Application
        • Market opportunity by Application ($ billion)
        • Data Table on Market opportunity by Application ($ billion)

      10 Market Segmentation by Type

      • 10.1 Market segments
        • Chart on Type - Market share 2024-2029 (%)
        • Data Table on Type - Market share 2024-2029 (%)
      • 10.2 Comparison by Type
        • Chart on Comparison by Type
        • Data Table on Comparison by Type
      • 10.3 Search Ads - Market size and forecast 2024-2029
        • Chart on Search Ads - Market size and forecast 2024-2029 ($ billion)
        • Data Table on Search Ads - Market size and forecast 2024-2029 ($ billion)
        • Chart on Search Ads - Year-over-year growth 2024-2029 (%)
        • Data Table on Search Ads - Year-over-year growth 2024-2029 (%)
      • 10.4 Social Media Ads - Market size and forecast 2024-2029
        • Chart on Social Media Ads - Market size and forecast 2024-2029 ($ billion)
        • Data Table on Social Media Ads - Market size and forecast 2024-2029 ($ billion)
        • Chart on Social Media Ads - Year-over-year growth 2024-2029 (%)
        • Data Table on Social Media Ads - Year-over-year growth 2024-2029 (%)
      • 10.5 Display Ads - Market size and forecast 2024-2029
        • Chart on Display Ads - Market size and forecast 2024-2029 ($ billion)
        • Data Table on Display Ads - Market size and forecast 2024-2029 ($ billion)
        • Chart on Display Ads - Year-over-year growth 2024-2029 (%)
        • Data Table on Display Ads - Year-over-year growth 2024-2029 (%)
      • 10.6 Video Ads - Market size and forecast 2024-2029
        • Chart on Video Ads - Market size and forecast 2024-2029 ($ billion)
        • Data Table on Video Ads - Market size and forecast 2024-2029 ($ billion)
        • Chart on Video Ads - Year-over-year growth 2024-2029 (%)
        • Data Table on Video Ads - Year-over-year growth 2024-2029 (%)
      • 10.7 Others - Market size and forecast 2024-2029
        • Chart on Others - Market size and forecast 2024-2029 ($ billion)
        • Data Table on Others - Market size and forecast 2024-2029 ($ billion)
        • Chart on Others - Year-over-year growth 2024-2029 (%)
        • Data Table on Others - Year-over-year growth 2024-2029 (%)
      • 10.8 Market opportunity by Type
        • Market opportunity by Type ($ billion)
        • Data Table on Market opportunity by Type ($ billion)

      11 Customer Landscape

      • 11.1 Customer landscape overview
        • Analysis of price sensitivity, lifecycle, customer purchase basket, adoption rates, and purchase criteria

      12 Geographic Landscape

      • 12.1 Geographic segmentation
        • Chart on Market share by geography 2024-2029 (%)
        • Data Table on Market share by geography 2024-2029 (%)
      • 12.2 Geographic comparison
        • Chart on Geographic comparison
        • Data Table on Geographic comparison
      • 12.3 North America - Market size and forecast 2024-2029
        • Chart on North America - Market size and forecast 2024-2029 ($ billion)
        • Data Table on North America - Market size and forecast 2024-2029 ($ billion)
        • Chart on North America - Year-over-year growth 2024-2029 (%)
        • Data Table on North America - Year-over-year growth 2024-2029 (%)
      • 12.4 APAC - Market size and forecast 2024-2029
        • Chart on APAC - Market size and forecast 2024-2029 ($ billion)
        • Data Table on APAC - Market size and forecast 2024-2029 ($ billion)
        • Chart on APAC - Year-over-year growth 2024-2029 (%)
        • Data Table on APAC - Year-over-year growth 2024-2029 (%)
      • 12.5 Europe - Market size and forecast 2024-2029
        • Chart on Europe - Market size and forecast 2024-2029 ($ billion)
        • Data Table on Europe - Market size and forecast 2024-2029 ($ billion)
        • Chart on Europe - Year-over-year growth 2024-2029 (%)
        • Data Table on Europe - Year-over-year growth 2024-2029 (%)
      • 12.6 South America - Market size and forecast 2024-2029
        • Chart on South America - Market size and forecast 2024-2029 ($ billion)
        • Data Table on South America - Market size and forecast 2024-2029 ($ billion)
        • Chart on South America - Year-over-year growth 2024-2029 (%)
        • Data Table on South America - Year-over-year growth 2024-2029 (%)
      • 12.7 Middle East and Africa - Market size and forecast 2024-2029
        • Chart on Middle East and Africa - Market size and forecast 2024-2029 ($ billion)
        • Data Table on Middle East and Africa - Market size and forecast 2024-2029 ($ billion)
        • Chart on Middle East and Africa - Year-over-year growth 2024-2029 (%)
        • Data Table on Middle East and Africa - Year-over-year growth 2024-2029 (%)
      • 12.8 US - Market size and forecast 2024-2029
        • Chart on US - Market size and forecast 2024-2029 ($ billion)
        • Data Table on US - Market size and forecast 2024-2029 ($ billion)
        • Chart on US - Year-over-year growth 2024-2029 (%)
        • Data Table on US - Year-over-year growth 2024-2029 (%)
      • 12.9 China - Market size and forecast 2024-2029
        • Chart on China - Market size and forecast 2024-2029 ($ billion)
        • Data Table on China - Market size and forecast 2024-2029 ($ billion)
        • Chart on China - Year-over-year growth 2024-2029 (%)
        • Data Table on China - Year-over-year growth 2024-2029 (%)
      • 12.10 Canada - Market size and forecast 2024-2029
        • Chart on Canada - Market size and forecast 2024-2029 ($ billion)
        • Data Table on Canada - Market size and forecast 2024-2029 ($ billion)
        • Chart on Canada - Year-over-year growth 2024-2029 (%)
        • Data Table on Canada - Year-over-year growth 2024-2029 (%)
      • 12.11 UK - Market size and forecast 2024-2029
        • Chart on UK - Market size and forecast 2024-2029 ($ billion)
        • Data Table on UK - Market size and forecast 2024-2029 ($ billion)
        • Chart on UK - Year-over-year growth 2024-2029 (%)
        • Data Table on UK - Year-over-year growth 2024-2029 (%)
      • 12.12 Japan - Market size and forecast 2024-2029
        • Chart on Japan - Market size and forecast 2024-2029 ($ billion)
        • Data Table on Japan - Market size and forecast 2024-2029 ($ billion)
        • Chart on Japan - Year-over-year growth 2024-2029 (%)
        • Data Table on Japan - Year-over-year growth 2024-2029 (%)
      • 12.13 Brazil - Market size and forecast 2024-2029
        • Chart on Brazil - Market size and forecast 2024-2029 ($ billion)
        • Data Table on Brazil - Market size and forecast 2024-2029 ($ billion)
        • Chart on Brazil - Year-over-year growth 2024-2029 (%)
        • Data Table on Brazil - Year-over-year growth 2024-2029 (%)
      • 12.14 Mexico - Market size and forecast 2024-2029
        • Chart on Mexico - Market size and forecast 2024-2029 ($ billion)
        • Data Table on Mexico - Market size and forecast 2024-2029 ($ billion)
        • Chart on Mexico - Year-over-year growth 2024-2029 (%)
        • Data Table on Mexico - Year-over-year growth 2024-2029 (%)
      • 12.15 Germany - Market size and forecast 2024-2029
        • Chart on Germany - Market size and forecast 2024-2029 ($ billion)
        • Data Table on Germany - Market size and forecast 2024-2029 ($ billion)
        • Chart on Germany - Year-over-year growth 2024-2029 (%)
        • Data Table on Germany - Year-over-year growth 2024-2029 (%)
      • 12.16 India - Market size and forecast 2024-2029
        • Chart on India - Market size and forecast 2024-2029 ($ billion)
        • Data Table on India - Market size and forecast 2024-2029 ($ billion)
        • Chart on India - Year-over-year growth 2024-2029 (%)
        • Data Table on India - Year-over-year growth 2024-2029 (%)
      • 12.17 France - Market size and forecast 2024-2029
        • Chart on France - Market size and forecast 2024-2029 ($ billion)
        • Data Table on France - Market size and forecast 2024-2029 ($ billion)
        • Chart on France - Year-over-year growth 2024-2029 (%)
        • Data Table on France - Year-over-year growth 2024-2029 (%)
      • 12.18 Market opportunity by geography
        • Market opportunity by geography ($ billion)
        • Data Tables on Market opportunity by geography ($ billion)

      13 Drivers, Challenges, and Opportunity/Restraints

      • 13.1 Market drivers
        • 13.2 Market challenges
          • 13.3 Impact of drivers and challenges
            • Impact of drivers and challenges in 2024 and 2029
          • 13.4 Market opportunities/restraints

            14 Competitive Landscape

            • 14.1 Overview
              • 14.2 Competitive Landscape
                • Overview on criticality of inputs and factors of differentiation
              • 14.3 Landscape disruption
                • Overview on factors of disruption
              • 14.4 Industry risks
                • Impact of key risks on business

              15 Competitive Analysis

              • 15.1 Companies profiled
                • Companies covered
              • 15.2 Company ranking index
                • Company ranking index
              • 15.3 Market positioning of companies
                • Matrix on companies position and classification
              • 15.4 Alibaba Group Holding Ltd.
                • Alibaba Group Holding Ltd. - Overview
                • Alibaba Group Holding Ltd. - Business segments
                • Alibaba Group Holding Ltd. - Key news
                • Alibaba Group Holding Ltd. - Key offerings
                • Alibaba Group Holding Ltd. - Segment focus
                • SWOT
              • 15.5 Alphabet Inc.
                • Alphabet Inc. - Overview
                • Alphabet Inc. - Business segments
                • Alphabet Inc. - Key offerings
                • Alphabet Inc. - Segment focus
                • SWOT
              • 15.6 Amazon.com Inc.
                • Amazon.com Inc. - Overview
                • Amazon.com Inc. - Business segments
                • Amazon.com Inc. - Key news
                • Amazon.com Inc. - Key offerings
                • Amazon.com Inc. - Segment focus
                • SWOT
              • 15.7 Baidu Inc.
                • Baidu Inc. - Overview
                • Baidu Inc. - Business segments
                • Baidu Inc. - Key offerings
                • Baidu Inc. - Segment focus
                • SWOT
              • 15.8 Dentsu Group Inc.
                • Dentsu Group Inc. - Overview
                • Dentsu Group Inc. - Business segments
                • Dentsu Group Inc. - Key offerings
                • Dentsu Group Inc. - Segment focus
                • SWOT
              • 15.9 Digital Turbine Inc.
                • Digital Turbine Inc. - Overview
                • Digital Turbine Inc. - Business segments
                • Digital Turbine Inc. - Key offerings
                • Digital Turbine Inc. - Segment focus
                • SWOT
              • 15.10 Eniro AB
                • Eniro AB - Overview
                • Eniro AB - Product / Service
                • Eniro AB - Key offerings
                • SWOT
              • 15.11 GroupM
                • GroupM - Overview
                • GroupM - Product / Service
                • GroupM - Key offerings
                • SWOT
              • 15.12 Hakuhodo DY Media Partners Inc. Co. Ltd.
                • Hakuhodo DY Media Partners Inc. Co. Ltd. - Overview
                • Hakuhodo DY Media Partners Inc. Co. Ltd. - Product / Service
                • Hakuhodo DY Media Partners Inc. Co. Ltd. - Key offerings
                • SWOT
              • 15.13 Meta Platforms Inc.
                • Meta Platforms Inc. - Overview
                • Meta Platforms Inc. - Business segments
                • Meta Platforms Inc. - Key news
                • Meta Platforms Inc. - Key offerings
                • Meta Platforms Inc. - Segment focus
                • SWOT
              • 15.14 Microsoft Corp.
                • Microsoft Corp. - Overview
                • Microsoft Corp. - Business segments
                • Microsoft Corp. - Key news
                • Microsoft Corp. - Key offerings
                • Microsoft Corp. - Segment focus
                • SWOT
              • 15.15 Tencent Holdings Ltd.
                • Tencent Holdings Ltd. - Overview
                • Tencent Holdings Ltd. - Business segments
                • Tencent Holdings Ltd. - Key news
                • Tencent Holdings Ltd. - Key offerings
                • Tencent Holdings Ltd. - Segment focus
                • SWOT
              • 15.16 The Interpublic Group of Companies Inc.
                • The Interpublic Group of Companies Inc. - Overview
                • The Interpublic Group of Companies Inc. - Business segments
                • The Interpublic Group of Companies Inc. - Key offerings
                • The Interpublic Group of Companies Inc. - Segment focus
                • SWOT
              • 15.17 Yahoo B2B
                • Yahoo B2B - Overview
                • Yahoo B2B - Product / Service
                • Yahoo B2B - Key offerings
                • SWOT
              • 15.18 X Corp.
                • X Corp. - Overview
                • X Corp. - Product / Service
                • X Corp. - Key offerings
                • SWOT

              16 Appendix

              • 16.1 Scope of the report
                • 16.2 Inclusions and exclusions checklist
                  • Inclusions checklist
                  • Exclusions checklist
                • 16.3 Currency conversion rates for US$
                  • Currency conversion rates for US$
                • 16.4 Research methodology
                  • Research methodology
                • 16.5 Data procurement
                  • Information sources
                • 16.6 Data validation
                  • Data validation
                • 16.7 Validation techniques employed for market sizing
                  • Validation techniques employed for market sizing
                • 16.8 Data synthesis
                  • Data synthesis
                • 16.9 360 degree market analysis
                  • 360 degree market analysis
                • 16.10 List of abbreviations
                  • List of abbreviations

                Research Methodology

                Technavio presents a detailed picture of the market by way of study, synthesis, and summation of data from multiple sources. The analysts have presented the various facets of the market with a particular focus on identifying the key industry influencers. The data thus presented is comprehensive, reliable, and the result of extensive research, both primary and secondary.

                INFORMATION SOURCES

                Primary sources

                • Manufacturers and suppliers
                • Channel partners
                • Industry experts
                • Strategic decision makers

                Secondary sources

                • Industry journals and periodicals
                • Government data
                • Financial reports of key industry players
                • Historical data
                • Press releases

                DATA ANALYSIS

                Data Synthesis

                • Collation of data
                • Estimation of key figures
                • Analysis of derived insights

                Data Validation

                • Triangulation with data models
                • Reference against proprietary databases
                • Corroboration with industry experts

                REPORT WRITING

                Qualitative

                • Market drivers
                • Market challenges
                • Market trends
                • Five forces analysis

                Quantitative

                • Market size and forecast
                • Market segmentation
                • Geographical insights
                • Competitive landscape

                Interested in this report?

                Get your sample now to see our research methodology and insights!

                Download Now

                Frequently Asked Questions

                Online Ad Spending market growth will increase by $ 286.6 bn during 2025-2029.

                The Online Ad Spending market is expected to grow at a CAGR of 11.7% during 2025-2029.

                Online Ad Spending market is segmented by Platform( Mobile devices, Desktops) Application( Retail and e-commerce, Healthcare and pharma, Media and entertainment, Travel and hospitality, Others) Type( Search Ads, Social Media Ads, Display Ads, Video Ads, Others)

                Alibaba Group Holding Ltd., Alphabet Inc., Amazon.com Inc., Baidu Inc., Dentsu Group Inc., Digital Turbine Inc., Eniro AB, GroupM, Hakuhodo DY Media Partners Inc. Co. Ltd., InterActiveCorp, Meta Platforms Inc., Microsoft Corp., SXM Media, Tencent Holdings Ltd., The Interpublic Group of Companies Inc., Yahoo B2B, X Corp. are a few of the key vendors in the Online Ad Spending market.

                North America will register the highest growth rate of 43% among the other regions. Therefore, the Online Ad Spending market in North America is expected to garner significant business opportunities for the vendors during the forecast period.

                US, China, Canada, UK, Japan, Mexico, Brazil, Germany, India, France

                • Decline in offline ad spendingThe spending on traditional/offline advertising is the driving factor this market.
                • including magazines is the driving factor this market.
                • newspapers is the driving factor this market.
                • mail is the driving factor this market.
                • radio is the driving factor this market.
                • out-of-home (OOH) is the driving factor this market.
                • and cinema is the driving factor this market.
                • has been declining in recent years. Digital advertising is cheaper when compared to offline advertising and is affordable for small-sized businesses. It is rapidly occupying the share of offline advertising. The decline in ad spending on offline advertising will contribute to the growth of the global online ad spending market during the forecast period. The share of print advertising is the driving factor this market.
                • which includes ads placed in newspapers and magazines is the driving factor this market.
                • has been declining. Due to the emergence of e-papers and e-magazines is the driving factor this market.
                • the sales of newspapers and magazines have declined. In India is the driving factor this market.
                • the average issue readership of several leading newspapers has declined in recent years. The decline in offline advertising spending in 2024 reflects a broader structural shift in the advertising industry. Traditional media channels experienced reduced allocation of marketing budgets as advertisers prioritized platforms that offer greater measurability and audience targeting. This reallocation of resources was driven by the need for more efficient return on investment and the ability to track consumer engagement in real time. Print media is the driving factor this market.
                • including newspapers and magazines is the driving factor this market.
                • encountered diminished advertiser interest due to declining readership and limited interactivity. The static nature of these formats is the driving factor this market.
                • combined with reduced circulation is the driving factor this market.
                • contributed to a contraction in demand. Advertisers increasingly favored channels that support dynamic content and immediate feedback mechanisms. Broadcast media is the driving factor this market.
                • such as radio and linear television is the driving factor this market.
                • also faced reduced spending. The fragmentation of audiences across multiple platforms and the rise of on-demand content consumption weakened the effectiveness of traditional broadcast schedules. As a result is the driving factor this market.
                • advertisers shifted focus toward environments that support personalized messaging and adaptive campaign strategies. Out-of-home advertising is the driving factor this market.
                • while still visible in urban environments is the driving factor this market.
                • experienced a decline in investment due to limited attribution capabilities and challenges in measuring campaign effectiveness. The static and location-bound nature of this medium restricted its ability to adapt to rapidly changing consumer behaviors and preferences. Direct mail is the driving factor this market.
                • once a staple of targeted marketing is the driving factor this market.
                • saw reduced utilization as digital alternatives offered more cost-effective and scalable solutions. The logistical costs associated with production and distribution is the driving factor this market.
                • combined with lower response rates is the driving factor this market.
                • contributed to its diminished role in integrated marketing strategies. Overall is the driving factor this market.
                • the decline in offline advertising spending in 2024 was characterized by a strategic reorientation toward platforms that support data-driven decision-making is the driving factor this market.
                • real-time optimization is the driving factor this market.
                • and measurable outcomes. Thus is the driving factor this market.
                • the decline in offline ad spending will positively impact the growth of the global online ad spending market during the forecast period. is the driving factor this market.

                The Online Ad Spending market vendors should focus on grabbing business opportunities from the Mobile devices segment as it accounted for the largest market share in the base year.