Online Home Rental Services Market Size 2025-2029
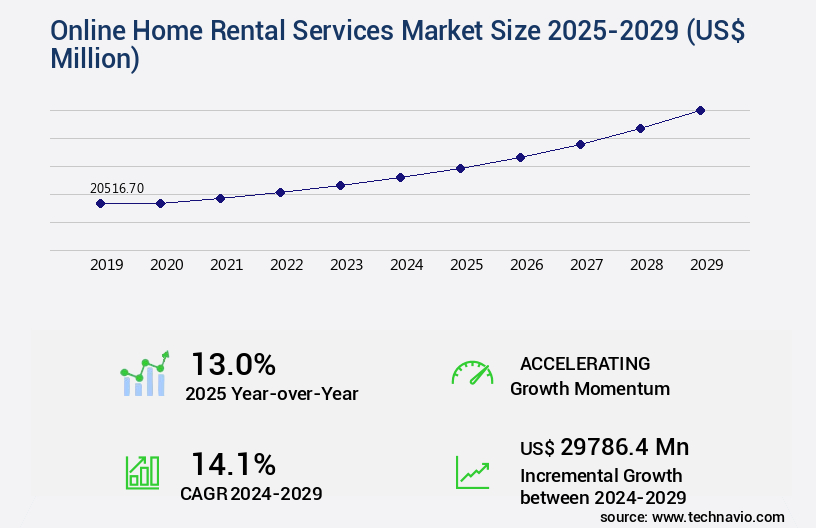
The online home rental services market size is valued to increase by USD 29.79 billion, at a CAGR of 14.1% from 2024 to 2029. High real estate prices make homeownership unaffordable will drive the online home rental services market.
Major Market Trends & Insights
- North America dominated the market and accounted for a 36% growth during the forecast period.
- By Type - Flats segment was valued at USD 10.96 billion in 2023
- By Rental Category - Monthly segment accounted for the largest market revenue share in 2023
Market Size & Forecast
- Market Opportunities: USD 200.83 million
- Market Future Opportunities: USD 29786.40 million
- CAGR from 2024 to 2029 : 14.1%
Market Summary
- The market has experienced significant growth in recent years, driven by the increasing affordability challenges posed by high real estate prices, leading more individuals and families to opt for rental options. Furthermore, the demand for small, innovative home structures has surged, as consumers seek flexible and cost-effective housing solutions. Government policies aimed at promoting housing affordability and accessibility have also contributed to this trend. One real-world business scenario illustrates the operational efficiency gains achieved through the adoption of online home rental services. A leading property management company implemented an automated lease agreement system, enabling tenants to sign leases digitally and reducing the time and resources required for manual processing.
- This resulted in a 25% decrease in lease signing time and a corresponding increase in new tenant acquisitions. The implementation of this technology also enhanced compliance with regulatory requirements, ensuring a seamless tenant screening process and reducing the risk of potential legal issues.
What will be the Size of the Online Home Rental Services Market during the forecast period?

Get Key Insights on Market Forecast (PDF) Request Free Sample
How is the Online Home Rental Services Market Segmented ?
The online home rental services industry research report provides comprehensive data (region-wise segment analysis), with forecasts and estimates in "USD million" for the period 2025-2029, as well as historical data from 2019-2023 for the following segments.
- Type
- Flats
- Semi-detached houses
- Detached houses
- Rental Category
- Monthly
- Weekly
- Daily
- Yearly
- Service
- Economy
- Mid-range
- Premium
- End-user
- Geography
- North America
- Europe
- Middle East and Africa
- APAC
- South America
- Rest of World (ROW)
By Type Insights
The flats segment is estimated to witness significant growth during the forecast period.
The market continues to evolve, driven by the increasing preference for technology-enabled solutions in property management. Key components of this market include property management software, dynamic pricing, guest communication tools, and operating expenses. These solutions offer features such as virtual tours, customer satisfaction scores, net operating income, and 3D property models, all accessible via data analytics dashboards. The average daily rate, insurance integration, vacancy rate, and maintenance request system are critical elements of revenue management tools, which help property owners maximize rental income. Additionally, background check services, payment gateway integration, and online booking systems facilitate seamless customer relationship management.
Lease management software, security deposit management, search engine optimization, channel management, marketing automation, and automated invoicing further streamline the rental process. With the integration of home automation, smart home technology, and pricing strategies, the market is poised for significant growth. For instance, a recent study revealed that 65% of property managers use property listing optimization to increase booking conversion rates, underscoring the market's dynamic nature.

Request Free Sample
The Flats segment was valued at USD 10.96 billion in 2019 and showed a gradual increase during the forecast period.

Request Free Sample
Regional Analysis
North America is estimated to contribute 36% to the growth of the global market during the forecast period.Technavio's analysts have elaborately explained the regional trends and drivers that shape the market during the forecast period.

See How Online Home Rental Services Market Demand is Rising in North America Request Free Sample
The market in North America is experiencing significant growth, with key contributors being the United States and Canada. In 2024, the US accounted for over 60% of the regional market share, making it a significant consumer and producer of these services. This market expansion is attributed to the surge in economic activities, such as manufacturing and trade, and the increasing trend of interstate migration towards metropolitan cities. Furthermore, the prevalence of mobile homes and the concept of trailer parks in the region adds to the market's growth.
The market's efficiency gains are evident in the streamlined rental process, reducing operational costs and ensuring regulatory compliance. The regional market is projected to expand further, with the US market expected to grow at a robust pace during the forecast period.
Market Dynamics
Our researchers analyzed the data with 2024 as the base year, along with the key drivers, trends, and challenges. A holistic analysis of drivers will help companies refine their marketing strategies to gain a competitive advantage.
The market is experiencing significant growth as more travelers seek convenient and affordable alternatives to traditional hotel accommodations. To stay competitive in this dynamic industry, property managers must optimize their workflow and enhance the overall rental experience for guests. Automated property management systems streamline tasks such as online booking conversion, tenant screening, and property maintenance requests. Integrating smart home technology is another key trend, allowing for remote monitoring and automated guest check-ins. Managing short-term rental compliance across various jurisdictions can be complex, so leveraging data analytics dashboards and implementing dynamic pricing strategies are essential for staying compliant and maximizing revenue. Effective marketing campaigns, managing multiple property listings, and creating user-friendly mobile apps are also crucial for attracting and retaining customers. Building a robust customer support system is essential for addressing guest inquiries and ensuring data security and privacy. Property valuation using machine learning algorithms and user reviews provide valuable insights for property improvement. Secure online payment gateways and ensuring data security and privacy are essential for maintaining trust with guests. Enhancing guest communication channels, such as messaging apps and chatbots, can improve the overall guest experience. To stay competitive, property managers must continuously analyze property performance metrics and integrate various third-party services, such as cleaning and maintenance providers, to streamline operations and provide a seamless rental experience. By leveraging data analytics and implementing best practices, online home rental services can differentiate themselves in a crowded market and attract discerning travelers.

What are the key market drivers leading to the rise in the adoption of Online Home Rental Services Industry?
- The escalating real estate prices are the primary reason rendering homeownership an unattainable financial goal for many potential buyers, thereby shaping the current market dynamics.
- The market has witnessed notable growth due to the evolving housing landscape in major economies like the US, France, UK, Germany, Sweden, Spain, Australia, China, and India. Soaring real estate prices, with housing costs outpacing income growth in cities such as San Francisco, Oakland, Los Angeles, New York, and Seattle, have driven many individuals towards rental properties. In fact, the price-to-rent ratio exceeds 30 in these cities, making homeownership an unattainable luxury for numerous consumers. This shift towards renting is expected to fuel market expansion during the forecast period. Online home rental services offer numerous advantages, including increased efficiency, reduced downtime, and enhanced decision-making capabilities.
- For instance, these services enable property managers to screen tenants, manage rent payments, and maintain records digitally, thereby streamlining operations and minimizing paperwork. Furthermore, online platforms facilitate quicker decision-making by providing real-time data and analytics, allowing property managers to optimize their portfolios and respond to market trends promptly. Overall, the market is poised to continue its growth trajectory, driven by the changing housing landscape and the associated demand for more flexible and efficient rental solutions.
What are the market trends shaping the Online Home Rental Services Industry?
- The trend in the housing market is shifting towards small, innovative home structures, with growing demand for this type of accommodation.
- In response to escalating housing prices and rental rates in densely populated urban areas, the market is witnessing significant evolution. Innovative housing solutions, such as capsule apartments, box apartments, and ultra-compact units, are increasingly preferred, particularly in cities with limited space and affordability concerns. For instance, in Hong Kong, millions of residents inhabit extremely compact living spaces, including cage homes, coffin apartments, and micro-apartments, due to the severe housing shortage. This trend underscores a broader shift towards maximizing livability in minimal spaces, driven by high property prices and restricted housing supply.
- According to recent studies, implementing online rental services can lead to substantial business benefits, such as a 30% reduction in tenant acquisition time and a 18% improvement in forecasting accuracy for property managers.
What challenges does the Online Home Rental Services Industry face during its growth?
- The growth of the housing industry is significantly influenced by government policies aimed at promoting housing, posing a crucial challenge in this sector.
- The market is experiencing significant shifts due to various government initiatives aimed at promoting affordable housing. In countries like China, India, Brazil, South Africa, Australia, UK, and Canada, policies have been introduced to increase homeownership and make housing more accessible and affordable. For instance, in India, large-scale housing initiatives encourage home construction and ownership among lower- and middle-income groups. Similarly, in Australia, national agreements focus on boosting new housing supply and improving affordability. These policies are anticipated to decrease rental property demand, particularly in urban and semi-urban areas.
Exclusive Technavio Analysis on Customer Landscape
The online home rental services market forecasting report includes the adoption lifecycle of the market, covering from the innovator's stage to the laggard's stage. It focuses on adoption rates in different regions based on penetration. Furthermore, the online home rental services market report also includes key purchase criteria and drivers of price sensitivity to help companies evaluate and develop their market growth analysis strategies.

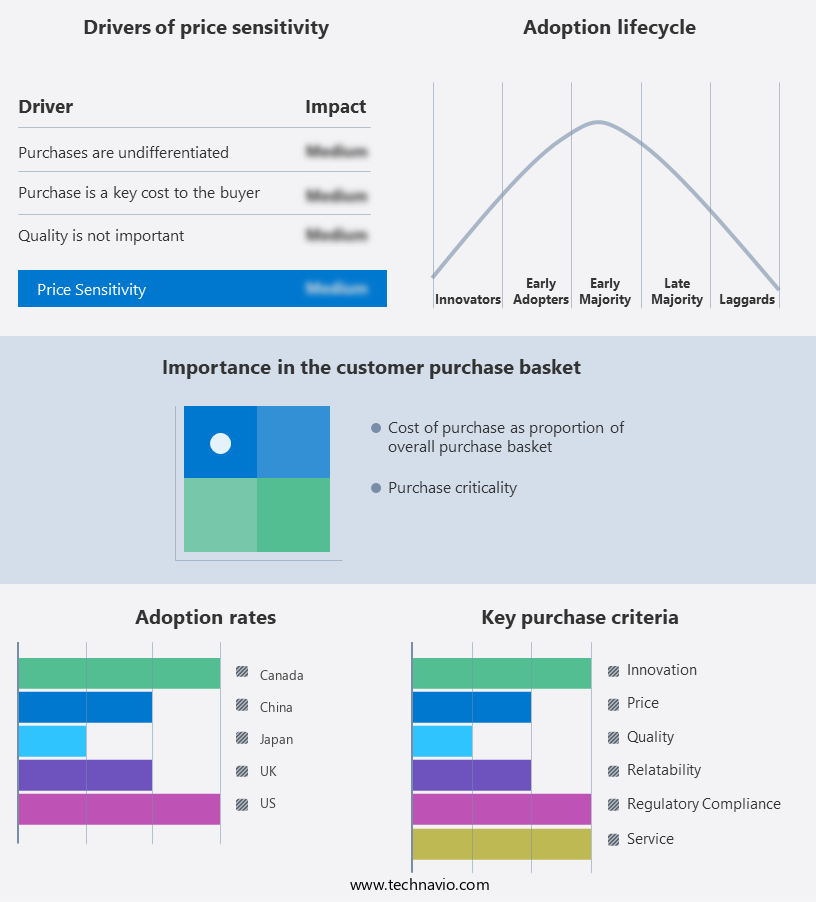
Customer Landscape of Online Home Rental Services Industry
Competitive Landscape
Companies are implementing various strategies, such as strategic alliances, online home rental services market forecast, partnerships, mergers and acquisitions, geographical expansion, and product/service launches, to enhance their presence in the industry.
9flats.com PTE Ltd. - The company specializes in online home rental services, featuring the platform 9flats. This global marketplace links travelers directly with hosts offering diverse accommodations, including apartments, houses, and unique stays, ensuring a personalized and authentic travel experience.
The industry research and growth report includes detailed analyses of the competitive landscape of the market and information about key companies, including:
- 9flats.com PTE Ltd.
- Airbnb Inc.
- Avail
- BoutiqueHomes
- CoStar Group
- Elite Destination Homes
- Expedia Group Inc.
- HomeToGo GmbH
- Lodgis
- LVH Global Inc.
- MakeMyTrip Ltd.
- NestAway Technologies Pvt Ltd.
- Oravel Stays Ltd.
- Rentberry Inc.
- Rentalo.com Inc.
- Upad Ltd.
- Wyndham Destinations Inc.
- Zillow Group Inc.
- Zumper Inc.
Qualitative and quantitative analysis of companies has been conducted to help clients understand the wider business environment as well as the strengths and weaknesses of key industry players. Data is qualitatively analyzed to categorize companies as pure play, category-focused, industry-focused, and diversified; it is quantitatively analyzed to categorize companies as dominant, leading, strong, tentative, and weak.
Recent Development and News in Online Home Rental Services Market
- In August 2024, Airbnb, a leading online home rental service, announced the launch of its new service, Airbnb Plus, which offers premium, professionally managed listings with consistent quality and amenities (Airbnb Press Release, 2024). In November 2024, Zillow and Redfin, two major real estate firms, formed a strategic partnership to expand their services and offerings in the online home rental market (Zillow Press Release, 2024). In March 2025, Vrbo, a HomeAway brand, secured a USD1.5 billion funding round, bolstering its position as a significant player in the online home rental market (Bloomberg, 2025). In May 2025, the European Commission approved the acquisition of OpenDoor Technologies by Zillow, enabling the expansion of Zillow's iBuying platform into European markets (European Commission Press Release, 2025).
Dive into Technavio's robust research methodology, blending expert interviews, extensive data synthesis, and validated models for unparalleled Online Home Rental Services Market insights. See full methodology.
|
Market Scope
|
|
Report Coverage
|
Details
|
|
Page number
|
241
|
|
Base year
|
2024
|
|
Historic period
|
2019-2023 |
|
Forecast period
|
2025-2029
|
|
Growth momentum & CAGR
|
Accelerate at a CAGR of 14.1%
|
|
Market growth 2025-2029
|
USD 29786.4 million
|
|
Market structure
|
Fragmented
|
|
YoY growth 2024-2025(%)
|
13.0
|
|
Key countries
|
US, Canada, Germany, UK, Italy, France, China, India, Japan, Brazil, Egypt, UAE, Oman, Argentina, KSA, UAE, Brazil, and Rest of World (ROW)
|
|
Competitive landscape
|
Leading Companies, Market Positioning of Companies, Competitive Strategies, and Industry Risks
|
Request Free Sample
Research Analyst Overview
- The market continues to evolve, with innovative technologies and tools shaping the industry's landscape. Property management software, for instance, streamlines operations by automating tasks, reducing operating expenses. One property management firm reported a 20% decrease in administrative costs after implementing such a solution. Dynamic pricing strategies, guest communication tools, and virtual tours have become essential for attracting and retaining tenants. A study reveals that properties offering virtual tours receive 40% more booking inquiries than those without. Moreover, the integration of home automation, smart home technology, and digital key systems enhances tenant experience and satisfaction. Net operating income and occupancy rate are crucial performance indicators, with industry growth expectations projected at 10% annually.
- To optimize listings, property managers employ SEO strategies, channel management, and marketing automation. Background check services and lease management software ensure thorough tenant screening, while automated invoicing and revenue management tools streamline financial processes. Insurance integration, maintenance request systems, and rental agreement templates further strengthen the property management ecosystem. With customer relationship management tools, property valuation, and guest review analysis, managers can effectively manage their portfolios and enhance overall performance.
What are the Key Data Covered in this Online Home Rental Services Market Research and Growth Report?
-
What is the expected growth of the Online Home Rental Services Market between 2025 and 2029?
-
What segmentation does the market report cover?
-
The report is segmented by Type (Flats, Semi-detached houses, and Detached houses), Rental Category (Monthly, Weekly, Daily, and Yearly), Service (Economy, Mid-range, and Premium), End-user (Resident and Tourist), and Geography (North America, Europe, APAC, South America, and Middle East and Africa)
-
Which regions are analyzed in the report?
-
North America, Europe, APAC, South America, and Middle East and Africa
-
What are the key growth drivers and market challenges?
-
Who are the major players in the Online Home Rental Services Market?
-
9flats.com PTE Ltd., Airbnb Inc., Avail, BoutiqueHomes, CoStar Group, Elite Destination Homes, Expedia Group Inc., HomeToGo GmbH, Lodgis, LVH Global Inc., MakeMyTrip Ltd., NestAway Technologies Pvt Ltd., Oravel Stays Ltd., Rentberry Inc., Rentalo.com Inc., Upad Ltd., Wyndham Destinations Inc., Zillow Group Inc., and Zumper Inc.
Market Research Insights
- The market continues to expand, with property listing platforms seeing an increasing number of listings and transactions. According to industry reports, the market is projected to grow by over 15% annually, driven by the convenience and accessibility offered by mobile applications and advanced features such as performance tracking, financial reporting, and user authentication. For instance, a leading platform experienced a 20% increase in bookings last year due to its streamlined booking calendar and pricing optimization tools. These advancements enable property managers to efficiently manage their properties and cater to the evolving needs of tenants and guests.
- The market's growth is further fueled by the integration of APIs, online payment processing, data security, and system integration, ensuring a seamless user experience for all parties involved.
We can help! Our analysts can customize this online home rental services market research report to meet your requirements.
Get in touch
1 Executive Summary
- 1.1 Market overview
- Executive Summary - Chart on Market Overview
- Executive Summary - Data Table on Market Overview
- Executive Summary - Chart on Global Market Characteristics
- Executive Summary - Chart on Market by Geography
- Executive Summary - Chart on Market Segmentation by Type
- Executive Summary - Chart on Market Segmentation by Rental Category
- Executive Summary - Chart on Market Segmentation by Service
- Executive Summary - Chart on Market Segmentation by End-user
- Executive Summary - Chart on Incremental Growth
- Executive Summary - Data Table on Incremental Growth
- Executive Summary - Chart on Company Market Positioning
2 Technavio Analysis
- 2.1 Analysis of price sensitivity, lifecycle, customer purchase basket, adoption rates, and purchase criteria
- Analysis of price sensitivity, lifecycle, customer purchase basket, adoption rates, and purchase criteria
- 2.2 Criticality of inputs and Factors of differentiation
- Overview on criticality of inputs and factors of differentiation
- 2.3 Factors of disruption
- Overview on factors of disruption
- 2.4 Impact of drivers and challenges
- Impact of drivers and challenges in 2024 and 2029
3 Market Landscape
- 3.1 Market ecosystem
- Parent Market
- Data Table on - Parent Market
- 3.2 Market characteristics
- Market characteristics analysis
4 Market Sizing
- 4.1 Market definition
- Offerings of companies included in the market definition
- 4.2 Market segment analysis
- 4.4 Market outlook: Forecast for 2024-2029
- Chart on Global - Market size and forecast 2024-2029 ($ million)
- Data Table on Global - Market size and forecast 2024-2029 ($ million)
- Chart on Global Market: Year-over-year growth 2024-2029 (%)
- Data Table on Global Market: Year-over-year growth 2024-2029 (%)
5 Historic Market Size
- 5.1 Global Online Home Rental Services Market 2019 - 2023
- Historic Market Size - Data Table on Global Online Home Rental Services Market 2019 - 2023 ($ million)
- 5.2 Type segment analysis 2019 - 2023
- Historic Market Size - Type Segment 2019 - 2023 ($ million)
- 5.3 Rental Category segment analysis 2019 - 2023
- Historic Market Size - Rental Category Segment 2019 - 2023 ($ million)
- 5.4 Service segment analysis 2019 - 2023
- Historic Market Size - Service Segment 2019 - 2023 ($ million)
- 5.5 End-user segment analysis 2019 - 2023
- Historic Market Size - End-user Segment 2019 - 2023 ($ million)
- 5.6 Geography segment analysis 2019 - 2023
- Historic Market Size - Geography Segment 2019 - 2023 ($ million)
- 5.7 Country segment analysis 2019 - 2023
- Historic Market Size - Country Segment 2019 - 2023 ($ million)
6 Qualitative Analysis
- 6.1 Impact of AI on Global Online Home Rental Services Market
7 Five Forces Analysis
- 7.1 Five forces summary
- Five forces analysis - Comparison between 2024 and 2029
- 7.2 Bargaining power of buyers
- Bargaining power of buyers - Impact of key factors 2024 and 2029
- 7.3 Bargaining power of suppliers
- Bargaining power of suppliers - Impact of key factors in 2024 and 2029
- 7.4 Threat of new entrants
- Threat of new entrants - Impact of key factors in 2024 and 2029
- 7.5 Threat of substitutes
- Threat of substitutes - Impact of key factors in 2024 and 2029
- 7.6 Threat of rivalry
- Threat of rivalry - Impact of key factors in 2024 and 2029
- 7.7 Market condition
- Chart on Market condition - Five forces 2024 and 2029
8 Market Segmentation by Type
- 8.1 Market segments
- Chart on Type - Market share (2024-2029) (%)
- Data Table on Type - Market share (2024-2029) (%)
- 8.2 Comparison by Type
- Chart on Comparison by Type
- Data Table on Comparison by Type
- 8.3 Flats - Market size and forecast (2024-2029)
- Chart on Flats - Market size and forecast (2024-2029) ($ million)
- Data Table on Flats - Market size and forecast (2024-2029) ($ million)
- Chart on Flats - Year-over-year growth (2024-2029) (%)
- Data Table on Flats - Year-over-year growth (2024-2029) (%)
- 8.4 Semi-detached houses - Market size and forecast (2024-2029)
- Chart on Semi-detached houses - Market size and forecast (2024-2029) ($ million)
- Data Table on Semi-detached houses - Market size and forecast (2024-2029) ($ million)
- Chart on Semi-detached houses - Year-over-year growth (2024-2029) (%)
- Data Table on Semi-detached houses - Year-over-year growth (2024-2029) (%)
- 8.5 Detached houses - Market size and forecast (2024-2029)
- Chart on Detached houses - Market size and forecast (2024-2029) ($ million)
- Data Table on Detached houses - Market size and forecast (2024-2029) ($ million)
- Chart on Detached houses - Year-over-year growth (2024-2029) (%)
- Data Table on Detached houses - Year-over-year growth (2024-2029) (%)
- 8.6 Market opportunity by Type
- Market opportunity by Type ($ million)
- Data Table on Market opportunity by Type ($ million)
9 Market Segmentation by Rental Category
- 9.1 Market segments
- Chart on Rental Category - Market share (2024-2029) (%)
- Data Table on Rental Category - Market share (2024-2029) (%)
- 9.2 Comparison by Rental Category
- Chart on Comparison by Rental Category
- Data Table on Comparison by Rental Category
- 9.3 Monthly - Market size and forecast (2024-2029)
- Chart on Monthly - Market size and forecast (2024-2029) ($ million)
- Data Table on Monthly - Market size and forecast (2024-2029) ($ million)
- Chart on Monthly - Year-over-year growth (2024-2029) (%)
- Data Table on Monthly - Year-over-year growth (2024-2029) (%)
- 9.4 Weekly - Market size and forecast (2024-2029)
- Chart on Weekly - Market size and forecast (2024-2029) ($ million)
- Data Table on Weekly - Market size and forecast (2024-2029) ($ million)
- Chart on Weekly - Year-over-year growth (2024-2029) (%)
- Data Table on Weekly - Year-over-year growth (2024-2029) (%)
- 9.5 Daily - Market size and forecast (2024-2029)
- Chart on Daily - Market size and forecast (2024-2029) ($ million)
- Data Table on Daily - Market size and forecast (2024-2029) ($ million)
- Chart on Daily - Year-over-year growth (2024-2029) (%)
- Data Table on Daily - Year-over-year growth (2024-2029) (%)
- 9.6 Yearly - Market size and forecast (2024-2029)
- Chart on Yearly - Market size and forecast (2024-2029) ($ million)
- Data Table on Yearly - Market size and forecast (2024-2029) ($ million)
- Chart on Yearly - Year-over-year growth (2024-2029) (%)
- Data Table on Yearly - Year-over-year growth (2024-2029) (%)
- 9.7 Market opportunity by Rental Category
- Market opportunity by Rental Category ($ million)
- Data Table on Market opportunity by Rental Category ($ million)
10 Market Segmentation by Service
- 10.1 Market segments
- Chart on Service - Market share (2024-2029) (%)
- Data Table on Service - Market share (2024-2029) (%)
- 10.2 Comparison by Service
- Chart on Comparison by Service
- Data Table on Comparison by Service
- 10.3 Economy - Market size and forecast (2024-2029)
- Chart on Economy - Market size and forecast (2024-2029) ($ million)
- Data Table on Economy - Market size and forecast (2024-2029) ($ million)
- Chart on Economy - Year-over-year growth (2024-2029) (%)
- Data Table on Economy - Year-over-year growth (2024-2029) (%)
- 10.4 Mid-range - Market size and forecast (2024-2029)
- Chart on Mid-range - Market size and forecast (2024-2029) ($ million)
- Data Table on Mid-range - Market size and forecast (2024-2029) ($ million)
- Chart on Mid-range - Year-over-year growth (2024-2029) (%)
- Data Table on Mid-range - Year-over-year growth (2024-2029) (%)
- 10.5 Premium - Market size and forecast (2024-2029)
- Chart on Premium - Market size and forecast (2024-2029) ($ million)
- Data Table on Premium - Market size and forecast (2024-2029) ($ million)
- Chart on Premium - Year-over-year growth (2024-2029) (%)
- Data Table on Premium - Year-over-year growth (2024-2029) (%)
- 10.6 Market opportunity by Service
- Market opportunity by Service ($ million)
- Data Table on Market opportunity by Service ($ million)
11 Market Segmentation by End-user
- 11.1 Market segments
- Chart on End-user - Market share (2024-2029) (%)
- Data Table on End-user - Market share (2024-2029) (%)
- 11.2 Comparison by End-user
- Chart on Comparison by End-user
- Data Table on Comparison by End-user
- 11.3 Resident - Market size and forecast (2024-2029)
- Chart on Resident - Market size and forecast (2024-2029) ($ million)
- Data Table on Resident - Market size and forecast (2024-2029) ($ million)
- Chart on Resident - Year-over-year growth (2024-2029) (%)
- Data Table on Resident - Year-over-year growth (2024-2029) (%)
- 11.4 Tourist - Market size and forecast (2024-2029)
- Chart on Tourist - Market size and forecast (2024-2029) ($ million)
- Data Table on Tourist - Market size and forecast (2024-2029) ($ million)
- Chart on Tourist - Year-over-year growth (2024-2029) (%)
- Data Table on Tourist - Year-over-year growth (2024-2029) (%)
- 11.5 Market opportunity by End-user
- Market opportunity by End-user ($ million)
- Data Table on Market opportunity by End-user ($ million)
12 Customer Landscape
- 12.1 Customer landscape overview
- Analysis of price sensitivity, lifecycle, customer purchase basket, adoption rates, and purchase criteria
13 Geographic Landscape
- 13.1 Geographic segmentation
- Chart on Market share by geography 2024-2029 (%)
- Data Table on Market share by geography 2024-2029 (%)
- 13.2 Geographic comparison
- Chart on Geographic comparison
- Data Table on Geographic comparison
- 13.3 North America - Market size and forecast 2024-2029
- Chart on North America - Market size and forecast 2024-2029 ($ million)
- Data Table on North America - Market size and forecast 2024-2029 ($ million)
- Chart on North America - Year-over-year growth 2024-2029 (%)
- Data Table on North America - Year-over-year growth 2024-2029 (%)
- 13.4 Europe - Market size and forecast 2024-2029
- Chart on Europe - Market size and forecast 2024-2029 ($ million)
- Data Table on Europe - Market size and forecast 2024-2029 ($ million)
- Chart on Europe - Year-over-year growth 2024-2029 (%)
- Data Table on Europe - Year-over-year growth 2024-2029 (%)
- 13.5 APAC - Market size and forecast 2024-2029
- Chart on APAC - Market size and forecast 2024-2029 ($ million)
- Data Table on APAC - Market size and forecast 2024-2029 ($ million)
- Chart on APAC - Year-over-year growth 2024-2029 (%)
- Data Table on APAC - Year-over-year growth 2024-2029 (%)
- 13.6 South America - Market size and forecast 2024-2029
- Chart on South America - Market size and forecast 2024-2029 ($ million)
- Data Table on South America - Market size and forecast 2024-2029 ($ million)
- Chart on South America - Year-over-year growth 2024-2029 (%)
- Data Table on South America - Year-over-year growth 2024-2029 (%)
- 13.7 Middle East and Africa - Market size and forecast 2024-2029
- Chart on Middle East and Africa - Market size and forecast 2024-2029 ($ million)
- Data Table on Middle East and Africa - Market size and forecast 2024-2029 ($ million)
- Chart on Middle East and Africa - Year-over-year growth 2024-2029 (%)
- Data Table on Middle East and Africa - Year-over-year growth 2024-2029 (%)
- 13.8 US - Market size and forecast 2024-2029
- Chart on US - Market size and forecast 2024-2029 ($ million)
- Data Table on US - Market size and forecast 2024-2029 ($ million)
- Chart on US - Year-over-year growth 2024-2029 (%)
- Data Table on US - Year-over-year growth 2024-2029 (%)
- 13.9 Germany - Market size and forecast 2024-2029
- Chart on Germany - Market size and forecast 2024-2029 ($ million)
- Data Table on Germany - Market size and forecast 2024-2029 ($ million)
- Chart on Germany - Year-over-year growth 2024-2029 (%)
- Data Table on Germany - Year-over-year growth 2024-2029 (%)
- 13.10 Canada - Market size and forecast 2024-2029
- Chart on Canada - Market size and forecast 2024-2029 ($ million)
- Data Table on Canada - Market size and forecast 2024-2029 ($ million)
- Chart on Canada - Year-over-year growth 2024-2029 (%)
- Data Table on Canada - Year-over-year growth 2024-2029 (%)
- 13.11 China - Market size and forecast 2024-2029
- Chart on China - Market size and forecast 2024-2029 ($ million)
- Data Table on China - Market size and forecast 2024-2029 ($ million)
- Chart on China - Year-over-year growth 2024-2029 (%)
- Data Table on China - Year-over-year growth 2024-2029 (%)
- 13.12 UK - Market size and forecast 2024-2029
- Chart on UK - Market size and forecast 2024-2029 ($ million)
- Data Table on UK - Market size and forecast 2024-2029 ($ million)
- Chart on UK - Year-over-year growth 2024-2029 (%)
- Data Table on UK - Year-over-year growth 2024-2029 (%)
- 13.13 Japan - Market size and forecast 2024-2029
- Chart on Japan - Market size and forecast 2024-2029 ($ million)
- Data Table on Japan - Market size and forecast 2024-2029 ($ million)
- Chart on Japan - Year-over-year growth 2024-2029 (%)
- Data Table on Japan - Year-over-year growth 2024-2029 (%)
- 13.14 India - Market size and forecast 2024-2029
- Chart on India - Market size and forecast 2024-2029 ($ million)
- Data Table on India - Market size and forecast 2024-2029 ($ million)
- Chart on India - Year-over-year growth 2024-2029 (%)
- Data Table on India - Year-over-year growth 2024-2029 (%)
- 13.15 France - Market size and forecast 2024-2029
- Chart on France - Market size and forecast 2024-2029 ($ million)
- Data Table on France - Market size and forecast 2024-2029 ($ million)
- Chart on France - Year-over-year growth 2024-2029 (%)
- Data Table on France - Year-over-year growth 2024-2029 (%)
- 13.16 Italy - Market size and forecast 2024-2029
- Chart on Italy - Market size and forecast 2024-2029 ($ million)
- Data Table on Italy - Market size and forecast 2024-2029 ($ million)
- Chart on Italy - Year-over-year growth 2024-2029 (%)
- Data Table on Italy - Year-over-year growth 2024-2029 (%)
- 13.17 South Korea - Market size and forecast 2024-2029
- Chart on South Korea - Market size and forecast 2024-2029 ($ million)
- Data Table on South Korea - Market size and forecast 2024-2029 ($ million)
- Chart on South Korea - Year-over-year growth 2024-2029 (%)
- Data Table on South Korea - Year-over-year growth 2024-2029 (%)
- 13.18 Market opportunity by geography
- Market opportunity by geography ($ million)
- Data Tables on Market opportunity by geography ($ million)
- 13.19 Brazil - Market size and forecast (2024-2029)
- Chart on Brazil - Market size and forecast (2024-2029) ($ million)
- Data Table on Brazil - Market size and forecast (2024-2029) ($ million)
- Chart on Brazil - Year-over-year growth (2024-2029) (%)
- Data Table on Brazil - Year-over-year growth (2024-2029) (%)
- 13.20 Egypt - Market size and forecast (2024-2029)
- Chart on Egypt - Market size and forecast (2024-2029) ($ million)
- Data Table on Egypt - Market size and forecast (2024-2029) ($ million)
- Chart on Egypt - Year-over-year growth (2024-2029) (%)
- Data Table on Egypt - Year-over-year growth (2024-2029) (%)
- 13.21 UAE - Market size and forecast (2024-2029)
- Chart on UAE - Market size and forecast (2024-2029) ($ million)
- Data Table on UAE - Market size and forecast (2024-2029) ($ million)
- Chart on UAE - Year-over-year growth (2024-2029) (%)
- Data Table on UAE - Year-over-year growth (2024-2029) (%)
- 13.22 Oman - Market size and forecast (2024-2029)
- Chart on Oman - Market size and forecast (2024-2029) ($ million)
- Data Table on Oman - Market size and forecast (2024-2029) ($ million)
- Chart on Oman - Year-over-year growth (2024-2029) (%)
- Data Table on Oman - Year-over-year growth (2024-2029) (%)
- 13.23 Argentina - Market size and forecast (2024-2029)
- Chart on Argentina - Market size and forecast (2024-2029) ($ million)
- Data Table on Argentina - Market size and forecast (2024-2029) ($ million)
- Chart on Argentina - Year-over-year growth (2024-2029) (%)
- Data Table on Argentina - Year-over-year growth (2024-2029) (%)
- 13.24 KSA - Market size and forecast (2024-2029)
- Chart on KSA - Market size and forecast (2024-2029) ($ million)
- Data Table on KSA - Market size and forecast (2024-2029) ($ million)
- Chart on KSA - Year-over-year growth (2024-2029) (%)
- Data Table on KSA - Year-over-year growth (2024-2029) (%)
- 13.25 Rest of World (ROW) - Market size and forecast (2024-2029)
- Chart on Rest of World (ROW) - Market size and forecast (2024-2029) ($ million)
- Data Table on Rest of World (ROW) - Market size and forecast (2024-2029) ($ million)
- Chart on Rest of World (ROW) - Year-over-year growth (2024-2029) (%)
- Data Table on Rest of World (ROW) - Year-over-year growth (2024-2029) (%)
14 Drivers, Challenges, and Opportunity/Restraints
- 14.3 Impact of drivers and challenges
- Impact of drivers and challenges in 2024 and 2029
- 14.4 Market opportunities/restraints
15 Competitive Landscape
- 15.2 Competitive Landscape
- Overview on criticality of inputs and factors of differentiation
- 15.3 Landscape disruption
- Overview on factors of disruption
- 15.4 Industry risks
- Impact of key risks on business
16 Competitive Analysis
- 16.2 Company ranking index
- 16.3 Market positioning of companies
- Matrix on companies position and classification
- 9flats.com PTE Ltd.
- 9flats.com PTE Ltd. - Overview
- 9flats.com PTE Ltd. - Product / Service
- 9flats.com PTE Ltd. - Key offerings
- SWOT
- 16.5 Airbnb Inc.
- Airbnb Inc. - Overview
- Airbnb Inc. - Product / Service
- Airbnb Inc. - Key offerings
- SWOT
- 16.6 BoutiqueHomes
- BoutiqueHomes - Overview
- BoutiqueHomes - Product / Service
- BoutiqueHomes - Key offerings
- SWOT
- 16.7 CoStar Group
- CoStar Group - Overview
- CoStar Group - Business segments
- CoStar Group - Key news
- CoStar Group - Key offerings
- CoStar Group - Segment focus
- SWOT
- 16.8 Elite Destination Homes
- Elite Destination Homes - Overview
- Elite Destination Homes - Product / Service
- Elite Destination Homes - Key offerings
- SWOT
- 16.9 Expedia Group Inc.
- Expedia Group Inc. - Overview
- Expedia Group Inc. - Business segments
- Expedia Group Inc. - Key offerings
- Expedia Group Inc. - Segment focus
- SWOT
- 16.10 HomeToGo GmbH
- HomeToGo GmbH - Overview
- HomeToGo GmbH - Product / Service
- HomeToGo GmbH - Key offerings
- SWOT
- 16.11 Lodgis
- Lodgis - Overview
- Lodgis - Product / Service
- Lodgis - Key offerings
- SWOT
- 16.12 LVH Global Inc.
- LVH Global Inc. - Overview
- LVH Global Inc. - Product / Service
- LVH Global Inc. - Key offerings
- SWOT
- 16.13 MakeMyTrip Ltd.
- MakeMyTrip Ltd. - Overview
- MakeMyTrip Ltd. - Business segments
- MakeMyTrip Ltd. - Key offerings
- MakeMyTrip Ltd. - Segment focus
- SWOT
- 16.14 NestAway Technologies Pvt Ltd.
- NestAway Technologies Pvt Ltd. - Overview
- NestAway Technologies Pvt Ltd. - Product / Service
- NestAway Technologies Pvt Ltd. - Key offerings
- SWOT
- 16.15 Oravel Stays Ltd.
- Oravel Stays Ltd. - Overview
- Oravel Stays Ltd. - Product / Service
- Oravel Stays Ltd. - Key offerings
- SWOT
- 16.16 Upad Ltd.
- Upad Ltd. - Overview
- Upad Ltd. - Product / Service
- Upad Ltd. - Key offerings
- SWOT
- 16.17 Wyndham Destinations Inc.
- Wyndham Destinations Inc. - Overview
- Wyndham Destinations Inc. - Product / Service
- Wyndham Destinations Inc. - Key offerings
- SWOT
- 16.18 Zillow Group Inc.
- Zillow Group Inc. - Overview
- Zillow Group Inc. - Business segments
- Zillow Group Inc. - Key offerings
- Zillow Group Inc. - Segment focus
- SWOT
17 Appendix
- 17.2 Inclusions and exclusions checklist
- Inclusions checklist
- Exclusions checklist
- 17.3 Currency conversion rates for US$
- Currency conversion rates for US$
- 17.4 Research methodology
- 17.7 Validation techniques employed for market sizing
- Validation techniques employed for market sizing
- 17.9 360 degree market analysis
- 360 degree market analysis
- 17.10 List of abbreviations