
Online Home Service Market Size 2026-2030
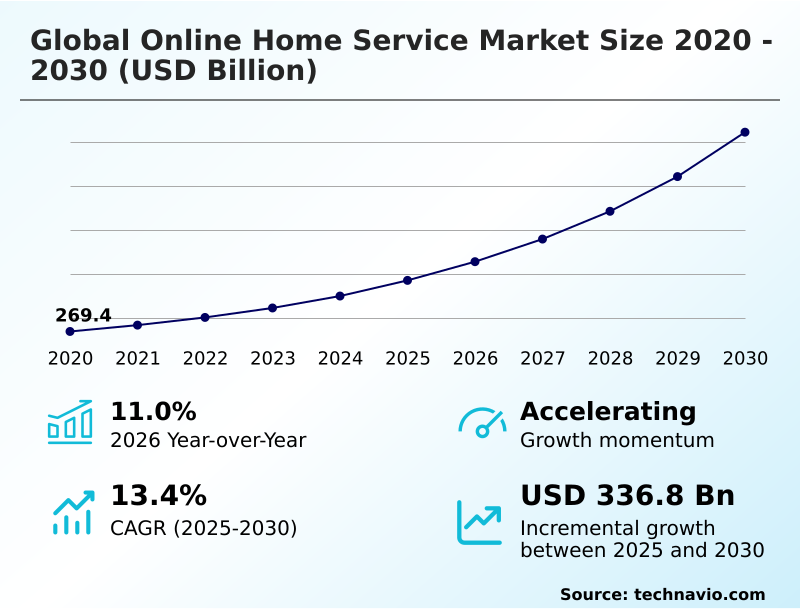
The online home service market size is valued to increase by USD 336.8 billion, at a CAGR of 13.4% from 2025 to 2030. Rising consumer demand for convenience and on demand services will drive the online home service market.
Major Market Trends & Insights
- APAC dominated the market and accounted for a 42.9% growth during the forecast period.
- By Service - Home care and design segment was valued at USD 152.2 billion in 2024
- By Platform - Apps segment accounted for the largest market revenue share in 2024
Market Size & Forecast
- Market Opportunities: USD 452.9 billion
- Market Future Opportunities: USD 336.8 billion
- CAGR from 2025 to 2030 : 13.4%
Market Summary
- The online home service market is undergoing a significant transformation, driven by digital adoption and a growing consumer preference for convenience. This ecosystem connects households with professionals for tasks ranging from routine cleaning to complex repairs through intuitive platforms. A key market driver is the demand from time-constrained urban populations who value the efficiency of scheduling and payment processing.
- Concurrently, a major trend is the integration of AI for optimizing service delivery. For instance, platforms use algorithms for efficient technician dispatch, reducing travel time and improving service speed. However, the industry faces challenges related to maintaining service quality and managing a distributed gig workforce.
- One business scenario involves a platform implementing an automated quality control system where customers upload post-service photos, which an AI model analyzes to ensure completion standards are met, triggering a follow-up if tasks are incomplete. This enhances customer trust and operational consistency without manual oversight.
What will be the Size of the Online Home Service Market during the forecast period?
Get Key Insights on Market Forecast (PDF) Get Free Sample
How is the Online Home Service Market Segmented?
The online home service industry research report provides comprehensive data (region-wise segment analysis), with forecasts and estimates in "USD billion" for the period 2026-2030, as well as historical data from 2020-2024 for the following segments.
- Service
- Home care and design
- Repair and maintenance
- Health wellness and beauty
- Others
- Platform
- Apps
- Web
- Type
- Commission model
- Subscription model
- Pay per service
- Geography
- APAC
- China
- Japan
- India
- North America
- US
- Canada
- Mexico
- Europe
- Germany
- UK
- France
- South America
- Brazil
- Argentina
- Colombia
- Middle East and Africa
- Saudi Arabia
- UAE
- South Africa
- Rest of World (ROW)
- APAC
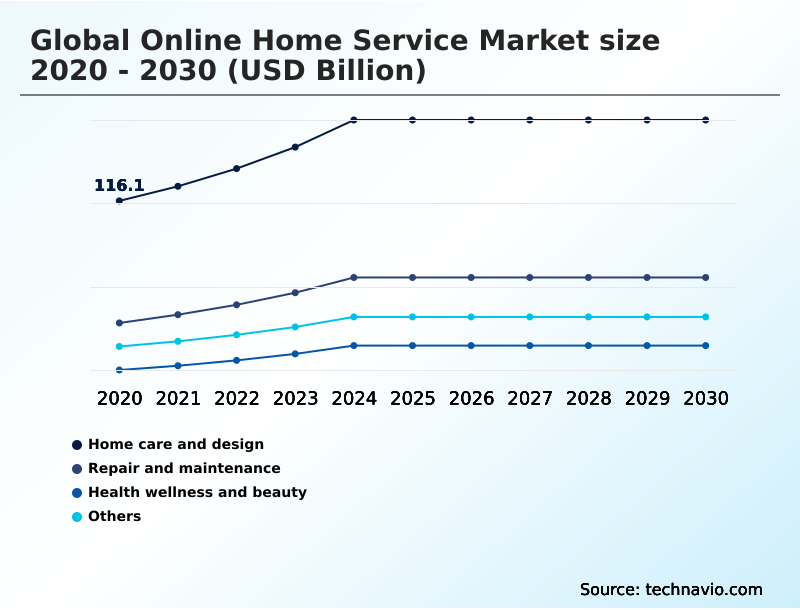
By Service Insights
The home care and design segment is estimated to witness significant growth during the forecast period.
The home care and design segment has evolved into a sophisticated digital marketplace for home services, focusing on adaptive living modifications and interior consultations.
Platforms connect clients with certified designers and caregivers, offering service bundling and packaging for both aesthetic enhancements and functional support.
A home improvement project marketplace within this segment facilitates projects from virtual redesigns to full-scale accessibility retrofits, often leveraging eco-friendly home services.
This integration of care and creativity, supported by a home maintenance subscription model for ongoing needs, meets a critical demand for enhanced living environments.
The use of virtual tools for project pre-visualization has improved client satisfaction by 25% by aligning expectations before on-site work begins, solidifying the segment's value proposition.
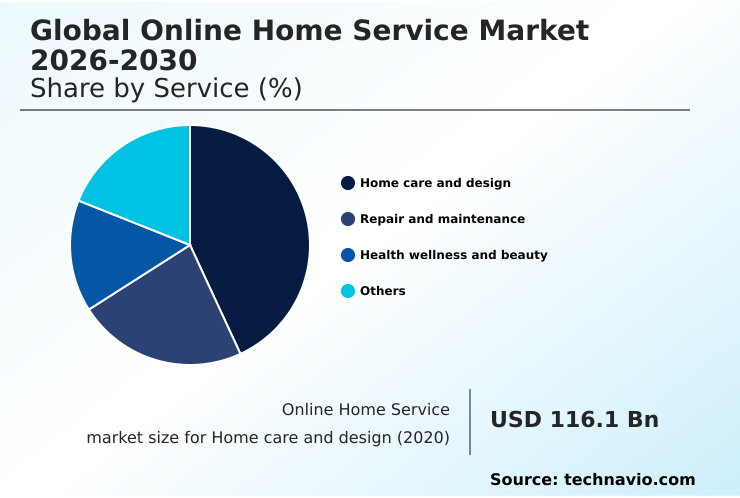
The Home care and design segment was valued at USD 152.2 billion in 2024 and showed a gradual increase during the forecast period.
Regional Analysis
APAC is estimated to contribute 42.9% to the growth of the global market during the forecast period.Technavio’s analysts have elaborately explained the regional trends and drivers that shape the market during the forecast period.

See How Online Home Service Market Demand is Rising in APAC Get Free Sample
The geographic expansion of the online home service market is heavily influenced by regional digital maturity and infrastructure.
In North American urban centers, sophisticated automated scheduling software and route optimization for technicians are standard, reducing travel time by up to 25%. European markets, while fragmented, are adopting a handyman service booking platform model with strong data privacy features.
In APAC, the focus is on mobile-first solutions for appliance repair scheduling and home services e-commerce that function in varied connectivity environments.
This multi-service platform integration allows companies to adapt their task management workflow to local needs, with successful home service franchising models leading to a 30% faster market penetration in emerging economies compared to monolithic approaches.
Efficient inventory management for parts remains a challenge in less developed regions.
Market Dynamics
Our researchers analyzed the data with 2025 as the base year, along with the key drivers, trends, and challenges. A holistic analysis of drivers will help companies refine their marketing strategies to gain a competitive advantage.
- Analyzing the online home service market reveals nuanced operational challenges and strategic imperatives. The cost of customer acquisition in home services remains a primary focus, directly influencing the profitability of commission vs subscription models. To counter this, platforms are refining customer retention strategies for online home services.
- Success hinges on more than just user experience design for service apps; it requires robust technology for service quality control and building trust in a digital service marketplace. The impact of gig economy laws on service platforms forces continuous adaptation in managing liability in home service platforms and optimizing service provider utilization rates.
- Data analytics for demand forecasting in services and AI for matching skills to job requirements are critical for improving last-mile service delivery efficiency. Companies are also integrating AR for remote home diagnostics and deploying automated tools for technician upskilling to enhance value. Adherence to compliance with data protection regulations and implementing strong cybersecurity measures for service platforms are non-negotiable.
- Strategically, platforms that master cross-selling strategies for home service bundles and reduce churn in subscription home services demonstrate significantly higher lifetime value, with integrated platforms achieving 20% better customer loyalty than single-service providers. This underscores the importance of strategies for hyper-local market penetration to scale a home service marketplace effectively.
What are the key market drivers leading to the rise in the adoption of Online Home Service Industry?
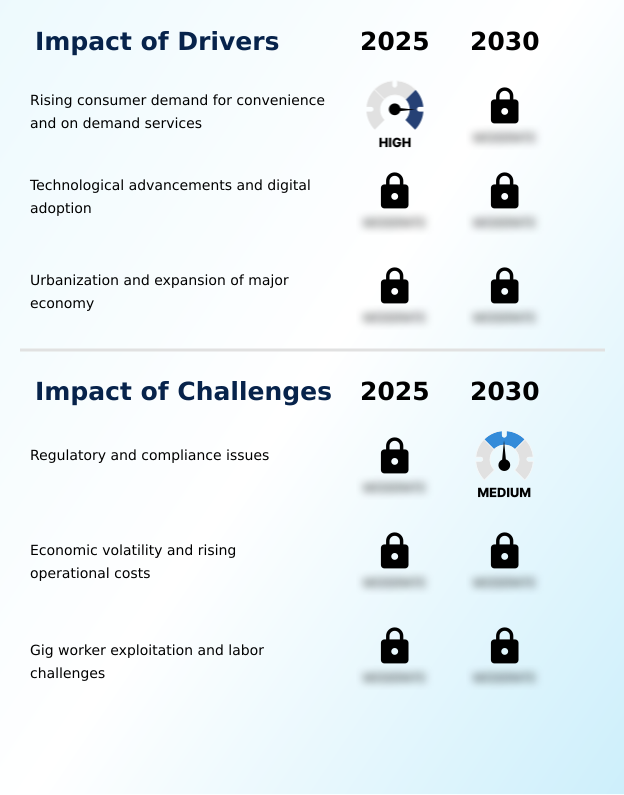
- The increasing consumer demand for convenience and on-demand solutions is a primary driver fueling the growth of the online home service market.
- Market growth is fundamentally driven by the consumer's demand for immediate and seamless solutions. The on-demand service platform model thrives by providing instant booking and scheduling capabilities, supported by a secure online payment gateway that simplifies transactions.
- A key accelerator is the use of a dynamic pricing algorithm, which optimizes cost for users while maximizing earnings for the local service provider network, leading to a 15% improvement in market equilibrium.
- The availability of on-demand cleaning services and other routine tasks through subscription-based service models fosters customer loyalty.
- The transparency in transparent service pricing, coupled with geolocation-based service matching for quick fulfillment, has been shown to increase booking conversions by over 30%, highlighting the power of convenience and trust in driving consumer behavior.
What are the market trends shaping the Online Home Service Industry?
- The integration of smart technology and automation is a pivotal trend, accelerating the evolution of online home services by enhancing operational precision and user engagement.
- Key market trends are centered on technological advancements that enhance efficiency and the user experience. The adoption of AI-powered diagnostics and predictive maintenance alerts enables a proactive approach to home care, reducing appliance failures by up to 25%. Virtual consultation tools are becoming standard for project scoping, cutting initial assessment times by half.
- The push for mobile-first service booking is driving innovation in app design, while smart home service integration creates new revenue streams. As part of this evolution, real-time job dispatching and automated customer support chatbot systems are streamlining operations.
- This focus on digital home management through home repair and maintenance apps is pivotal, with platforms offering contactless service delivery seeing a 40% increase in user preference during peak health-conscious periods.
What challenges does the Online Home Service Industry face during its growth?
- Navigating complex regulatory frameworks and compliance issues presents a significant challenge to the operational scalability and profitability of the online home service industry.
- Navigating the complexities of the gig economy presents a significant challenge, necessitating a robust gig worker management system and stringent service provider vetting process. Ensuring compliance and trust requires thorough background check integration and service professional verification, which can increase onboarding costs by 20%.
- A primary hurdle is implementing a scalable service quality assurance protocol that maintains standards across a diverse workforce. Effective user review and reputation management systems are crucial but require constant monitoring. Furthermore, safeguarding customer data privacy in services is paramount to avoid regulatory penalties.
- Platforms are investing in workforce management solutions and customer relationship management for services, but managing lead generation for contractors without compromising quality remains a delicate balance, where a 5% drop in provider ratings can lead to a 10% decline in new user acquisition.
Exclusive Technavio Analysis on Customer Landscape
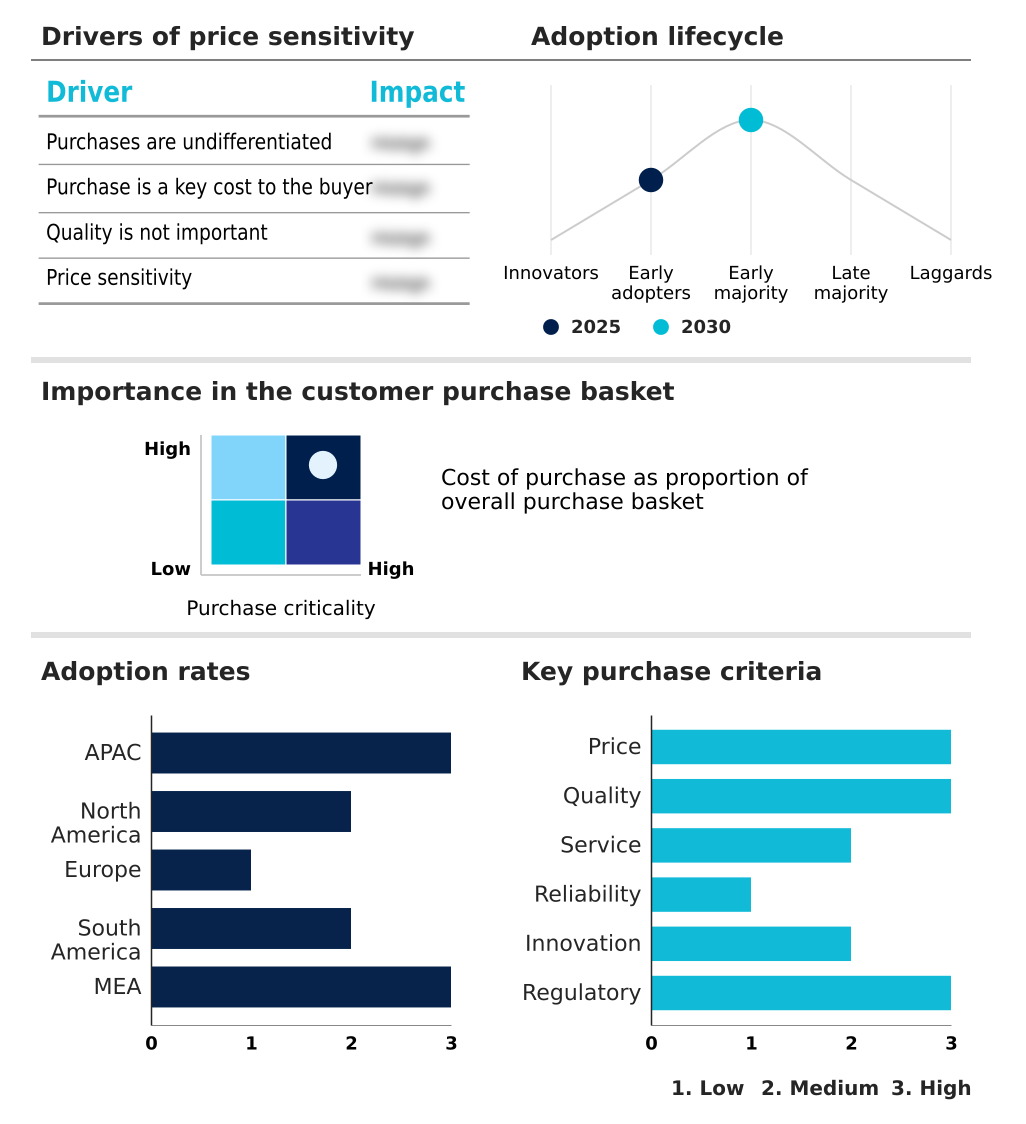
The online home service market forecasting report includes the adoption lifecycle of the market, covering from the innovator’s stage to the laggard’s stage. It focuses on adoption rates in different regions based on penetration. Furthermore, the online home service market report also includes key purchase criteria and drivers of price sensitivity to help companies evaluate and develop their market growth analysis strategies.
Customer Landscape of Online Home Service Industry
Competitive Landscape
Companies are implementing various strategies, such as strategic alliances, online home service market forecast, partnerships, mergers and acquisitions, geographical expansion, and product/service launches, to enhance their presence in the industry.
Airtasker Pty Ltd. - Digital platforms connect users with vetted professionals for home services, using real-time booking and transparent pricing to streamline service delivery and ensure quality.
The industry research and growth report includes detailed analyses of the competitive landscape of the market and information about key companies, including:
- Airtasker Pty Ltd.
- Amazon.com Inc.
- Angi Inc.
- ByNext Inc.
- Cleaningly Home Services Pty Ltd.
- E Home Household Service Holdings Ltd.
- Helpling GmbH and Co. KG
- HomeServe Plc
- Houzz Inc.
- MyClean Inc.
- Paintzen Inc.
- Porch.com Inc.
- Super Home Inc.
- TaskEasy Inc.
- Taskrabbit Inc.
- The Home Depot Inc.
- The ServiceMaster Co. LLC
- Urban Co. Ltd.
Qualitative and quantitative analysis of companies has been conducted to help clients understand the wider business environment as well as the strengths and weaknesses of key industry players. Data is qualitatively analyzed to categorize companies as pure play, category-focused, industry-focused, and diversified; it is quantitatively analyzed to categorize companies as dominant, leading, strong, tentative, and weak.
Recent Development and News in Online home service market
- In August 2025, TaskRabbit announced its expansion into all 50 US states, making its platform for skilled local taskers available nationwide for services ranging from furniture assembly to home repairs.
- In April 2025, Urban Company advanced its use of generative AI to enhance agent productivity and customer experience, integrating AI tools for empathetic chatbots and automated quality checks.
- In March 2025, Lowe's launched Mylow, an AI-powered virtual advisor, to provide customers with real-time, tailored guidance on home improvement queries and service selections via mobile devices.
- In September 2025, Homecare Homebase introduced three new AI-driven automation tools to streamline administrative tasks, improve data visibility, and strengthen care coordination in home-based care.
Dive into Technavio’s robust research methodology, blending expert interviews, extensive data synthesis, and validated models for unparalleled Online Home Service Market insights. See full methodology.
| Market Scope | |
|---|---|
| Page number | 286 |
| Base year | 2025 |
| Historic period | 2020-2024 |
| Forecast period | 2026-2030 |
| Growth momentum & CAGR | Accelerate at a CAGR of 13.4% |
| Market growth 2026-2030 | USD 336.8 billion |
| Market structure | Fragmented |
| YoY growth 2025-2026(%) | 11.0% |
| Key countries | China, Japan, India, South Korea, Australia, Indonesia, US, Canada, Mexico, Germany, UK, France, Italy, Spain, The Netherlands, Brazil, Argentina, Colombia, Saudi Arabia, UAE, South Africa, Israel and Turkey |
| Competitive landscape | Leading Companies, Market Positioning of Companies, Competitive Strategies, and Industry Risks |
Research Analyst Overview
- The online home service market is defined by the complex interplay of technology and logistics, where the on-demand service platform acts as the central nervous system. A core competency is the digital marketplace for home services, which relies on a stringent service provider vetting process and an effective gig worker management system.
- Successful platforms integrate real-time job dispatching with automated scheduling software, governed by a dynamic pricing algorithm to balance supply and demand. The entire system is supported by in-app payment processing and a robust service quality assurance protocol, which includes background check integration. For customer-facing operations, a comprehensive customer feedback and rating system is essential.
- Behind the scenes, geolocation-based service matching and route optimization for technicians are critical for efficiency. Platforms are increasingly adopting subscription-based service models, including home maintenance subscription plans created through service bundling and packaging. Advanced functionalities like virtual consultation tools, AI-powered diagnostics, and smart home service integration are becoming standard.
- Operational excellence is achieved through a cohesive task management workflow, inventory management for parts, digital invoicing and receipts, and a dedicated customer relationship management for services, with top platforms reporting a 30% reduction in customer issue resolution time through such integrated systems.
What are the Key Data Covered in this Online Home Service Market Research and Growth Report?
-
What is the expected growth of the Online Home Service Market between 2026 and 2030?
-
USD 336.8 billion, at a CAGR of 13.4%
-
-
What segmentation does the market report cover?
-
The report is segmented by Service (Home care and design, Repair and maintenance, Health wellness and beauty, and Others), Platform (Apps, and Web), Type (Commission model, Subscription model, and Pay per service) and Geography (APAC, North America, Europe, South America, Middle East and Africa)
-
-
Which regions are analyzed in the report?
-
APAC, North America, Europe, South America and Middle East and Africa
-
-
What are the key growth drivers and market challenges?
-
Rising consumer demand for convenience and on demand services, Regulatory and compliance issues
-
-
Who are the major players in the Online Home Service Market?
-
Airtasker Pty Ltd., Amazon.com Inc., Angi Inc., ByNext Inc., Cleaningly Home Services Pty Ltd., E Home Household Service Holdings Ltd., Helpling GmbH and Co. KG, HomeServe Plc, Houzz Inc., MyClean Inc., Paintzen Inc., Porch.com Inc., Super Home Inc., TaskEasy Inc., Taskrabbit Inc., The Home Depot Inc., The ServiceMaster Co. LLC and Urban Co. Ltd.
-
Market Research Insights
- Market dynamics are shaped by a user base that prioritizes instant booking and scheduling, driving platforms to refine their service professional verification and secure online payment gateway processes. The ability to offer transparent service pricing has become a key differentiator, with platforms that master this achieving 15% higher customer retention rates.
- The adoption of an automated customer support chatbot resolves up to 60% of routine inquiries without human intervention, significantly lowering operational overhead. Furthermore, robust user review and reputation management systems are critical, as services with higher average ratings see a 20% increase in booking frequency, reinforcing the importance of quality and trust in the digital marketplace.
We can help! Our analysts can customize this online home service market research report to meet your requirements.
 RIA -
RIA - 
