Packaging Resins Market Size 2025-2029
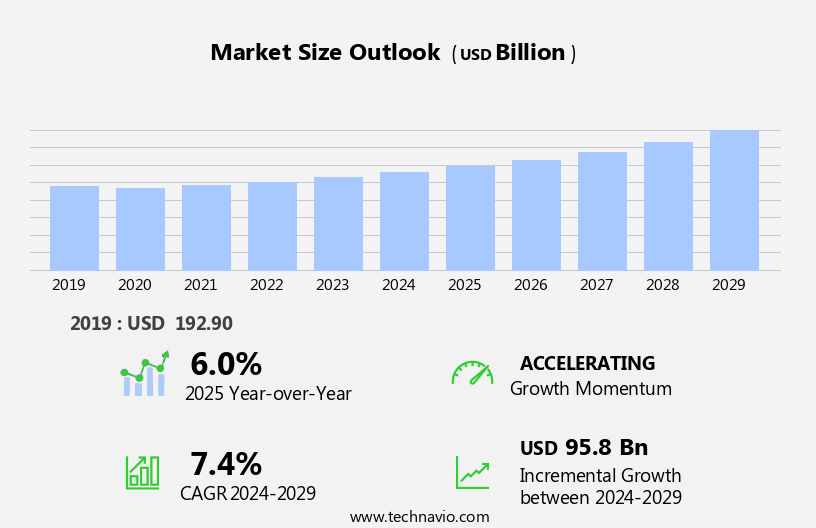
The packaging resins market size is forecast to increase by USD 95.8 billion at a CAGR of 7.4% between 2024 and 2029.
- The market is experiencing significant growth due to several key trends. The expansion of the e-commerce and retail sectors is driving market demand, as these industries increasingly rely on packaging to protect and transport goods. Polystyrene, high-density polyethylene (HDPE), and polypropylene (PP) remain popular choices due to their heat resistance and performance. Additionally, there is a growing shift toward sustainable and recyclable packaging solutions, as consumers and governments push for more environmentally friendly options. Regulatory compliance is another crucial factor, as stricter regulations on packaging materials and waste disposal continue to be enacted. These trends are shaping the future of the market and are expected to continue driving growth In the coming years.
What will be the Size of the Packaging Resins Market During the Forecast Period?
- The market is a dynamic and evolving industry, driven by various trends and factors. Lifecycle analysis and cost optimization are key considerations for businesses seeking to minimize environmental impact and enhance efficiency. However, there is a growing demand for eco-friendly alternatives, such as compostable films made from biodegradable polymers and renewable resources. The healthcare sector and consumer goods industries are leading the charge towards sustainability, with a focus on circular economy principles and waste reduction. Innovation in materials, such as bio-based plastics and biodegradable polymers, is driving progress In the industry.
- The beverage industry is also exploring plastic alternatives, such as PET and PE, to meet safety standards and consumer perception. Logistics and design are critical factors In the efficient production and distribution of packaging resins. Overall, the market is characterized by a focus on sustainability, innovation, and efficiency, with a shift towards renewable resources and eco-friendly materials.
How is this Packaging Resins Industry segmented and which is the largest segment?
The packaging resins industry research report provides comprehensive data (region-wise segment analysis), with forecasts and estimates in "USD billion" for the period 2025-2029, as well as historical data from 2019-2023 for the following segments.
- Type
- LDPE
- PP
- HDPE
- Others
- Application
- Consumer goods
- Food and beverages
- Healthcare
- Others
- Geography
- APAC
- China
- India
- Japan
- South Korea
- North America
- US
- Europe
- Germany
- France
- Italy
- South America
- Brazil
- Middle East and Africa
- APAC
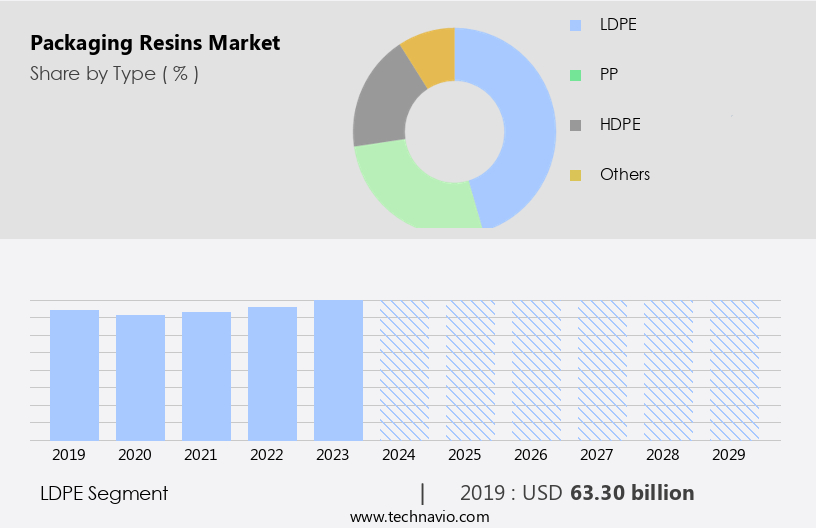
By Type Insights
- The LDPE segment is estimated to witness significant growth during the forecast period.
Low-density polyethylene (LDPE) is a flexible and durable packaging resin, valued for its chemical resistance and ease of processing. Primarily used in flexible packaging applications, LDPE is essential In the food and beverage industry due to its ability to maintain product freshness and prevent contamination. Its versatility extends to bottles, lids, containers, and coatings. The demand for LDPE is driven by consumer goods sectors, particularly food and beverage, seeking eco-friendly, sustainable alternatives to traditional packaging materials. Sustainability concerns and regulatory compliance are influencing the shift towards plant-based, biodegradable, and recyclable materials. LDPE offers a lightweight, efficient solution for shipping and distribution, reducing plastic waste and addressing environmental concerns. Its heat-resistant and insulating properties ensure product integrity during transportation and storage. Additionally, LDPE's non-corrosive nature makes it suitable for various industries, including pharmaceuticals and hygiene.
Get a glance at the Packaging Resins Industry report of share of various segments Request Free Sample
The LDPE segment was valued at USD 63.30 billion in 2019 and showed a gradual increase during the forecast period.
Regional Analysis
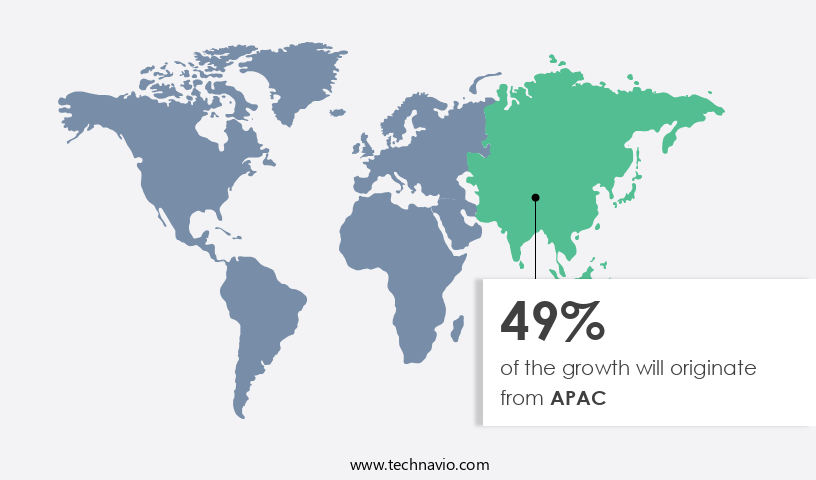
- APAC is estimated to contribute 49% to the growth of the global market during the forecast period.
Technavio's analysts have elaborately explained the regional trends and drivers that shape the market during the forecast period.
For more insights on the market share of various regions, Request Free Sample
The market In the Asia-Pacific (APAC) region is experiencing significant growth due to its large and expanding population. With approximately 4.7 billion people or 60% of the global population, residing in APAC, the demand for packaging resins is expected to increase as the region's economy develops. China and India are major contributors to market growth. In China, the per capita disposable income reached USD5,511 in 2023, marking a 6.3% year-on-year increase. This rise in disposable income has fueled consumer spending, particularly In the retail sector, which saw sales grow by approximately 7% in 2023, reaching USD6 trillion. The demand for packaging resins is driven by various applications, including beverages, pharmaceuticals, and consumer goods.
Furthermore, sustainability is a key trend In the market, with eco-friendly resins, such as biodegradable and compostable materials, gaining popularity. These resins offer advantages such as improved product integrity, longer shelf life, and reduced environmental impact. Heat-resistant and chemically resistant materials are also in demand for applications requiring high performance. The market is subject to regulatory compliance, ensuring safety and consumer protection. Lightweight and efficient materials, such as polypropylene and PET, are widely used for their molding ability and insulating properties. The circular economy is driving the adoption of sustainable alternatives, such as plant-based materials and bioplastics, to reduce plastic waste and minimize the environmental impact of single-use plastics.
Market Dynamics
Our researchers analyzed the data with 2024 as the base year, along with the key drivers, trends, and challenges. A holistic analysis of drivers will help companies refine their marketing strategies to gain a competitive advantage.
What are the key market drivers leading to the rise In the adoption of Packaging Resins Industry?
The growth of e-commerce and the retail sector is the key driver of the market.
- The market In the US is witnessing significant growth due to the expanding e-commerce and retail sectors. This trend highlights the increasing reliance on e-commerce platforms for purchasing goods, leading to a heightened demand for packaging resins such as PE and PP. Sustainability is another crucial factor driving the market. Consumers are increasingly demanding eco-friendly and biodegradable packaging solutions, leading to the adoption of compostable and plant-based materials. Bioplastics, derived from renewable resources, offer excellent chemical resistance and insulating properties, making them ideal for various applications, including beverage containers, pharmaceutical packaging, and ready-to-cook meals.
- Moreover, regulatory compliance is a significant consideration for manufacturers. The FDA's regulations on food contact materials and the European Union's REACH regulations necessitate the use of non-corrosive and safe materials. This has led to the development of sustainable alternatives such as PHA, LDPE, and PET, which offer excellent product integrity and shelf life while minimizing environmental impact. The circular economy is also gaining traction, with a focus on recycling and reducing plastic waste. Recyclable materials such as HDPE and PVC are increasingly being used for containers, crates, and films. This not only reduces the carbon footprint but also aligns with consumer behavior that prioritizes sustainability and minimizes plastic pollution.
What are the market trends shaping the Packaging Resins Industry?
Shift toward recyclable packaging is the upcoming market trend.
- The market is experiencing a notable transition towards eco-friendly and sustainable solutions, as consumer preferences shift towards reducing environmental impact and regulatory compliance. Companies are responding by introducing innovative, plant-based materials and bioplastics, such as polylactic acid (PLA), polyhydroxyalkanoate (PHA), and low-density polyethylene (LDPE), to create compostable, heat-resistant, and chemically resistant packaging. These materials offer improved product integrity, freshness, and insulating properties, making them suitable for various applications, including beverage containers, pharmaceutical packaging, and ready-to-cook food containers. Braskem SA, a prominent resin producer, recently launched an extensive portfolio of post-consumer recycled (PCR) resins in Brazil, consisting of nine different grades.
- This initiative aims to reduce plastic waste and lower carbon emissions, as these resins are derived from recycled materials. The market for packaging resins is evolving, with a focus on circular economy principles and sustainable alternatives to single-use plastics, such as polystyrene. This shift is driven by increasing consumer awareness, environmental concerns, and regulatory requirements, making it essential for businesses to adapt and offer more efficient, recyclable, and safe packaging solutions.
What challenges does the Packaging Resins Industry face during its growth?
Regulatory compliance is a key challenge affecting the industry growth.
- The market is witnessing significant regulatory compliance requirements due to growing environmental concerns and consumer preferences for sustainable solutions. Sustainable polymers, such as bioplastics derived from plant-based materials, are gaining popularity as eco-friendly alternatives to traditional plastic resins. These materials offer better chemical resistance, heat resistance, and insulating properties, ensuring product integrity and shelf life for various applications, including beverages, pharmaceuticals, and consumer goods. Compostable and biodegradable resins are essential in addressing the issue of plastic waste and reducing environmental impact. These eco-friendly resins cater to the increasing demand for recyclable materials In the market. The circular economy concept is gaining traction, with companies focusing on sustainable alternatives to single-use plastics, such as PET bottles, polypropylene films, and HDPE containers.
- Regulations aimed at reducing plastic pollution and promoting sustainability are driving the market's growth. For instance, the European Union's Single-Use Plastics Directive restricts the use of certain plastic items and encourages the adoption of compostable and biodegradable materials. The FDA's regulations ensure the safety and quality of food-grade packaging resins, while regulatory bodies monitor the use of non-corrosive and non-toxic materials in various industries. The market's growth is also influenced by consumer behavior and increasing disposable income, leading to a rise in online shopping and the need for efficient handling and protective packaging. The use of performance polymers like LDPE, PHA, and PVC ensures product freshness, safety, and molding ability, making them suitable for various applications.
Exclusive Customer Landscape
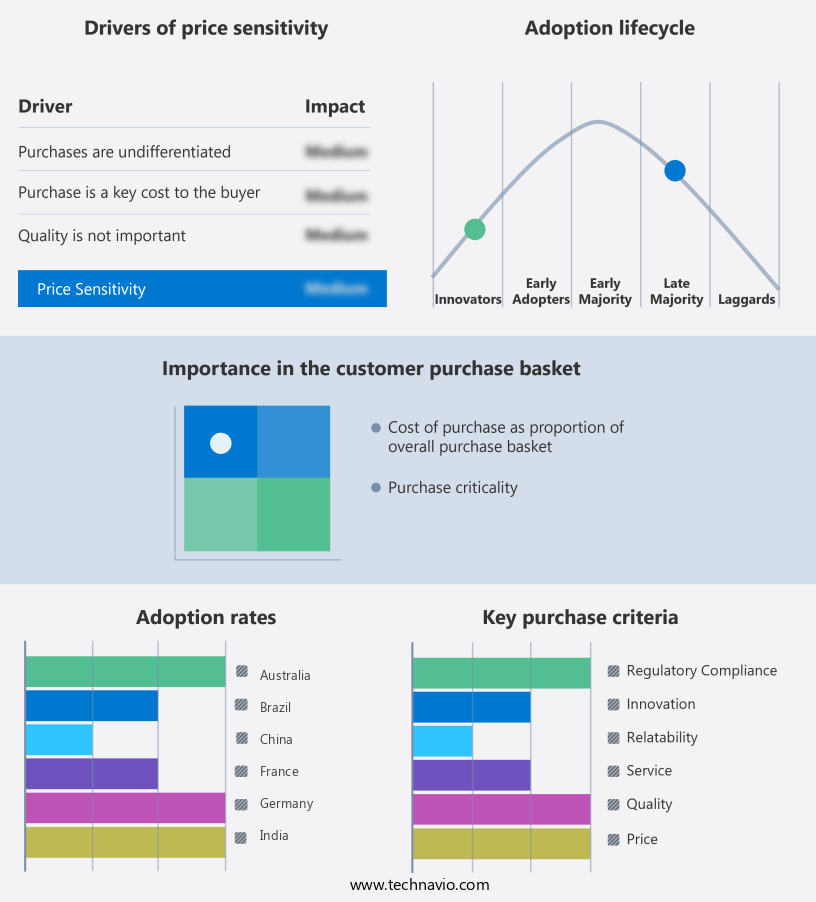
The market forecasting report includes the adoption lifecycle of the market, covering from the innovator's stage to the laggard's stage. It focuses on adoption rates in different regions based on penetration. Furthermore, the market report also includes key purchase criteria and drivers of price sensitivity to help companies evaluate and develop their market growth analysis strategies.
Customer Landscape
Key Companies & Market Insights
Companies are implementing various strategies, such as strategic alliances, packaging resins market forecast, partnerships, mergers and acquisitions, geographical expansion, and product/service launches, to enhance their presence In the industry.
Arkema - The company offers packaging resins such as Arkema Coating Resins (ACR) with a complete range of solutions based on aqueous polymer emulsions, opacifiers, aqueous or solvent-based alkyds and acrylics.
The industry research and growth report includes detailed analyses of the competitive landscape of the market and information about key companies, including:
- Arkema
- BASF SE
- Borealis AG
- Borouge PLC
- Braskem SA
- China National Petroleum Corp.
- Entec Polymers
- Exxon Mobil Corp.
- Far Eastern New Century Corp.
- Indorama Ventures Public Co. Ltd.
- INEOS Group Holdings S.A.
- IPS Packaging and Automation
- LyondellBasell Industries NV
- Mitsui Plastics Inc.
- Reliance Industries Ltd.
- Saudi Basic Industries Corp.
- Sinopec Plastic Co. Ltd.
- Sumilon Industries Ltd.
- The Dow Chemical Co.
- TotalEnergies SE
Qualitative and quantitative analysis of companies has been conducted to help clients understand the wider business environment as well as the strengths and weaknesses of key industry players. Data is qualitatively analyzed to categorize companies as pure play, category-focused, industry-focused, and diversified; it is quantitatively analyzed to categorize companies as dominant, leading, strong, tentative, and weak.
Research Analyst Overview
Packaging resins play a crucial role in safeguarding the integrity of various consumer goods and ensuring their shelf life. These materials offer desirable properties such as heat resistance, chemical resistance, and protection against contamination. The market encompasses a wide array of polymers, including polypropylene (PP), low-density polyethylene (LDPE), high-density polyethylene (HDPE), and polyvinyl chloride (PVC), among others. The demand for eco-friendly and sustainable packaging solutions has been on the rise, leading to the increased popularity of bioplastics and plant-based materials. Bioplastics offer several advantages, including biodegradability, renewability, and reduced carbon footprint. These materials are gaining traction in various industries, including consumer goods, pharmaceuticals, and beverages.
Moreover, sustainability is a key consideration In the packaging industry, with regulatory bodies and consumers pushing for more environmentally friendly alternatives to traditional plastic packaging. The circular economy is a growing trend, with a focus on reducing waste and promoting recycling. The protective properties of packaging resins are essential in maintaining product quality and ensuring consumer safety. For instance, heat-resistant materials are used In the packaging of ready-to-cook meals, while insulating properties are utilized In the transportation of temperature-sensitive goods. In the pharmaceutical industry, non-corrosive and regulatory-compliant materials are used to ensure product safety. The use of eco-friendly resins in various applications, such as films, containers, and crates, has become increasingly popular due to growing environmental concerns.
Furthermore, biodegradable and recyclable materials offer a more sustainable alternative to single-use plastics, reducing plastic waste and minimizing the environmental impact. The handling and distribution of goods require packaging materials that are efficient and lightweight. The molding ability of packaging resins enables the creation of various shapes and sizes, making them suitable for a wide range of applications. Consumer behavior is a significant factor influencing the market. The shift towards online shopping has led to an increased demand for packaging materials that offer good protection during shipping and storage. The convenience and safety offered by disposable income-friendly packaging solutions have also influenced consumer preferences.
|
Market Scope |
|
|
Report Coverage |
Details |
|
Page number |
219 |
|
Base year |
2024 |
|
Historic period |
2019-2023 |
|
Forecast period |
2025-2029 |
|
Growth momentum & CAGR |
Accelerate at a CAGR of 7.4% |
|
Market Growth 2025-2029 |
USD 95.8 billion |
|
Market structure |
Fragmented |
|
YoY growth 2024-2025(%) |
6.0 |
|
Key countries |
US, China, India, Japan, Germany, Italy, South Korea, Brazil, France, and Australia |
|
Competitive landscape |
Leading Companies, Market Positioning of Companies, Competitive Strategies, and Industry Risks |
What are the Key Data Covered in this Packaging Resins Market Research and Growth Report?
- CAGR of the Packaging Resins industry during the forecast period
- Detailed information on factors that will drive the market growth and forecasting between 2025 and 2029
- Precise estimation of the size of the market and its contribution to the industry in focus on the parent market
- Accurate predictions about upcoming growth and trends and changes in consumer behaviour
- Growth of the market across APAC, North America, Europe, South America, and the Middle East and Africa
- A thorough analysis of the market's competitive landscape and detailed information about companies
- Comprehensive analysis of factors that will challenge the packaging resins market growth of industry companies
We can help! Our analysts can customize this packaging resins market research report to meet your requirements.
 RIA -
RIA - 
