Pain Management Devices Market Analysis, Size, and Forecast 2024-2028: North America (US and Canada), Europe (France, Germany, Italy, and UK), Middle East and Africa (UAE), APAC (China, India, Japan, and South Korea), South America (Brazil), and Rest of World (ROW)

Pain Management Devices Market Analysis, Size, and Forecast 2024-2028:
North America (US and Canada), Europe (France, Germany, Italy, and UK), Middle East and Africa (UAE), APAC (China, India, Japan, and South Korea), South America (Brazil), and Rest of World (ROW)

Published: Jul 2024 172 Pages SKU: IRTNTR75682

Market Overview at a Glance

$3.11 B
Market Opportunity
9.45%
CAGR
8.42
YoY growth 2023-2024(%)

Pain Management Devices Market Size 2024-2028

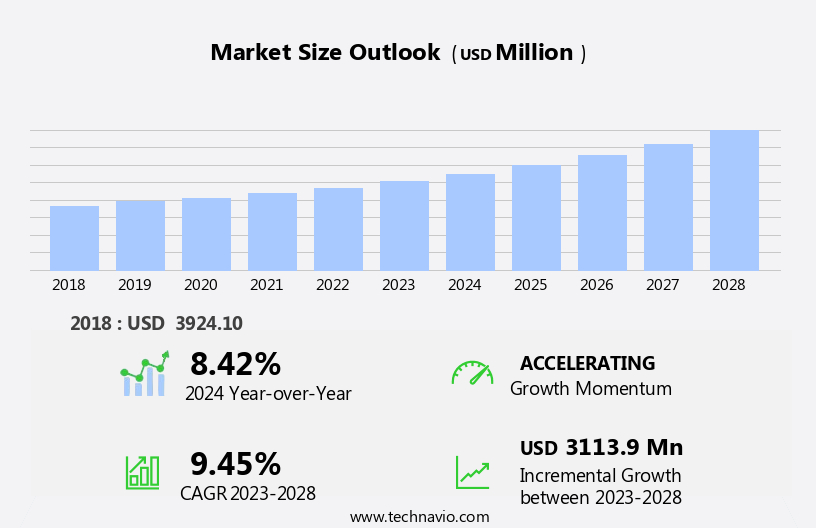
The pain management devices market size is forecast to increase by USD 3.11 billion, at a CAGR of 9.45% between 2023 and 2028. The market is witnessing significant growth, driven by the increasing prevalence of chronic diseases among the geriatric population.

Major Market Trends & Insights

  • North America dominated the market and accounted for a 48% share in 2022.
  • The market is expected to grow significantly in Asia region as well over the forecast period.
  • Based on the Application, the neuropathic pain segment led the market and was valued at USD 1.58 billion of the global revenue in 2022.
  • Based on the Product, the neurostimulation devices segment accounted for the largest market revenue share in 2022.

Market Size & Forecast

  • 2024 Market Size: USD 5.91 Billion
  • Future Opportunities: USD 3.11 Billion
  • CAGR (2023-2028): 9.45%
  • North America: Largest market in 2022

The market continues to evolve, driven by advancements in technology and the growing prevalence of chronic pain conditions. Neuropathic and nociceptive pain, inflammatory and acute, necessitate a multifaceted approach to effective management. Pain monitoring systems enable real-time assessment, while medication adherence tools ensure patients take prescribed medications as directed. Pain clinics and rehabilitation centers offer comprehensive care, integrating various modalities such as neuromodulation devices, radiofrequency ablation, and epidural steroid injections. These interventions, along with surgical options and laser therapy, offer relief for those suffering from chronic pain. Non-opioid analgesics, topical agents, and adjunctive therapies like ultrasound and occupational therapy, play crucial roles in managing pain.

What will be the Size of the Pain Management Devices Market during the forecast period?

Pain Management Devices Market Size

Explore in-depth regional segment analysis with market size data - historical 2018-2022 and forecasts 2024-2028 - in the full report.  
Request Free Sample

Implantable pain pumps and drug delivery systems provide long-term relief, while patient education and physical therapy empower individuals to manage their pain effectively. The ongoing unfolding of market activities reveals a dynamic landscape, with new technologies and applications continually emerging. Pain assessment scales and nerve blocks offer valuable insights into pain severity and potential treatment options, further enhancing the ability to provide effective pain management solutions. The musculoskeletal disorder segment is the second largest segment of the application and was valued at USD 1.27 billion in 2022.

With an aging demographic, the demand for effective pain management solutions is on the rise. Furthermore, technological advances in ablation devices are revolutionizing pain treatment, offering minimally invasive and precise solutions. However, the market faces challenges, including the high cost of neurostimulation devices and procedures, which may limit accessibility for some patients.

Companies in this market must navigate these challenges by exploring cost-effective solutions and collaborating with healthcare providers to offer affordable financing options. By focusing on innovation and accessibility, players can capitalize on the growing demand for pain management devices and meet the needs of an aging population.

How is this Pain Management Devices Industry segmented?

The pain management devices industry research report provides comprehensive data (region-wise segment analysis), with forecasts and estimates in "USD million" for the period 2024-2028, as well as historical data from 2018-2022 for the following segments.

  • Application
    • Neuropathic pain
    • Musculoskeletal disorder
    • Cancer
    • Facial and migraine
    • Others
  • Product
    • Neurostimulation devices
    • Infusion pumps
    • Ablation devices
  • Product Type
    • Chronic Pain
    • Post-Surgical Pain
    • Cancer Pain
    • Neuropathic Pain
  • End-User
    • Hospitals
    • Clinics
    • Home Care
  • Technology
    • Wearable Devices
    • Implantable Devices
    • Non-Invasive Devices
  • Geography
    • North America
      • US
      • Canada
    • Europe
      • France
      • Germany
      • Italy
      • UK
    • Middle East and Africa
      • UAE
    • APAC
      • China
      • India
      • Japan
      • South Korea
    • South America
      • Brazil
    • Rest of World (ROW)

By Application Insights

The neuropathic pain segment is estimated to witness significant growth during the forecast period. The segment was valued at USD 1.58 billion in 2022. It continued to the largest segment at a CAGR of 6.37%.

The market is witnessing significant growth due to the increasing prevalence of chronic pain conditions, particularly neuropathic pain. Neuropathic pain, characterized by damaged or dysfunctional nerve fibers sending incorrect signals to pain centers, affects a large and growing population, especially those with diabetes or prediabetes management. Topical analgesics, implantable pain pumps, neuromodulation devices, and non-opioid analgesics are among the solutions employed in managing this complex, chronic condition. Technological advancements have led to innovations in pain monitoring systems, medication adherence tools, and multimodal pain management approaches. Other interventions, such as ultrasound therapy, facet joint injections, radiofrequency ablation, epidural steroid injections, surgical interventions, laser therapy, opioid analgesics, nerve blocks, and adjunctive therapies, are also utilized in pain clinics and rehabilitation centers.

Patient education, physical therapy, and occupational therapy play crucial roles in managing pain effectively. Inflammatory pain and acute pain management also require specialized attention. Home healthcare and drug delivery systems, including peripheral nerve stimulation and trigger point injections, further expand the market landscape.

Pain Management Devices Market Size

Request Free Sample

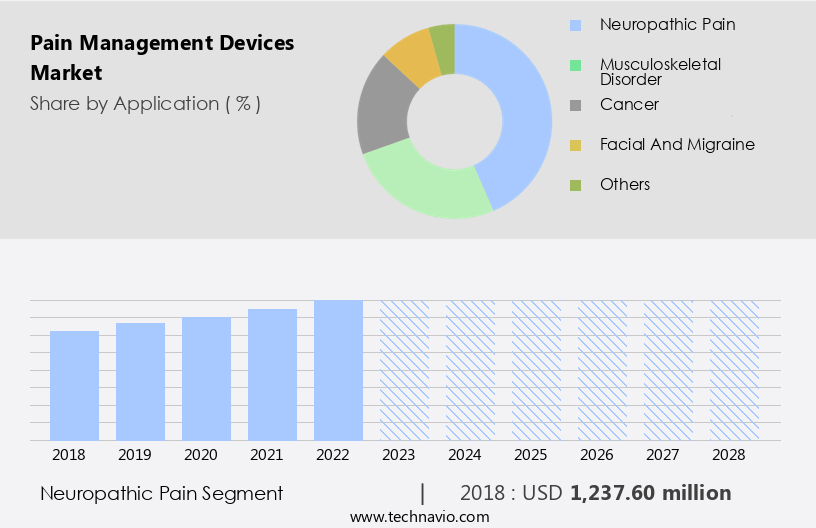
The Neuropathic pain segment was valued at USD 1.24 billion in 2018 and showed a gradual increase during the forecast period.

Regional Analysis

North America is estimated to contribute 48% to the growth of the global market during the forecast period.Technavio's analysts have elaborately explained the regional trends and drivers that shape the market during the forecast period.

Pain Management Devices Market Share by Geography

 Request Free Sample

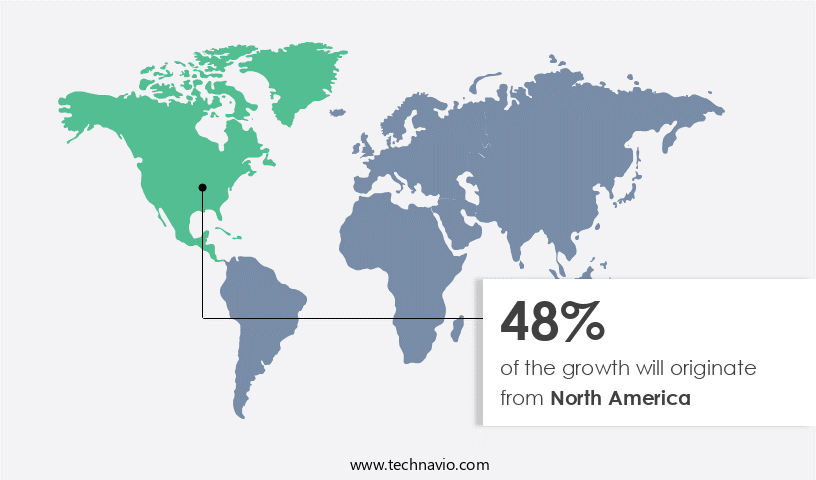
In the market, North America holds the largest share due to the rising prevalence of chronic conditions like diabetes, cancer, and arthritis. Data suggests that the future opportunities for growth in the North America region estimates to be around USD 3.11 billion. The region's large geriatric population, increasing healthcare expenditure, and technological advancements driving innovative devices are significant growth factors. Patients' growing awareness of pain management options, approvals of new products, and the presence of both global and local manufacturers contribute to market expansion. Chronic pain conditions, such as neuropathic and inflammatory pain, are treated through various methods, including topical analgesics, implantable pain pumps, neuromodulation devices, non-opioid analgesics, ultrasound therapy, facet joint injections, pain monitoring systems, medication adherence, and multimodal pain management.

Acute pain management methods, such as nerve blocks, surgical interventions, epidural steroid injections, radiofrequency ablation, laser therapy, opioid analgesics, occupational therapy, rehabilitation centers, home healthcare, peripheral nerve stimulation, drug delivery systems, trigger point injections, patient education, physical therapy, and nociceptive pain treatments, are also employed. Adjunctive therapies, including pain assessment scales, medication adherence tools, and patient education programs, enhance the effectiveness of pain management strategies. The market's growth is further fueled by the increasing demand for minimally invasive procedures, the integration of digital health technologies, and the rising focus on personalized pain management solutions.

Market Dynamics

Our researchers analyzed the data with 2023 as the base year, along with the key drivers, trends, and challenges. A holistic analysis of drivers will help companies refine their marketing strategies to gain a competitive advantage.

The global pain management devices market size and forecast projects growth, driven by pain management devices market trends 2024-2028. B2B pain device solutions leverage advanced pain relief technologies for efficacy. Pain management devices market growth opportunities 2025 include devices for chronic pain and portable pain relief devices, meeting patient needs. Pain device management software optimizes operations, while pain management devices market competitive analysis highlights key manufacturers. Sustainable pain device practices align with eco-friendly medical trends. Pain management devices regulations 2024-2028 shapes pain device demand in North America 2025. Non-invasive pain solutions and premium pain device insights boost adoption. Pain devices for home use and customized pain relief devices target niches. Pain management devices market challenges and solutions address cost, with direct procurement strategies for pain devices and pain device pricing optimization enhancing profitability. Data-driven pain device analytics and smart pain relief trends drive innovation.

What are the key market drivers leading to the rise in the adoption of Pain Management Devices Industry?

  • The prevalence of chronic diseases among the geriatric population serves as the primary driver for market growth in this sector. 
  • Chronic diseases, including neuropathic pain, are on the rise among the aging population in the US, with approximately 15% of adults reporting multiple chronic medical conditions in 2021, compared to around 11% of older millennials. Sedentary lifestyles and changing eating habits contribute to the prevalence of chronic diseases such as heart disease, stroke, cancer, arthritis, and chronic pain, including low back pain and knee pain. According to the Centers for Disease Control and Prevention (CDC) and the National Center for Health Statistics (NCHS), most people with chronic pain experience pain in various body parts.
  • To manage chronic pain effectively, various pain management devices have gained popularity. These include topical analgesics, non-opioid analgesics, implantable pain pumps, neuromodulation devices, and ultrasound therapy. Facet joint injections are also used for pain management. Neuropathic pain, in particular, can be challenging to manage, and these devices offer effective, non-opioid alternatives for chronic pain management.

What are the market trends shaping the Pain Management Devices Industry?

  • The trend in the medical field is leaning towards technological advancements in ablation devices. These innovations are mandated to shape the upcoming market.
  • Pain management is a critical aspect of healthcare, and the market for pain management devices is witnessing significant advancements. One of the key trends in this market is the development of pain monitoring systems to improve medication adherence and pain assessment. These systems enable healthcare providers to assess pain levels accurately and adjust treatment plans accordingly. Another area of focus is the use of minimally invasive procedures such as radiofrequency ablation and epidural steroid injections. These interventions offer patients an alternative to surgical procedures and have shown promising results in managing chronic pain. For instance, radiofrequency ablation involves the use of heat or cold to destroy a small area of nerve tissue, preventing the transmission of pain signals.
  • Technological advances in these procedures have led to improved outcomes and increased patient satisfaction. companies in the market are investing heavily in research and development to create technologically advanced pain management devices. For example, Medtronic's Cool-tip radiofrequency ablation system E series offers high energy and creates large ablation target zones in a short period of time. Laser therapy is another area of interest in the market. This non-invasive therapy uses light energy to stimulate healing and reduce pain. It is often used to treat conditions such as arthritis and muscle strains. In summary, the market is witnessing significant growth due to the increasing prevalence of chronic pain conditions and the development of advanced technologies to manage them.

What challenges does the Pain Management Devices Industry face during its growth?

  • The high cost of neurostimulation devices and procedures poses a significant challenge to the industry's growth, as both the acquisition of technology and implementation of treatments can be financially prohibitive for many patients and healthcare providers. 
  • Pain management devices, including opioid analgesics, nerve blocks, and adjunctive therapies, play a crucial role in managing various types of pain, such as acute and inflammatory pain. However, the high cost of advanced pain management devices, like neurostimulation systems, poses a significant barrier to their adoption in some developing countries. For instance, the initial implantation of pulse generators for neurostimulation can cost over USD20,000, while deep brain stimulation surgeries in the US can range from USD65,000 to USD100,000. Additionally, end-users bear additional costs for post-operative device adjustments, battery replacements, and maintenance.
  • These expenses can limit the accessibility of these advanced pain management solutions, particularly in resource-limited settings. In rehabilitation centers and home healthcare, less expensive alternatives, such as occupational therapy and physical therapy, are often used for pain management.

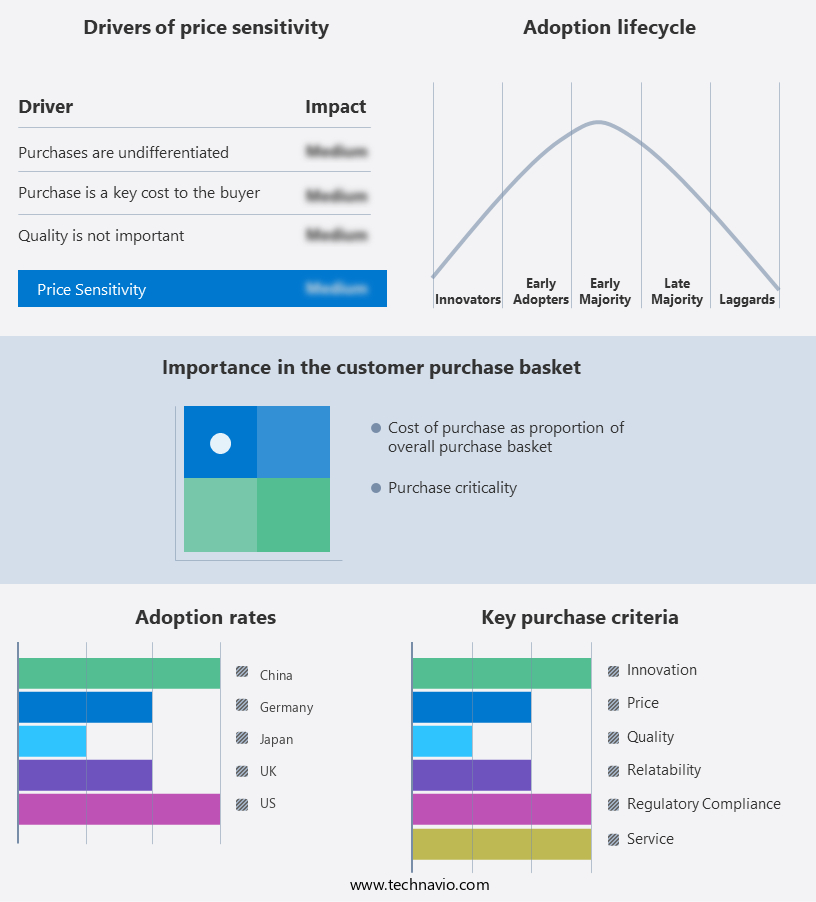
Exclusive Customer Landscape

The pain management devices market forecasting report includes the adoption lifecycle of the market, covering from the innovator's stage to the laggard's stage. It focuses on adoption rates in different regions based on penetration. Furthermore, the pain management devices market report also includes key purchase criteria and drivers of price sensitivity to help companies evaluate and develop their market growth analysis strategies.

Pain Management Devices Market Share by Geography

 Customer Landscape

Key Companies & Market Insights

Companies are implementing various strategies, such as strategic alliances, pain management devices market forecast, partnerships, mergers and acquisitions, geographical expansion, and product/service launches, to enhance their presence in the industry.

Abbott Laboratories - The company specializes in advanced pain management solutions, including the Proclaim SCS system, which utilizes spinal cord stimulation technology to effectively manage chronic pain for patients. This non-invasive device delivers targeted electrical pulses to the spinal cord, providing relief and improving overall quality of life. The technology is backed by extensive clinical research and has been proven effective in managing various types of pain.

The industry research and growth report includes detailed analyses of the competitive landscape of the market and information about key companies, including:

  • Abbott Laboratories
  • AtriCure Inc.
  • Avanos Medical Inc.
  • B.Braun SE
  • Baxter International Inc.
  • Becton Dickinson and Co.
  • Boston Scientific Corp.
  • DJO Global Inc.
  • ICU Medical Inc.
  • InfuTronix
  • Johnson and Johnson Services Inc.
  • Kimberly Clark Corp.
  • Medtronic Plc
  • Micrel Medical Devices SA
  • Moog Inc.
  • Nevro Corp.
  • OMRON Corp.
  • Pfizer Inc.
  • Stryker Corp.
  • Theragen Inc.

Qualitative and quantitative analysis of companies has been conducted to help clients understand the wider business environment as well as the strengths and weaknesses of key industry players. Data is qualitatively analyzed to categorize companies as pure play, category-focused, industry-focused, and diversified; it is quantitatively analyzed to categorize companies as dominant, leading, strong, tentative, and weak.

Recent Development and News in Pain Management Devices Market

  • In January 2024, Medtronic, a leading medical technology company, announced the FDA approval of its new neurostimulation system, Infuse Therapy, for the management of chronic pain (Medtronic Press Release, 2024). This innovative device uses electrical impulses to block pain signals from the brain, providing an alternative to opioid-based treatments.
  • In March 2024, Abbott Laboratories and Neuromod Devices, a neurostimulation technology company, entered into a strategic partnership to develop and commercialize a novel pain management system. The collaboration combines Abbott's expertise in medical devices and Neuromod's proprietary technology, aiming to improve patient outcomes and expand their market presence (Abbott Laboratories Press Release, 2024).
  • In July 2024, Boston Scientific Corporation completed the acquisition of Prevail Medical, a company specializing in minimally invasive spinal cord stimulation systems. This acquisition strengthened Boston Scientific's pain management portfolio and expanded its presence in the growing neuromodulation market (Boston Scientific Corporation Press Release, 2024).
  • In May 2025, the European Commission granted marketing authorization for Stryker's new spinal cord stimulation system, Opus SCS. This approval marks the first major regulatory milestone for the system, paving the way for its commercialization in Europe and expanding Stryker's pain management offerings (Stryker Press Release, 2025).

Research Analyst Overview

  • The market encompasses a range of technologies, including implantable pulse generators and lead wires, aimed at providing relief for patients undergoing implantation procedures. Healthcare providers require extensive training to ensure proper device implantation and programming, while safety and efficacy studies continue to address concerns regarding drug interactions and long-term effects. Implantable batteries and genetic testing contribute to improved patient outcomes and personalized medicine. Clinical trials and regulatory approvals are essential for bringing new devices to market, with cost-effectiveness analysis and healthcare economics playing a significant role in market dynamics.
  • Remote monitoring, machine learning, and data analytics facilitate post-market surveillance, enhancing patient compliance and device longevity. Despite advancements, safety concerns persist, with adverse events and side effects requiring ongoing attention from manufacturers and regulators.

Dive into Technavio's robust research methodology, blending expert interviews, extensive data synthesis, and validated models for unparalleled Pain Management Devices Market insights. See full methodology.

Market Scope

Report Coverage

Details

Page number

172

Base year

2023

Historic period

2018-2022

Forecast period

2024-2028

Growth momentum & CAGR

Accelerate at a CAGR of 9.45%

Market growth 2024-2028

USD 3113.9 million

Market structure

Fragmented

YoY growth 2023-2024(%)

8.42

Key countries

US, China, India, Germany, Japan, UK, South Korea, Canada, Brazil, France, UAE, and Italy

Competitive landscape

Leading Companies, Market Positioning of Companies, Competitive Strategies, and Industry Risks

Request Free Sample

What are the Key Data Covered in this Pain Management Devices Market Research and Growth Report?

  • CAGR of the Pain Management Devices industry during the forecast period
  • Detailed information on factors that will drive the growth and forecasting between 2024 and 2028
  • Precise estimation of the size of the market and its contribution of the industry in focus to the parent market
  • Accurate predictions about upcoming growth and trends and changes in consumer behaviour
  • Growth of the market across North America, Asia, Europe, and Rest of World (ROW)
  • Thorough analysis of the market's competitive landscape and detailed information about companies
  • Comprehensive analysis of factors that will challenge the pain management devices market growth of industry companies

We can help! Our analysts can customize this pain management devices market research report to meet your requirements.

Get in touch

1 Executive Summary

  • 1.1 Market overview
    • Executive Summary - Chart on Market Overview
    • Executive Summary - Data Table on Market Overview
    • Executive Summary - Chart on Global Market Characteristics
    • Executive Summary - Chart on Market by Geography
    • Executive Summary - Chart on Market Segmentation by Application
    • Executive Summary - Chart on Market Segmentation by Product
    • Executive Summary - Chart on Incremental Growth
    • Executive Summary - Data Table on Incremental Growth
    • Executive Summary - Chart on Company Market Positioning

2 Market Landscape

  • 2.1 Market ecosystem
    • Parent Market
    • Data Table on - Parent Market
  • 2.2 Market characteristics
    • Market characteristics analysis
  • 2.3 Value chain analysis
    • Value Chain Analysis

3 Market Sizing

  • 3.1 Market definition
    • Offerings of companies included in the market definition
  • 3.2 Market segment analysis
    • Market segments
  • 3.3 Market size 2023
    • 3.4 Market outlook: Forecast for 2023-2028
      • Chart on Global - Market size and forecast 2023-2028 ($ million)
      • Data Table on Global - Market size and forecast 2023-2028 ($ million)
      • Chart on Global Market: Year-over-year growth 2023-2028 (%)
      • Data Table on Global Market: Year-over-year growth 2023-2028 (%)

    4 Historic Market Size

    • 4.1 Global Pain Management Devices Market 2018 - 2022
      • Historic Market Size - Data Table on Global Pain Management Devices Market 2018 - 2022 ($ million)
    • 4.2 Application segment analysis 2018 - 2022
      • Historic Market Size - Application Segment 2018 - 2022 ($ million)
    • 4.3 Product segment analysis 2018 - 2022
      • Historic Market Size - Product Segment 2018 - 2022 ($ million)
    • 4.4 Geography segment analysis 2018 - 2022
      • Historic Market Size - Geography Segment 2018 - 2022 ($ million)
    • 4.5 Country segment analysis 2018 - 2022
      • Historic Market Size - Country Segment 2018 - 2022 ($ million)

    5 Five Forces Analysis

    • 5.1 Five forces summary
      • Five forces analysis - Comparison between 2023 and 2028
    • 5.2 Bargaining power of buyers
      • Bargaining power of buyers - Impact of key factors 2023 and 2028
    • 5.3 Bargaining power of suppliers
      • Bargaining power of suppliers - Impact of key factors in 2023 and 2028
    • 5.4 Threat of new entrants
      • Threat of new entrants - Impact of key factors in 2023 and 2028
    • 5.5 Threat of substitutes
      • Threat of substitutes - Impact of key factors in 2023 and 2028
    • 5.6 Threat of rivalry
      • Threat of rivalry - Impact of key factors in 2023 and 2028
    • 5.7 Market condition
      • Chart on Market condition - Five forces 2023 and 2028

    6 Market Segmentation by Application

    • 6.1 Market segments
      • Chart on Application - Market share (2023-2028) (%)
      • Data Table on Application - Market share (2023-2028) (%)
    • 6.2 Comparison by Application
      • Chart on Comparison by Application
      • Data Table on Comparison by Application
    • 6.3 Neuropathic pain - Market size and forecast (2023-2028)
      • Chart on Neuropathic pain - Market size and forecast (2023-2028) ($ million)
      • Data Table on Neuropathic pain - Market size and forecast (2023-2028) ($ million)
      • Chart on Neuropathic pain - Year-over-year growth (2023-2028) (%)
      • Data Table on Neuropathic pain - Year-over-year growth (2023-2028) (%)
    • 6.4 Musculoskeletal disorder - Market size and forecast (2023-2028)
      • Chart on Musculoskeletal disorder - Market size and forecast (2023-2028) ($ million)
      • Data Table on Musculoskeletal disorder - Market size and forecast (2023-2028) ($ million)
      • Chart on Musculoskeletal disorder - Year-over-year growth (2023-2028) (%)
      • Data Table on Musculoskeletal disorder - Year-over-year growth (2023-2028) (%)
    • 6.5 Cancer - Market size and forecast (2023-2028)
      • Chart on Cancer - Market size and forecast (2023-2028) ($ million)
      • Data Table on Cancer - Market size and forecast (2023-2028) ($ million)
      • Chart on Cancer - Year-over-year growth (2023-2028) (%)
      • Data Table on Cancer - Year-over-year growth (2023-2028) (%)
    • 6.6 Facial and migraine - Market size and forecast (2023-2028)
      • Chart on Facial and migraine - Market size and forecast (2023-2028) ($ million)
      • Data Table on Facial and migraine - Market size and forecast (2023-2028) ($ million)
      • Chart on Facial and migraine - Year-over-year growth (2023-2028) (%)
      • Data Table on Facial and migraine - Year-over-year growth (2023-2028) (%)
    • 6.7 Others - Market size and forecast (2023-2028)
      • Chart on Others - Market size and forecast (2023-2028) ($ million)
      • Data Table on Others - Market size and forecast (2023-2028) ($ million)
      • Chart on Others - Year-over-year growth (2023-2028) (%)
      • Data Table on Others - Year-over-year growth (2023-2028) (%)
    • 6.8 Market opportunity by Application
      • Market opportunity by Application ($ million)
      • Data Table on Market opportunity by Application ($ million)

    7 Market Segmentation by Product

    • 7.1 Market segments
      • Chart on Product - Market share (2023-2028) (%)
      • Data Table on Product - Market share (2023-2028) (%)
    • 7.2 Comparison by Product
      • Chart on Comparison by Product
      • Data Table on Comparison by Product
    • 7.3 Neurostimulation devices - Market size and forecast (2023-2028)
      • Chart on Neurostimulation devices - Market size and forecast (2023-2028) ($ million)
      • Data Table on Neurostimulation devices - Market size and forecast (2023-2028) ($ million)
      • Chart on Neurostimulation devices - Year-over-year growth (2023-2028) (%)
      • Data Table on Neurostimulation devices - Year-over-year growth (2023-2028) (%)
    • 7.4 Infusion pumps - Market size and forecast (2023-2028)
      • Chart on Infusion pumps - Market size and forecast (2023-2028) ($ million)
      • Data Table on Infusion pumps - Market size and forecast (2023-2028) ($ million)
      • Chart on Infusion pumps - Year-over-year growth (2023-2028) (%)
      • Data Table on Infusion pumps - Year-over-year growth (2023-2028) (%)
    • 7.5 Ablation devices - Market size and forecast (2023-2028)
      • Chart on Ablation devices - Market size and forecast (2023-2028) ($ million)
      • Data Table on Ablation devices - Market size and forecast (2023-2028) ($ million)
      • Chart on Ablation devices - Year-over-year growth (2023-2028) (%)
      • Data Table on Ablation devices - Year-over-year growth (2023-2028) (%)
    • 7.6 Market opportunity by Product
      • Market opportunity by Product ($ million)
      • Data Table on Market opportunity by Product ($ million)

    8 Market Segmentation by Product Type

    • 8.1 Market segments
      • Chart on Product Type - Market share (2023-2028) (%)
      • Data Table on Product Type - Market share (2023-2028) (%)
    • 8.2 Comparison by Product Type
      • Chart on Comparison by Product Type
      • Data Table on Comparison by Product Type
    • 8.3 Chronic Pain - Market size and forecast (2023-2028)
      • Chart on Chronic Pain - Market size and forecast (2023-2028) ($ million)
      • Data Table on Chronic Pain - Market size and forecast (2023-2028) ($ million)
      • Chart on Chronic Pain - Year-over-year growth (2023-2028) (%)
      • Data Table on Chronic Pain - Year-over-year growth (2023-2028) (%)
    • 8.4 Post-Surgical Pain - Market size and forecast (2023-2028)
      • Chart on Post-Surgical Pain - Market size and forecast (2023-2028) ($ million)
      • Data Table on Post-Surgical Pain - Market size and forecast (2023-2028) ($ million)
      • Chart on Post-Surgical Pain - Year-over-year growth (2023-2028) (%)
      • Data Table on Post-Surgical Pain - Year-over-year growth (2023-2028) (%)
    • 8.5 Cancer Pain - Market size and forecast (2023-2028)
      • Chart on Cancer Pain - Market size and forecast (2023-2028) ($ million)
      • Data Table on Cancer Pain - Market size and forecast (2023-2028) ($ million)
      • Chart on Cancer Pain - Year-over-year growth (2023-2028) (%)
      • Data Table on Cancer Pain - Year-over-year growth (2023-2028) (%)
    • 8.6 Neuropathic Pain - Market size and forecast (2023-2028)
      • Chart on Neuropathic Pain - Market size and forecast (2023-2028) ($ million)
      • Data Table on Neuropathic Pain - Market size and forecast (2023-2028) ($ million)
      • Chart on Neuropathic Pain - Year-over-year growth (2023-2028) (%)
      • Data Table on Neuropathic Pain - Year-over-year growth (2023-2028) (%)
    • 8.7 Market opportunity by Product Type
      • Market opportunity by Product Type ($ million)
      • Data Table on Market opportunity by Product Type ($ million)

    9 Market Segmentation by End-User

    • 9.1 Market segments
      • Chart on End-User - Market share (2023-2028) (%)
      • Data Table on End-User - Market share (2023-2028) (%)
    • 9.2 Comparison by End-User
      • Chart on Comparison by End-User
      • Data Table on Comparison by End-User
    • 9.3 Hospitals - Market size and forecast (2023-2028)
      • Chart on Hospitals - Market size and forecast (2023-2028) ($ million)
      • Data Table on Hospitals - Market size and forecast (2023-2028) ($ million)
      • Chart on Hospitals - Year-over-year growth (2023-2028) (%)
      • Data Table on Hospitals - Year-over-year growth (2023-2028) (%)
    • 9.4 Clinics - Market size and forecast (2023-2028)
      • Chart on Clinics - Market size and forecast (2023-2028) ($ million)
      • Data Table on Clinics - Market size and forecast (2023-2028) ($ million)
      • Chart on Clinics - Year-over-year growth (2023-2028) (%)
      • Data Table on Clinics - Year-over-year growth (2023-2028) (%)
    • 9.5 Home Care - Market size and forecast (2023-2028)
      • Chart on Home Care - Market size and forecast (2023-2028) ($ million)
      • Data Table on Home Care - Market size and forecast (2023-2028) ($ million)
      • Chart on Home Care - Year-over-year growth (2023-2028) (%)
      • Data Table on Home Care - Year-over-year growth (2023-2028) (%)
    • 9.6 Market opportunity by End-User
      • Market opportunity by End-User ($ million)
      • Data Table on Market opportunity by End-User ($ million)

    10 Market Segmentation by Technology

    • 10.1 Market segments
      • Chart on Technology - Market share (2023-2028) (%)
      • Data Table on Technology - Market share (2023-2028) (%)
    • 10.2 Comparison by Technology
      • Chart on Comparison by Technology
      • Data Table on Comparison by Technology
    • 10.3 Wearable Devices - Market size and forecast (2023-2028)
      • Chart on Wearable Devices - Market size and forecast (2023-2028) ($ million)
      • Data Table on Wearable Devices - Market size and forecast (2023-2028) ($ million)
      • Chart on Wearable Devices - Year-over-year growth (2023-2028) (%)
      • Data Table on Wearable Devices - Year-over-year growth (2023-2028) (%)
    • 10.4 Implantable Devices - Market size and forecast (2023-2028)
      • Chart on Implantable Devices - Market size and forecast (2023-2028) ($ million)
      • Data Table on Implantable Devices - Market size and forecast (2023-2028) ($ million)
      • Chart on Implantable Devices - Year-over-year growth (2023-2028) (%)
      • Data Table on Implantable Devices - Year-over-year growth (2023-2028) (%)
    • 10.5 Non-Invasive Devices - Market size and forecast (2023-2028)
      • Chart on Non-Invasive Devices - Market size and forecast (2023-2028) ($ million)
      • Data Table on Non-Invasive Devices - Market size and forecast (2023-2028) ($ million)
      • Chart on Non-Invasive Devices - Year-over-year growth (2023-2028) (%)
      • Data Table on Non-Invasive Devices - Year-over-year growth (2023-2028) (%)
    • 10.6 Market opportunity by Technology
      • Market opportunity by Technology ($ million)
      • Data Table on Market opportunity by Technology ($ million)

    11 Customer Landscape

    • 11.1 Customer landscape overview
      • Analysis of price sensitivity, lifecycle, customer purchase basket, adoption rates, and purchase criteria

    12 Geographic Landscape

    • 12.1 Geographic segmentation
      • Chart on Market share by geography 2023-2028 (%)
      • Data Table on Market share by geography 2023-2028 (%)
    • 12.2 Geographic comparison
      • Chart on Geographic comparison
      • Data Table on Geographic comparison
    • 12.3 North America - Market size and forecast 2023-2028
      • Chart on North America - Market size and forecast 2023-2028 ($ million)
      • Data Table on North America - Market size and forecast 2023-2028 ($ million)
      • Chart on North America - Year-over-year growth 2023-2028 (%)
      • Data Table on North America - Year-over-year growth 2023-2028 (%)
    • 12.4 Asia - Market size and forecast 2023-2028
      • Chart on Asia - Market size and forecast 2023-2028 ($ million)
      • Data Table on Asia - Market size and forecast 2023-2028 ($ million)
      • Chart on Asia - Year-over-year growth 2023-2028 (%)
      • Data Table on Asia - Year-over-year growth 2023-2028 (%)
    • 12.5 Europe - Market size and forecast 2023-2028
      • Chart on Europe - Market size and forecast 2023-2028 ($ million)
      • Data Table on Europe - Market size and forecast 2023-2028 ($ million)
      • Chart on Europe - Year-over-year growth 2023-2028 (%)
      • Data Table on Europe - Year-over-year growth 2023-2028 (%)
    • 12.6 Rest of World (ROW) - Market size and forecast 2023-2028
      • Chart on Rest of World (ROW) - Market size and forecast 2023-2028 ($ million)
      • Data Table on Rest of World (ROW) - Market size and forecast 2023-2028 ($ million)
      • Chart on Rest of World (ROW) - Year-over-year growth 2023-2028 (%)
      • Data Table on Rest of World (ROW) - Year-over-year growth 2023-2028 (%)
    • 12.7 US - Market size and forecast 2023-2028
      • Chart on US - Market size and forecast 2023-2028 ($ million)
      • Data Table on US - Market size and forecast 2023-2028 ($ million)
      • Chart on US - Year-over-year growth 2023-2028 (%)
      • Data Table on US - Year-over-year growth 2023-2028 (%)
    • 12.8 China - Market size and forecast 2023-2028
      • Chart on China - Market size and forecast 2023-2028 ($ million)
      • Data Table on China - Market size and forecast 2023-2028 ($ million)
      • Chart on China - Year-over-year growth 2023-2028 (%)
      • Data Table on China - Year-over-year growth 2023-2028 (%)
    • 12.9 Japan - Market size and forecast 2023-2028
      • Chart on Japan - Market size and forecast 2023-2028 ($ million)
      • Data Table on Japan - Market size and forecast 2023-2028 ($ million)
      • Chart on Japan - Year-over-year growth 2023-2028 (%)
      • Data Table on Japan - Year-over-year growth 2023-2028 (%)
    • 12.10 Germany - Market size and forecast 2023-2028
      • Chart on Germany - Market size and forecast 2023-2028 ($ million)
      • Data Table on Germany - Market size and forecast 2023-2028 ($ million)
      • Chart on Germany - Year-over-year growth 2023-2028 (%)
      • Data Table on Germany - Year-over-year growth 2023-2028 (%)
    • 12.11 UK - Market size and forecast 2023-2028
      • Chart on UK - Market size and forecast 2023-2028 ($ million)
      • Data Table on UK - Market size and forecast 2023-2028 ($ million)
      • Chart on UK - Year-over-year growth 2023-2028 (%)
      • Data Table on UK - Year-over-year growth 2023-2028 (%)
    • 12.12 Market opportunity by geography
      • Market opportunity by geography ($ million)
      • Data Tables on Market opportunity by geography ($ million)
    • 12.13 India - Market size and forecast (2023-2028)
      • Chart on India - Market size and forecast (2023-2028) ($ million)
      • Data Table on India - Market size and forecast (2023-2028) ($ million)
      • Chart on India - Year-over-year growth (2023-2028) (%)
      • Data Table on India - Year-over-year growth (2023-2028) (%)
    • 12.14 South Korea - Market size and forecast (2023-2028)
      • Chart on South Korea - Market size and forecast (2023-2028) ($ million)
      • Data Table on South Korea - Market size and forecast (2023-2028) ($ million)
      • Chart on South Korea - Year-over-year growth (2023-2028) (%)
      • Data Table on South Korea - Year-over-year growth (2023-2028) (%)
    • 12.15 Canada - Market size and forecast (2023-2028)
      • Chart on Canada - Market size and forecast (2023-2028) ($ million)
      • Data Table on Canada - Market size and forecast (2023-2028) ($ million)
      • Chart on Canada - Year-over-year growth (2023-2028) (%)
      • Data Table on Canada - Year-over-year growth (2023-2028) (%)
    • 12.16 Brazil - Market size and forecast (2023-2028)
      • Chart on Brazil - Market size and forecast (2023-2028) ($ million)
      • Data Table on Brazil - Market size and forecast (2023-2028) ($ million)
      • Chart on Brazil - Year-over-year growth (2023-2028) (%)
      • Data Table on Brazil - Year-over-year growth (2023-2028) (%)
    • 12.17 France - Market size and forecast (2023-2028)
      • Chart on France - Market size and forecast (2023-2028) ($ million)
      • Data Table on France - Market size and forecast (2023-2028) ($ million)
      • Chart on France - Year-over-year growth (2023-2028) (%)
      • Data Table on France - Year-over-year growth (2023-2028) (%)
    • 12.18 UAE - Market size and forecast (2023-2028)
      • Chart on UAE - Market size and forecast (2023-2028) ($ million)
      • Data Table on UAE - Market size and forecast (2023-2028) ($ million)
      • Chart on UAE - Year-over-year growth (2023-2028) (%)
      • Data Table on UAE - Year-over-year growth (2023-2028) (%)
    • 12.19 Italy - Market size and forecast (2023-2028)
      • Chart on Italy - Market size and forecast (2023-2028) ($ million)
      • Data Table on Italy - Market size and forecast (2023-2028) ($ million)
      • Chart on Italy - Year-over-year growth (2023-2028) (%)
      • Data Table on Italy - Year-over-year growth (2023-2028) (%)

    13 Drivers, Challenges, and Opportunity/Restraints

    • 13.1 Market drivers
      • 13.2 Market challenges
        • 13.3 Impact of drivers and challenges
          • Impact of drivers and challenges in 2023 and 2028
        • 13.4 Market opportunities/restraints

          14 Competitive Landscape

          • 14.1 Overview
            • 14.2 Competitive Landscape
              • Overview on criticality of inputs and factors of differentiation
            • 14.3 Landscape disruption
              • Overview on factors of disruption
            • 14.4 Industry risks
              • Impact of key risks on business

            15 Competitive Analysis

            • 15.1 Companies profiled
              • Companies covered
            • 15.2 Market positioning of companies
              • Matrix on companies position and classification
            • 15.3 Abbott Laboratories
              • Abbott Laboratories - Overview
              • Abbott Laboratories - Business segments
              • Abbott Laboratories - Key news
              • Abbott Laboratories - Key offerings
              • Abbott Laboratories - Segment focus
            • 15.4 Avanos Medical Inc.
              • Avanos Medical Inc. - Overview
              • Avanos Medical Inc. - Business segments
              • Avanos Medical Inc. - Key news
              • Avanos Medical Inc. - Key offerings
              • Avanos Medical Inc. - Segment focus
            • 15.5 B.Braun SE
              • B.Braun SE - Overview
              • B.Braun SE - Business segments
              • B.Braun SE - Key news
              • B.Braun SE - Key offerings
              • B.Braun SE - Segment focus
            • 15.6 Baxter International Inc.
              • Baxter International Inc. - Overview
              • Baxter International Inc. - Business segments
              • Baxter International Inc. - Key news
              • Baxter International Inc. - Key offerings
              • Baxter International Inc. - Segment focus
            • 15.7 Becton Dickinson and Co.
              • Becton Dickinson and Co. - Overview
              • Becton Dickinson and Co. - Business segments
              • Becton Dickinson and Co. - Key news
              • Becton Dickinson and Co. - Key offerings
              • Becton Dickinson and Co. - Segment focus
            • 15.8 Boston Scientific Corp.
              • Boston Scientific Corp. - Overview
              • Boston Scientific Corp. - Business segments
              • Boston Scientific Corp. - Key news
              • Boston Scientific Corp. - Key offerings
              • Boston Scientific Corp. - Segment focus
            • 15.9 DJO Global Inc.
              • DJO Global Inc. - Overview
              • DJO Global Inc. - Product / Service
              • DJO Global Inc. - Key offerings
            • 15.10 ICU Medical Inc.
              • ICU Medical Inc. - Overview
              • ICU Medical Inc. - Product / Service
              • ICU Medical Inc. - Key offerings
            • 15.11 Johnson and Johnson Services Inc.
              • Johnson and Johnson Services Inc. - Overview
              • Johnson and Johnson Services Inc. - Business segments
              • Johnson and Johnson Services Inc. - Key news
              • Johnson and Johnson Services Inc. - Key offerings
              • Johnson and Johnson Services Inc. - Segment focus
            • 15.12 Medtronic Plc
              • Medtronic Plc - Overview
              • Medtronic Plc - Business segments
              • Medtronic Plc - Key news
              • Medtronic Plc - Key offerings
              • Medtronic Plc - Segment focus
            • 15.13 Moog Inc.
              • Moog Inc. - Overview
              • Moog Inc. - Business segments
              • Moog Inc. - Key news
              • Moog Inc. - Key offerings
              • Moog Inc. - Segment focus
            • 15.14 Nevro Corp.
              • Nevro Corp. - Overview
              • Nevro Corp. - Product / Service
              • Nevro Corp. - Key offerings
            • 15.15 Pfizer Inc.
              • Pfizer Inc. - Overview
              • Pfizer Inc. - Product / Service
              • Pfizer Inc. - Key news
              • Pfizer Inc. - Key offerings
            • 15.16 Stryker Corp.
              • Stryker Corp. - Overview
              • Stryker Corp. - Business segments
              • Stryker Corp. - Key news
              • Stryker Corp. - Key offerings
              • Stryker Corp. - Segment focus
            • 15.17 Theragen Inc.
              • Theragen Inc. - Overview
              • Theragen Inc. - Product / Service
              • Theragen Inc. - Key offerings

            16 Appendix

            • 16.1 Scope of the report
              • 16.2 Inclusions and exclusions checklist
                • Inclusions checklist
                • Exclusions checklist
              • 16.3 Currency conversion rates for US$
                • Currency conversion rates for US$
              • 16.4 Research methodology
                • Research methodology
              • 16.5 Data procurement
                • Information sources
              • 16.6 Data validation
                • Data validation
              • 16.7 Validation techniques employed for market sizing
                • Validation techniques employed for market sizing
              • 16.8 Data synthesis
                • Data synthesis
              • 16.9 360 degree market analysis
                • 360 degree market analysis
              • 16.10 List of abbreviations
                • List of abbreviations

              Research Methodology

              Technavio presents a detailed picture of the market by way of study, synthesis, and summation of data from multiple sources. The analysts have presented the various facets of the market with a particular focus on identifying the key industry influencers. The data thus presented is comprehensive, reliable, and the result of extensive research, both primary and secondary.

              INFORMATION SOURCES

              Primary sources

              • Manufacturers and suppliers
              • Channel partners
              • Industry experts
              • Strategic decision makers

              Secondary sources

              • Industry journals and periodicals
              • Government data
              • Financial reports of key industry players
              • Historical data
              • Press releases

              DATA ANALYSIS

              Data Synthesis

              • Collation of data
              • Estimation of key figures
              • Analysis of derived insights

              Data Validation

              • Triangulation with data models
              • Reference against proprietary databases
              • Corroboration with industry experts

              REPORT WRITING

              Qualitative

              • Market drivers
              • Market challenges
              • Market trends
              • Five forces analysis

              Quantitative

              • Market size and forecast
              • Market segmentation
              • Geographical insights
              • Competitive landscape

              Interested in this report?

              Get your sample now to see our research methodology and insights!

              Download Now

              Frequently Asked Questions

              Pain Management Devices market growth will increase by $ 3113.9 mn during 2024-2028 .

              The Pain Management Devices market is expected to grow at a CAGR of 9.45% during 2024-2028 .

              Pain Management Devices market is segmented by Application( Neuropathic pain, Musculoskeletal disorder, Cancer, Facial and migraine, Others) Product( Neurostimulation devices, Infusion pumps, Ablation devices)

              Abbott Laboratories, AtriCure Inc., Avanos Medical Inc., B.Braun SE, Baxter International Inc., Becton Dickinson and Co., Boston Scientific Corp., DJO Global Inc., ICU Medical Inc., InfuTronix, Johnson and Johnson Services Inc., Kimberly Clark Corp., Medtronic Plc, Micrel Medical Devices SA, Moog Inc., Nevro Corp., OMRON Corp., Pfizer Inc., Stryker Corp., Theragen Inc. are a few of the key vendors in the Pain Management Devices market.

              North America will register the highest growth rate of 48% among the other regions. Therefore, the Pain Management Devices market in North America is expected to garner significant business opportunities for the vendors during the forecast period.

              US, China, India, Germany, Japan, UK, South Korea, Canada, Brazil, France, UAE, Italy

              • Increasing prevalence of chronic diseases among geriatric populationThe prevalence of chronic diseases is increasing among the geriatric population due to declining mortality rates. For instance is the driving factor this market.
              • in 2021 is the driving factor this market.
              • around 15% of adults in the US reported having at least two chronic medical conditions is the driving factor this market.
              • while only around 11% of older millennials reported the same. The sedentary lifestyle and changing eating habits of people make them susceptible to chronic diseases such as heart disease is the driving factor this market.
              • stroke is the driving factor this market.
              • cancer is the driving factor this market.
              • arthritis is the driving factor this market.
              • and chronic pain such as low back pain and knee pain. According to the CDC and the National Center for Health Statistics (NCHS) is the driving factor this market.
              • most people with chronic pain have pain in different body parts. According to the American Academy of Pain Medicine (AAPM) is the driving factor this market.
              • in the US is the driving factor this market.
              • the most common types of pain among adults are low back pain at 28.1% is the driving factor this market.
              • knee pain at 19.5% is the driving factor this market.
              • shoulder pain at 9.0% is the driving factor this market.
              • finger pain at 7.6% is the driving factor this market.
              • and hip pain at 7.1%. According to the CDC is the driving factor this market.
              • approximately 11% of the adult population of the US experience chronic pain. Pain management devices are used to treat chronic diseases. Hence is the driving factor this market.
              • the increasing prevalence of chronic diseases and the growth of the geriatric population will drive the growth of the global pain management devices market during the forecast period. is the driving factor this market.

              The Pain Management Devices market vendors should focus on grabbing business opportunities from the Neuropathic pain segment as it accounted for the largest market share in the base year.