Pea Starch Market Analysis APAC, North America, Europe, South America, Middle East and Africa - US, China, Germany, India, France - Size and Forecast 2024-2028

Pea Starch Market Analysis APAC, North America, Europe, South America, Middle East and Africa - US, China, Germany, India, France - Size and Forecast 2024-2028

Published: Jul 2024 154 Pages SKU: IRTNTR74976

Market Overview at a Glance

$109.7 Mn
Market Opportunity
6.79%
CAGR
6.23
YoY growth 2023-2024(%)

Pea Starch Market Size 2024-2028 

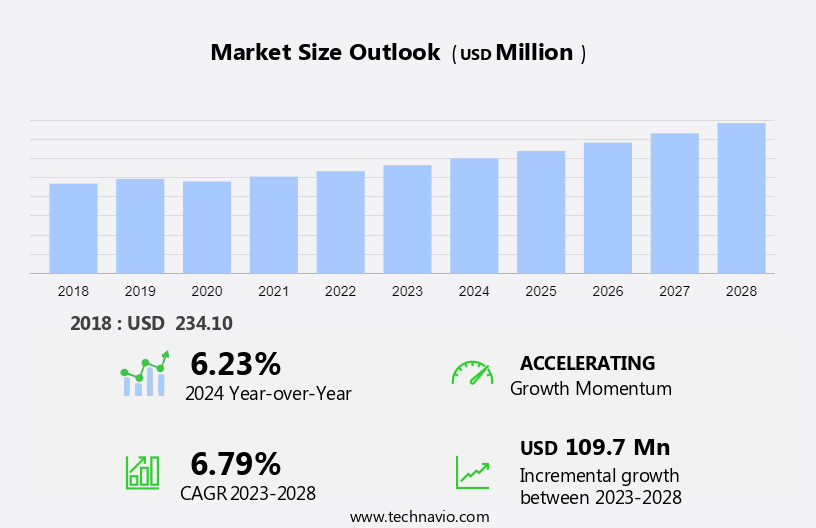
The pea starch market size is forecast to increase by USD 109.7 million at a CAGR of 6.79% between 2023 and 2028. In the market, key drivers include the rising preference for preventive healthcare and the increasing number of parents opting for gluten-free food and plant-based ingredients for their families. These trends are particularly prominent in the baked goods sector. However, challenges persist, such as the fluctuating prices of raw materials, which can hinder the scale of modified starch production. In the animal feed industry, pea starch serves as a valuable alternative to corn starch and meat products. Grains and pulses, including peas, are gaining popularity as sustainable and eco-friendly sources of nutrition in various industries. This market analysis report delves into these factors and more, providing valuable insights for stakeholders in the market.

Pea Starch Market Size

 Request Free Sample

It is gaining popularity in various industries due to its unique properties and increasing demand for healthier and sustainable alternatives. This article explores the key industries utilizing pea starch and its applications. The food and beverages sector is a significant consumer of pea starch. It is used as a thickener, stabilizer, and texturizer in various food products, including sauces, gravies, and baked goods. In the beverage industry, pea starch is used as a clarifier and stabilizer in beer and wine production.

In addition, the cosmetics industry is another major user of pea starch. It is used as a natural alternative to synthetic thickeners and emulsifiers. Pea starch provides excellent texture and stability to cosmetics products, making it a popular choice among consumers seeking natural and organic ingredients. Pea starch also finds extensive applications in the paper and textile industries. In paper manufacturing, it is used as a sizing agent to improve paper quality and durability. In textiles, it is used as a binder to enhance fabric strength and texture. The animal feed industry is another significant consumer of pea starch.

Furthermore, it is used as a source of protein and fiber in animal feed, particularly for poultry and swine. Pea starch is also used as a functional ingredient in pet food to improve digestibility and nutritional value. In the bakery industry, pea starch is used as a replacement for wheat-based starches in gluten-free and vegan-friendly products. It provides excellent binding and texturizing properties, making it an ideal ingredient for baked goods. Pea starch is also gaining popularity in the weight loss sector and among fitness enthusiasts. It is used as a dietary fiber source and as a low-calorie alternative to traditional starches.

Moreover, pea starch is also used in the production of gluten-free and non-GMO products, catering to the growing demand for healthier food options. Pea starch is produced through a process called ultrasonic extraction, which involves using high-frequency sound waves to separate the starch from the pea grains. Pea starch is a sustainable alternative to traditional starches derived from grains, pulses, legumes, and oilseeds. It is also a rich source of amylose, a type of starch that provides excellent thickening and gelling properties. In conclusion, pea starch is a versatile ingredient with numerous applications across various industries. Its unique properties and increasing demand for healthier and sustainable alternatives make it a valuable agricultural commodity. Pea starch is used in food and beverages, cosmetics, paper, textile, animal feed, bakery, and weight loss sectors. It is a non-GMO and organic ingredient that provides excellent texture, stability, and nutritional value to various products.

Market Segmentation

The market research report provides comprehensive data (region-wise segment analysis), with forecasts and estimates in "USD million" for the period 2024-2028, as well as historical data from 2018-2022 for the following segments.

  • Type
    • Conventional
    • Organic
  • Application
    • Food and beverage
    • Pharmaceutical and nutraceutical
    • Others
  • Geography
    • APAC
      • China
      • India
    • North America
      • US
    • Europe
      • Germany
      • France
    • South America
    • Middle East and Africa

By Type Insights

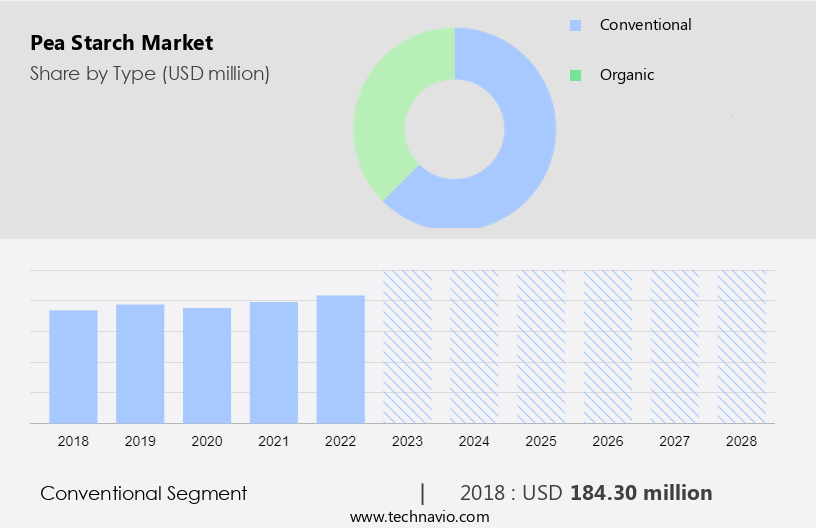
The conventional segment is estimated to witness significant growth during the forecast period. Pea starch is a versatile ingredient with significant applications in various industries, including food and beverages, cosmetics, paper, textile, animal feed, bakery, and gluten-free and vegan-friendly products. Among these segments, the food and beverage industry is expected to dominate the market in 2023 due to the growing demand for gluten-free and vegan-friendly options. The use of conventional pea starch is particularly prevalent in this industry because of its affordability, longer shelf life, and availability of a wide range of crop varieties. Conventional pea starch is also favored for its lower carbohydrate content compared to other common starches like rice, wheat, and cassava.

Furthermore, in the bakery industry, pea starch is employed as a functional ingredient to improve texture and shelf life in gluten-free baked goods. Overall, the market is poised for continued growth due to its numerous benefits and wide-ranging applications.

Pea Starch Market Size

Get a glance at the market share of various segments Request Free Sample

The conventional segment accounted for USD 184.30 million in 2018 and showed a gradual increase during the forecast period.

Regional Insights

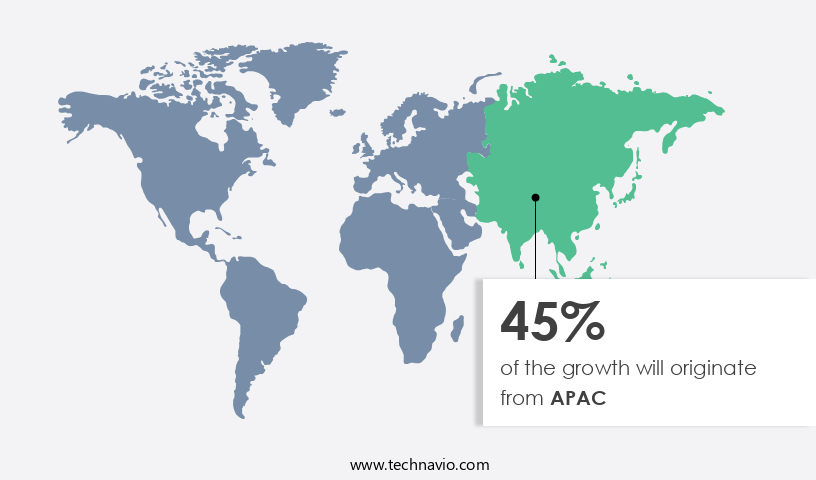
APAC is estimated to contribute 45% to the growth of the global market during the forecast period. Technavio's analysts have elaborately explained the regional trends and drivers that shape the market during the forecast period.

Pea Starch Market Share by Geography

For more insights on the market share of various regions Request Free Sample

Pea starch, derived from organic peas, is gaining popularity as a gelling agent in various food applications due to its ability to enhance food consistency. In the food processing industry, pea starch is increasingly used as a replacement for traditional gelling agents, particularly in the production of confectionery products and gluten-free foods. The market for pea starch is projected to expand significantly in the Asia Pacific region, driven by the growing demand from India and China. India, being an agriculture-based economy, offers a fertile ground for the pea starch industry. The Indian food processing sector is witnessing an increase in growth, with the government's support through initiatives such as the establishment of starch-based food parks.

In addition, these parks aim to benefit local companies by providing them with the necessary infrastructure to produce pea starch-based products on a larger scale. Furthermore, the increasing trend towards using organic and non-GMO ingredients in food production is expected to fuel the demand for pea starch in the region.

Our researchers analyzed the data with 2023 as the base year, along with the key drivers, trends, and challenges. A holistic analysis of drivers will help companies refine their marketing strategies to gain a competitive advantage.

Market Driver

The increasing prominence of private-label brands is the key driver of the market. Pea starch, a derivative of pea production, is gaining popularity among retailers worldwide due to its application in various sectors, particularly in the weight loss and fitness industry. This trend is driving the expansion of The market. Major retailers are capitalizing on this trend by introducing their private-label pea starch brands and pea starch-based products, such as snacks, to cater to the increasing consumer demand. The private-label product segment in the food and beverage industry has experienced significant growth in the last decade. For instance, Alibaba, a leading Chinese retailer, offers a range of pea starch options, including organic and conventional varieties, under its private label.

Moreover, pea starch is increasingly being used as a substitute for potato starch and tapioca starch in bakery ingredients, candy production, and other food applications. Its allergen-free nature makes it an attractive alternative for consumers with dietary restrictions. Ultrasonic extraction technology is used to produce pea starch, ensuring a high-quality and consistent product. The versatility of pea starch in various industries, including food and beverage, pharmaceuticals, and cosmetics, is contributing to its growing market demand. As consumers become more health-conscious and seek out allergen-free food options, the demand for pea starch is expected to continue to rise. In conclusion, The market is experiencing growth due to the increasing popularity of pea starch among consumers and retailers. Private-label pea starch brands and products are becoming a key focus area for retailers to capitalize on this trend and meet the growing demand for allergen-free, nutritious food options. The use of advanced production techniques, such as ultrasonic extraction, ensures a high-quality and consistent product, making pea starch an attractive option for various industries.

Market Trends

Increasing awareness about gluten-free products is the upcoming trend in the market. Pea starch, derived from legumes, has gained prominence as a popular alternative to traditional starches derived from grains such as wheat, barley, and rye. With the increasing awareness and diagnosis of celiac disease, a condition triggered by the consumption of gluten- proteins found in these grains- there has been a notable increase in demand for gluten-free food products. As pea starch is naturally gluten-free, it has become a go-to option for food manufacturers seeking clean-label alternatives. In the pet food industry, pea starch is also gaining traction due to its nutritional benefits. Peas are rich in protein and fiber, making them an excellent source of essential nutrients for pets.

Additionally, pea starch is used in the production of modified starches, which offer improved texture and stability in various food applications. The agricultural commodity market for pea starch is expected to grow significantly in the coming years, as consumers continue to demand healthier and more natural food options. As the demand for clean-label, gluten-free products continues to rise, the market for pea starch is poised for continued growth.

Market Challenge

Fluctuating prices of raw materials hampering the scale of modified starch production is a key challenge affecting market growth. Pea starch is a type of modified starch derived from peas, gaining popularity in various industries due to its health benefits and versatility. In the realm of preventive healthcare, pea starch serves as a valuable ingredient in food and beverage products, particularly in baked goods. The animal feed industry also utilizes pea starch as a plant-based alternative to traditional animal feed ingredients. Pea starch production relies heavily on the cost of native starch, which is the primary raw material. The price fluctuations of native starch can significantly impact the production and pricing of pea starch. These price changes are not solely dependent on availability but also on external factors such as weather conditions.

In addition, the uncertainty surrounding raw material costs can cause hesitation among companies in setting the prices for pea starch. Conversely, they may choose to raise the prices to secure a substantial profit margin. The market is subject to these price fluctuations, making it essential for stakeholders to stay informed about market trends and raw material costs.

Exclusive Customer Landscape

The market forecasting report includes the adoption lifecycle of the market, covering from the innovator's stage to the laggard's stage. It focuses on adoption rates in different regions based on penetration. Furthermore, the report also includes key purchase criteria and drivers of price sensitivity to help companies evaluate and develop their market growth analysis strategies.

Pea Starch Market Share by Geography

 Customer Landscape

Key Companies & Market Insights

Companies are implementing various strategies, such as strategic alliances, partnerships, mergers and acquisitions, geographical expansion, and product/service launches, to enhance their presence in the market.

A and B Ingredients Inc. - The company offers pea starch products for gluten-free baked products.

The market research and growth report includes detailed analyses of the competitive landscape of the market and information about key companies, including:

  • AGT Food and Ingredients Inc.
  • AM Nutrition
  • Archer Daniels Midland Co.
  • Axiom Foods Inc.
  • Benson Hill Inc.
  • COSUCRA
  • Emsland Starke GmbH
  • Herba Ingredients BV
  • Ingredion Inc.
  • Makendi Industrial Products Co. Ltd.
  • Meelunie BV
  • NutriPea LP
  • Parrish and Heimbecker Ltd.
  • Puris
  • Roquette Freres SA
  • Shandong Jianyuan group
  • The Scoular Co.
  • Vestkorn Milling AS
  • Yantai Shuangta Food Co. Ltd.

Qualitative and quantitative analysis of companies has been conducted to help clients understand the wider business environment as well as the strengths and weaknesses of key market players. Data is qualitatively analyzed to categorize companies as pure play, category-focused, industry-focused, and diversified; it is quantitatively analyzed to categorize companies as dominant, leading, strong, tentative, and weak.

Research Analyst Overview

Pea starch is a versatile ingredient derived from dried peas that finds extensive applications in various industries, including food and beverages, cosmetics, paper, textile, and animal feed. In the food and beverages sector, pea starch is used as a thickener, gelling agent, and stabilizer in various applications such as gluten-free products, vegan-friendly products, and non-GMO products. The bakery industry utilizes pea starch as a replacement for traditional starches like potato and tapioca in baked goods, contributing to the trend of premiumization and humanization in the sector. Pea starch is also used in the production of confectionery products, canned foods, convenience food products, and frozen potato and sweet potato products, offering sustainable farming practices and allergen-free food options.

Moreover, the pet food market is another significant consumer of pea starch, which is used as a source of protein, fiber, and starch. The cosmetics industry uses pea starch as a natural alternative to synthetic ingredients, contributing to the growing demand for clean-label alternatives. In the industrial application sector, pea starch is used as a gelling agent, providing food consistency and improving food processing efficiency. The weight loss sector and fitness enthusiasts also prefer pea starch due to its high protein and fiber content. The organic market is gaining traction due to the increasing demand for organic ingredients and non-GMO ingredients. The use of pea starch in the production of modified starches and veganism is also on the rise, with the vegan and flexitarian diet trends driving demand. The pet food industry also utilizes pea starch as a clean-label alternative to traditional animal feed ingredients.

Market Scope

Report Coverage

Details

Page number

154

Base year

2023

Historic period

2018-2022

Forecast period

2024-2028

Growth momentum & CAGR

Accelerate at a CAGR of 6.79%

Market growth 2024-2028

USD 109.7 million

Market structure

Fragmented

YoY growth 2023-2024(%)

6.23

Regional analysis

APAC, North America, Europe, South America, and Middle East and Africa

Performing market contribution

APAC at 45%

Key countries

US, China, Germany, India, and France

Competitive landscape

Leading Companies, Market Positioning of Companies, Competitive Strategies, and Industry Risks

Key companies profiled

A and B Ingredients Inc., AGT Food and Ingredients Inc., AM Nutrition, Archer Daniels Midland Co., Axiom Foods Inc., Benson Hill Inc., COSUCRA, Emsland Starke GmbH, Herba Ingredients BV, Ingredion Inc., Makendi Industrial Products Co. Ltd., Meelunie BV, NutriPea LP, Parrish and Heimbecker Ltd., Puris, Roquette Freres SA, Shandong Jianyuan group, The Scoular Co., Vestkorn Milling AS, and Yantai Shuangta Food Co. Ltd.

Market dynamics

Parent market analysis, market growth inducers and obstacles, market forecast, fast-growing and slow-growing segment analysis, COVID-19 impact and recovery analysis and future consumer dynamics, market condition analysis for the forecast period

Customization purview

If our market report has not included the data that you are looking for, you can reach out to our analysts and get segments customized.

Request Free Sample

What are the Key Data Covered in this Market Research and Growth Report?

  • CAGR of the market during the forecast period
  • Detailed information on factors that will drive the market growth and forecasting between 2024 and 2028
  • Precise estimation of the size of the market  and its contribution of the market in focus to the parent market
  • Accurate predictions about upcoming market growth and trends and changes in consumer behaviour
  • Growth of the market across APAC, North America, Europe, South America, and Middle East and Africa
  • Thorough analysis of the market's competitive landscape and detailed information about companies
  • Comprehensive analysis of factors that will challenge the growth of market companies

We can help! Our analysts can customize this market research report to meet your requirements. Get in touch

1 Executive Summary

  • 1.1 Market overview
    • Executive Summary - Chart on Market Overview
    • Executive Summary - Data Table on Market Overview
    • Executive Summary - Chart on Global Market Characteristics
    • Executive Summary - Chart on Market by Geography
    • Executive Summary - Chart on Market Segmentation by Type
    • Executive Summary - Chart on Market Segmentation by Application
    • Executive Summary - Chart on Incremental Growth
    • Executive Summary - Data Table on Incremental Growth
    • Executive Summary - Chart on Company Market Positioning

2 Market Landscape

  • 2.1 Market ecosystem
    • Parent Market
    • Data Table on - Parent Market
  • 2.2 Market characteristics
    • Market characteristics analysis
  • 2.3 Value chain analysis
    • Value Chain Analysis

3 Market Sizing

  • 3.1 Market definition
    • Offerings of companies included in the market definition
  • 3.2 Market segment analysis
    • Market segments
  • 3.3 Market size 2023
    • 3.4 Market outlook: Forecast for 2023-2028
      • Chart on Global - Market size and forecast 2023-2028 ($ million)
      • Data Table on Global - Market size and forecast 2023-2028 ($ million)
      • Chart on Global Market: Year-over-year growth 2023-2028 (%)
      • Data Table on Global Market: Year-over-year growth 2023-2028 (%)

    4 Historic Market Size

    • 4.1 Global Pea Starch Market 2018 - 2022
      • Historic Market Size - Data Table on Global Pea Starch Market 2018 - 2022 ($ million)
    • 4.2 Type segment analysis 2018 - 2022
      • Historic Market Size - Type Segment 2018 - 2022 ($ million)
    • 4.3 Application segment analysis 2018 - 2022
      • Historic Market Size - Application Segment 2018 - 2022 ($ million)
    • 4.4 Geography segment analysis 2018 - 2022
      • Historic Market Size - Geography Segment 2018 - 2022 ($ million)
    • 4.5 Country segment analysis 2018 - 2022
      • Historic Market Size - Country Segment 2018 - 2022 ($ million)

    5 Five Forces Analysis

    • 5.1 Five forces summary
      • Five forces analysis - Comparison between 2023 and 2028
    • 5.2 Bargaining power of buyers
      • Bargaining power of buyers - Impact of key factors 2023 and 2028
    • 5.3 Bargaining power of suppliers
      • Bargaining power of suppliers - Impact of key factors in 2023 and 2028
    • 5.4 Threat of new entrants
      • Threat of new entrants - Impact of key factors in 2023 and 2028
    • 5.5 Threat of substitutes
      • Threat of substitutes - Impact of key factors in 2023 and 2028
    • 5.6 Threat of rivalry
      • Threat of rivalry - Impact of key factors in 2023 and 2028
    • 5.7 Market condition
      • Chart on Market condition - Five forces 2023 and 2028

    6 Market Segmentation by Type

    • 6.1 Market segments
      • Chart on Type - Market share 2023-2028 (%)
      • Data Table on Type - Market share 2023-2028 (%)
    • 6.2 Comparison by Type
      • Chart on Comparison by Type
      • Data Table on Comparison by Type
    • 6.3 Conventional - Market size and forecast 2023-2028
      • Chart on Conventional - Market size and forecast 2023-2028 ($ million)
      • Data Table on Conventional - Market size and forecast 2023-2028 ($ million)
      • Chart on Conventional - Year-over-year growth 2023-2028 (%)
      • Data Table on Conventional - Year-over-year growth 2023-2028 (%)
    • 6.4 Organic - Market size and forecast 2023-2028
      • Chart on Organic - Market size and forecast 2023-2028 ($ million)
      • Data Table on Organic - Market size and forecast 2023-2028 ($ million)
      • Chart on Organic - Year-over-year growth 2023-2028 (%)
      • Data Table on Organic - Year-over-year growth 2023-2028 (%)
    • 6.5 Market opportunity by Type
      • Market opportunity by Type ($ million)
      • Data Table on Market opportunity by Type ($ million)

    7 Market Segmentation by Application

    • 7.1 Market segments
      • Chart on Application - Market share 2023-2028 (%)
      • Data Table on Application - Market share 2023-2028 (%)
    • 7.2 Comparison by Application
      • Chart on Comparison by Application
      • Data Table on Comparison by Application
    • 7.3 Food and beverage - Market size and forecast 2023-2028
      • Chart on Food and beverage - Market size and forecast 2023-2028 ($ million)
      • Data Table on Food and beverage - Market size and forecast 2023-2028 ($ million)
      • Chart on Food and beverage - Year-over-year growth 2023-2028 (%)
      • Data Table on Food and beverage - Year-over-year growth 2023-2028 (%)
    • 7.4 Pharmaceutical and nutraceutical - Market size and forecast 2023-2028
      • Chart on Pharmaceutical and nutraceutical - Market size and forecast 2023-2028 ($ million)
      • Data Table on Pharmaceutical and nutraceutical - Market size and forecast 2023-2028 ($ million)
      • Chart on Pharmaceutical and nutraceutical - Year-over-year growth 2023-2028 (%)
      • Data Table on Pharmaceutical and nutraceutical - Year-over-year growth 2023-2028 (%)
    • 7.5 Others - Market size and forecast 2023-2028
      • Chart on Others - Market size and forecast 2023-2028 ($ million)
      • Data Table on Others - Market size and forecast 2023-2028 ($ million)
      • Chart on Others - Year-over-year growth 2023-2028 (%)
      • Data Table on Others - Year-over-year growth 2023-2028 (%)
    • 7.6 Market opportunity by Application
      • Market opportunity by Application ($ million)
      • Data Table on Market opportunity by Application ($ million)

    8 Customer Landscape

    • 8.1 Customer landscape overview
      • Analysis of price sensitivity, lifecycle, customer purchase basket, adoption rates, and purchase criteria

    9 Geographic Landscape

    • 9.1 Geographic segmentation
      • Chart on Market share by geography 2023-2028 (%)
      • Data Table on Market share by geography 2023-2028 (%)
    • 9.2 Geographic comparison
      • Chart on Geographic comparison
      • Data Table on Geographic comparison
    • 9.3 APAC - Market size and forecast 2023-2028
      • Chart on APAC - Market size and forecast 2023-2028 ($ million)
      • Data Table on APAC - Market size and forecast 2023-2028 ($ million)
      • Chart on APAC - Year-over-year growth 2023-2028 (%)
      • Data Table on APAC - Year-over-year growth 2023-2028 (%)
    • 9.4 North America - Market size and forecast 2023-2028
      • Chart on North America - Market size and forecast 2023-2028 ($ million)
      • Data Table on North America - Market size and forecast 2023-2028 ($ million)
      • Chart on North America - Year-over-year growth 2023-2028 (%)
      • Data Table on North America - Year-over-year growth 2023-2028 (%)
    • 9.5 Europe - Market size and forecast 2023-2028
      • Chart on Europe - Market size and forecast 2023-2028 ($ million)
      • Data Table on Europe - Market size and forecast 2023-2028 ($ million)
      • Chart on Europe - Year-over-year growth 2023-2028 (%)
      • Data Table on Europe - Year-over-year growth 2023-2028 (%)
    • 9.6 South America - Market size and forecast 2023-2028
      • Chart on South America - Market size and forecast 2023-2028 ($ million)
      • Data Table on South America - Market size and forecast 2023-2028 ($ million)
      • Chart on South America - Year-over-year growth 2023-2028 (%)
      • Data Table on South America - Year-over-year growth 2023-2028 (%)
    • 9.7 Middle East and Africa - Market size and forecast 2023-2028
      • Chart on Middle East and Africa - Market size and forecast 2023-2028 ($ million)
      • Data Table on Middle East and Africa - Market size and forecast 2023-2028 ($ million)
      • Chart on Middle East and Africa - Year-over-year growth 2023-2028 (%)
      • Data Table on Middle East and Africa - Year-over-year growth 2023-2028 (%)
    • 9.8 US - Market size and forecast 2023-2028
      • Chart on US - Market size and forecast 2023-2028 ($ million)
      • Data Table on US - Market size and forecast 2023-2028 ($ million)
      • Chart on US - Year-over-year growth 2023-2028 (%)
      • Data Table on US - Year-over-year growth 2023-2028 (%)
    • 9.9 China - Market size and forecast 2023-2028
      • Chart on China - Market size and forecast 2023-2028 ($ million)
      • Data Table on China - Market size and forecast 2023-2028 ($ million)
      • Chart on China - Year-over-year growth 2023-2028 (%)
      • Data Table on China - Year-over-year growth 2023-2028 (%)
    • 9.10 Germany - Market size and forecast 2023-2028
      • Chart on Germany - Market size and forecast 2023-2028 ($ million)
      • Data Table on Germany - Market size and forecast 2023-2028 ($ million)
      • Chart on Germany - Year-over-year growth 2023-2028 (%)
      • Data Table on Germany - Year-over-year growth 2023-2028 (%)
    • 9.11 India - Market size and forecast 2023-2028
      • Chart on India - Market size and forecast 2023-2028 ($ million)
      • Data Table on India - Market size and forecast 2023-2028 ($ million)
      • Chart on India - Year-over-year growth 2023-2028 (%)
      • Data Table on India - Year-over-year growth 2023-2028 (%)
    • 9.12 France - Market size and forecast 2023-2028
      • Chart on France - Market size and forecast 2023-2028 ($ million)
      • Data Table on France - Market size and forecast 2023-2028 ($ million)
      • Chart on France - Year-over-year growth 2023-2028 (%)
      • Data Table on France - Year-over-year growth 2023-2028 (%)
    • 9.13 Market opportunity by geography
      • Market opportunity by geography ($ million)
      • Data Tables on Market opportunity by geography ($ million)

    10 Drivers, Challenges, and Opportunity/Restraints

    • 10.1 Market drivers
      • 10.2 Market challenges
        • 10.3 Impact of drivers and challenges
          • Impact of drivers and challenges in 2023 and 2028
        • 10.4 Market opportunities/restraints

          11 Competitive Landscape

          • 11.1 Overview
            • 11.2 Competitive Landscape
              • Overview on criticality of inputs and factors of differentiation
            • 11.3 Landscape disruption
              • Overview on factors of disruption
            • 11.4 Industry risks
              • Impact of key risks on business

            12 Competitive Analysis

            • 12.1 Companies profiled
              • Companies covered
            • 12.2 Market positioning of companies
              • Matrix on companies position and classification
            • 12.3 A and B Ingredients Inc.
              • A and B Ingredients Inc. - Overview
              • A and B Ingredients Inc. - Product / Service
              • A and B Ingredients Inc. - Key offerings
            • 12.4 AGT Food and Ingredients Inc.
              • AGT Food and Ingredients Inc. - Overview
              • AGT Food and Ingredients Inc. - Product / Service
              • AGT Food and Ingredients Inc. - Key offerings
            • 12.5 AM Nutrition
              • AM Nutrition - Overview
              • AM Nutrition - Product / Service
              • AM Nutrition - Key offerings
            • 12.6 Archer Daniels Midland Co.
              • Archer Daniels Midland Co. - Overview
              • Archer Daniels Midland Co. - Business segments
              • Archer Daniels Midland Co. - Key news
              • Archer Daniels Midland Co. - Key offerings
              • Archer Daniels Midland Co. - Segment focus
            • 12.7 Benson Hill Inc.
              • Benson Hill Inc. - Overview
              • Benson Hill Inc. - Product / Service
              • Benson Hill Inc. - Key offerings
            • 12.8 COSUCRA
              • COSUCRA - Overview
              • COSUCRA - Product / Service
              • COSUCRA - Key offerings
            • 12.9 Herba Ingredients BV
              • Herba Ingredients BV - Overview
              • Herba Ingredients BV - Product / Service
              • Herba Ingredients BV - Key offerings
            • 12.10 Ingredion Inc.
              • Ingredion Inc. - Overview
              • Ingredion Inc. - Business segments
              • Ingredion Inc. - Key news
              • Ingredion Inc. - Key offerings
              • Ingredion Inc. - Segment focus
            • 12.11 Makendi Industrial Products Co. Ltd.
              • Makendi Industrial Products Co. Ltd. - Overview
              • Makendi Industrial Products Co. Ltd. - Product / Service
              • Makendi Industrial Products Co. Ltd. - Key offerings
            • 12.12 Meelunie BV
              • Meelunie BV - Overview
              • Meelunie BV - Product / Service
              • Meelunie BV - Key offerings
            • 12.13 Puris
              • Puris - Overview
              • Puris - Product / Service
              • Puris - Key offerings
            • 12.14 Roquette Freres SA
              • Roquette Freres SA - Overview
              • Roquette Freres SA - Product / Service
              • Roquette Freres SA - Key offerings
            • 12.15 The Scoular Co.
              • The Scoular Co. - Overview
              • The Scoular Co. - Product / Service
              • The Scoular Co. - Key offerings
            • 12.16 Vestkorn Milling AS
              • Vestkorn Milling AS - Overview
              • Vestkorn Milling AS - Product / Service
              • Vestkorn Milling AS - Key offerings
            • 12.17 Yantai Shuangta Food Co. Ltd.
              • Yantai Shuangta Food Co. Ltd. - Overview
              • Yantai Shuangta Food Co. Ltd. - Product / Service
              • Yantai Shuangta Food Co. Ltd. - Key offerings

            13 Appendix

            • 13.1 Scope of the report
              • 13.2 Inclusions and exclusions checklist
                • Inclusions checklist
                • Exclusions checklist
              • 13.3 Currency conversion rates for US$
                • Currency conversion rates for US$
              • 13.4 Research methodology
                • Research methodology
              • 13.5 Data procurement
                • Information sources
              • 13.6 Data validation
                • Data validation
              • 13.7 Validation techniques employed for market sizing
                • Validation techniques employed for market sizing
              • 13.8 Data synthesis
                • Data synthesis
              • 13.9 360 degree market analysis
                • 360 degree market analysis
              • 13.10 List of abbreviations
                • List of abbreviations

              Research Methodology

              Technavio presents a detailed picture of the market by way of study, synthesis, and summation of data from multiple sources. The analysts have presented the various facets of the market with a particular focus on identifying the key industry influencers. The data thus presented is comprehensive, reliable, and the result of extensive research, both primary and secondary.

              INFORMATION SOURCES

              Primary sources

              • Manufacturers and suppliers
              • Channel partners
              • Industry experts
              • Strategic decision makers

              Secondary sources

              • Industry journals and periodicals
              • Government data
              • Financial reports of key industry players
              • Historical data
              • Press releases

              DATA ANALYSIS

              Data Synthesis

              • Collation of data
              • Estimation of key figures
              • Analysis of derived insights

              Data Validation

              • Triangulation with data models
              • Reference against proprietary databases
              • Corroboration with industry experts

              REPORT WRITING

              Qualitative

              • Market drivers
              • Market challenges
              • Market trends
              • Five forces analysis

              Quantitative

              • Market size and forecast
              • Market segmentation
              • Geographical insights
              • Competitive landscape

              Interested in this report?

              Get your sample now to see our research methodology and insights!

              Download Now

              Frequently Asked Questions

              Pea Starch market growth will increase by $ 109.7 mn during 2024-2028.

              The Pea Starch market is expected to grow at a CAGR of 6.79% during 2024-2028.

              Pea Starch market is segmented by Type( Conventional, Organic) Application( Food and beverage, Pharmaceutical and nutraceutical, Others)

              A and B Ingredients Inc., AGT Food and Ingredients Inc., AM Nutrition, Archer Daniels Midland Co., Axiom Foods Inc., Benson Hill Inc., COSUCRA, Emsland Starke GmbH, Herba Ingredients BV, Ingredion Inc., Makendi Industrial Products Co. Ltd., Meelunie BV, NutriPea LP, Parrish and Heimbecker Ltd., Puris, Roquette Freres SA, Shandong Jianyuan group, The Scoular Co., Vestkorn Milling AS, Yantai Shuangta Food Co. Ltd. are a few of the key vendors in the Pea Starch market.

              APAC will register the highest growth rate of 45% among the other regions. Therefore, the Pea Starch market in APAC is expected to garner significant business opportunities for the vendors during the forecast period.

              US, China, Germany, India, France

              • Increasing prominence of private-label brandsPrivate-label pea starch products are becoming a key focus area for retailers globally. Various retailers are selling different types of pea starch under their private-label brands to increase their profitability is the driving factor this market.
              • which is contributing to the growth of the global pea starch market. Globally is the driving factor this market.
              • major retailers are introducing their pea starch brands and pea starch-based snacks and thus capitalizing on the growing demand for pea starch among consumers. In the last decade is the driving factor this market.
              • the private-label product segment in the food and beverage industry has grown in terms of scope and size. For instance is the driving factor this market.
              • China-based Alibaba sells a variety of pea starch is the driving factor this market.
              • such as organic and conventional pea starch is the driving factor this market.
              • under its own brand.Private-label products are priced lower than branded products. Hence is the driving factor this market.
              • price-sensitive consumers are likely to purchase such products. Supermarket chains have started allocating more shelf space to their private-label offerings and various in-house marketing and promotional activities. The demand for private-label brands is expected to increase during the forecast period is the driving factor this market.
              • which is the driving factor this market.
              • in turn is the driving factor this market.
              • will drive the growth of the global pea starch market during the forecast period. is the driving factor this market.

              The Pea Starch market vendors should focus on grabbing business opportunities from the Conventional segment as it accounted for the largest market share in the base year.