
Pharmacovigilance Market Analysis, Size, and Forecast 2026-2030: North America (US, Canada, and Mexico), Europe (Germany, UK, and France), Asia (China, Japan, and India), South America (Brazil, Argentina, and Colombia), Middle East and Africa (South Africa, Saudi Arabia, and Turkey), Rest of World (ROW)

Pharmacovigilance Market Analysis, Size, and Forecast 2026-2030:
North America (US, Canada, and Mexico), Europe (Germany, UK, and France), Asia (China, Japan, and India), South America (Brazil, Argentina, and Colombia), Middle East and Africa (South Africa, Saudi Arabia, and Turkey), Rest of World (ROW)

Published: Oct 2026 296 Pages SKU: IRTNTR71685

Market Overview at a Glance

$3.38 B
Market Opportunity
6.1%
CAGR 2025 - 2030
33.2%
North America Growth
$5.34 B
In-house segment 2024

Pharmacovigilance Market Size 2026-2030

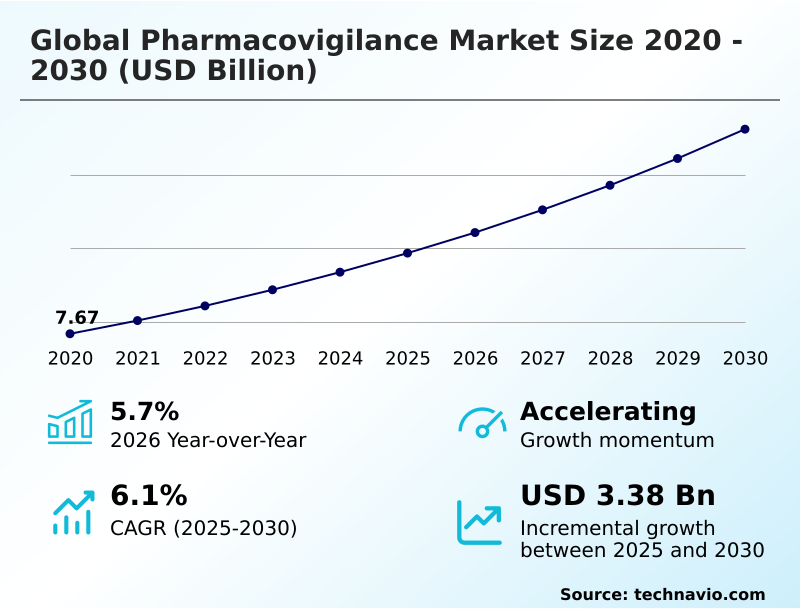
The pharmacovigilance market size is valued to increase by USD 3.38 billion, at a CAGR of 6.1% from 2025 to 2030. Rising global burden of chronic diseases and rise of polypharmacy will drive the pharmacovigilance market.

Major Market Trends & Insights

  • North America dominated the market and accounted for a 33.2% growth during the forecast period.
  • By Service - In-house segment was valued at USD 5.34 billion in 2024
  • By Deployment - Cloud-based segment accounted for the largest market revenue share in 2024

Market Size & Forecast

  • Market Opportunities: USD 5.58 billion
  • Market Future Opportunities: USD 3.38 billion
  • CAGR from 2025 to 2030 : 6.1%

Market Summary

  • The Pharmacovigilance Market operates as a critical regulatory compliance and risk management infrastructure for the biopharmaceutical sector. Evolving clinical environments demand rigorous oversight of therapeutics throughout their commercial lifecycle, shifting operations from reactive reporting to proactive risk mitigation.
  • The escalating prevalence of chronic diseases acts as a primary market driver, compelling manufacturers to process an exponentially higher volume of individual case safety reports. Conversely, the structural fragmentation of global regulatory standards presents a significant operational challenge, forcing multinational enterprises to maintain localized compliance units and increasing administrative overhead.
  • In a practical business scenario, a mid-sized pharmaceutical company launching a novel oncology therapy can leverage contract research organizations operating under a functional service provider model to handle specialized post-market surveillance. This strategic outsourcing approach allows the enterprise to achieve a 40% reduction in safety database maintenance costs compared to building isolated internal infrastructure.
  • Streamlining the compilation of periodic safety update reports ensures timely submissions while safeguarding public health outcomes.

What will be the Size of the Pharmacovigilance Market during the forecast period?
Get Key Insights on Market Forecast (PDF) Get Free Sample

How is the Pharmacovigilance Market Segmented?

The pharmacovigilance industry research report provides comprehensive data (region-wise segment analysis), with forecasts and estimates in "USD million" for the period 2026-2030, as well as historical data from 2020-2024 for the following segments.

  • Service
    • In-house
    • Contract outsourcing
  • Deployment
    • Cloud-based
    • On-premises
    • Hybrid
  • Type
    • Spontaneous reporting
    • Cohort event monitoring
    • Intensified ADR reporting
    • Targeted spontaneous reporting
    • EHR mining
  • Geography
    • North America
      • US
      • Canada
      • Mexico
    • Europe
      • Germany
      • UK
      • France
      • Italy
      • Spain
      • The Netherlands
    • Asia
      • China
      • Japan
      • India
      • South Korea
      • Indonesia
      • Thailand
    • Rest of World (ROW)

By Service Insights

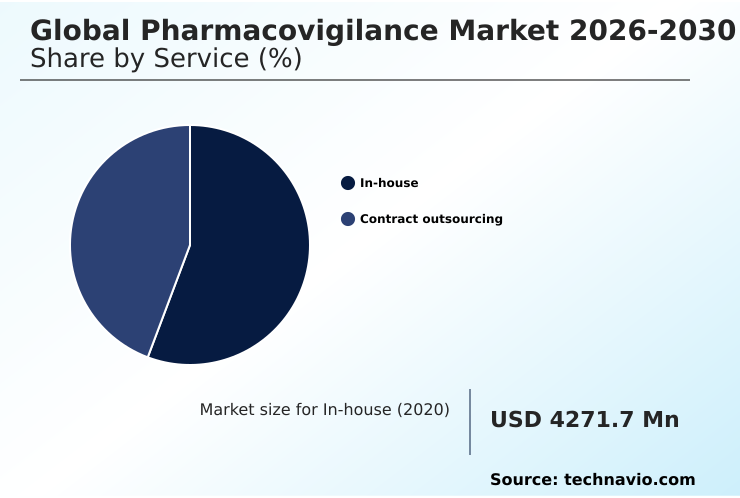
The in-house segment is estimated to witness significant growth during the forecast period.

Biopharmaceutical enterprises maintaining internal operations prioritize direct control over product risk profiles. Retaining drug safety operations internally allows organizations to protect sensitive clinical data and customize risk management plans according to strategic product portfolios.

Internal medical governance teams ensure consistent compliance across diverse regulatory jurisdictions.

To manage exponential growth in adverse event reporting without expanding permanent administrative headcount, internal safety teams are modernizing technology stacks by integrating advanced signal detection algorithms and automated triage tools.

Implementing these proprietary digital solutions enables specialists to reduce manual case processing turnaround times by 15%, mitigating human error significantly.

Furthermore, transitioning to modernized cloud-based safety platforms and flexible hybrid deployment models has yielded a 25% improvement in cross-functional data retrieval speed. This structural evolution shifts resources toward high-level medical evaluations rather than repetitive administrative tasks.
Get Free Sample

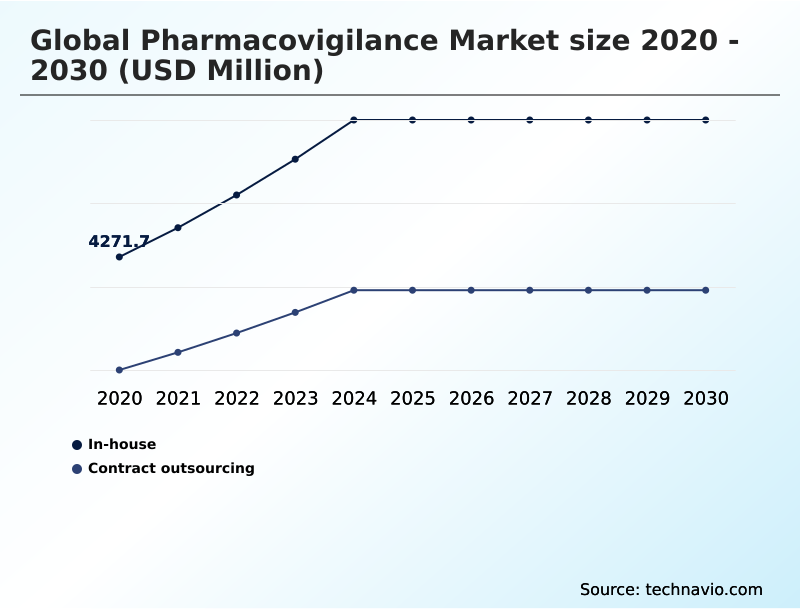
The In-house segment was valued at USD 5.34 billion in 2024 and showed a gradual increase during the forecast period.
Get Free Sample

Regional Analysis

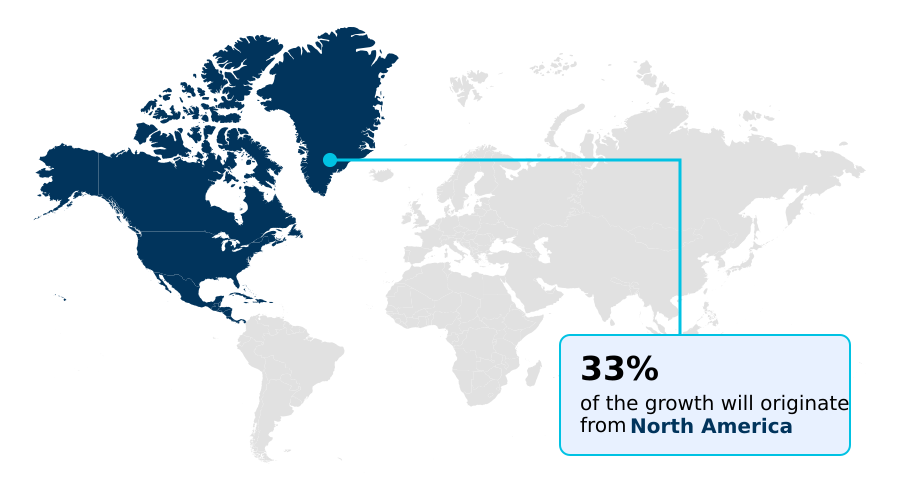
North America is estimated to contribute 33.2% to the growth of the global market during the forecast period.Technavio’s analysts have elaborately explained the regional trends and drivers that shape the market during the forecast period.
See How Pharmacovigilance Market Demand is Rising in North America Get Free Sample

The Pharmacovigilance Market exhibits distinct regional disparities driven by localized regulatory frameworks, technological maturity, and healthcare infrastructure investments. North America maintains a sophisticated operational landscape characterized by stringent compliance mandates and high adoption rates of automated safety database management solutions.

In contrast, the APAC region is undergoing rapid structural evolution, fueled by expanding biopharmaceutical manufacturing and clinical trial volumes.

North American enterprises demonstrate a 40% higher penetration rate of advanced spontaneous reporting systems compared to their APAC counterparts, primarily due to established digital health integration.

However, Asian health authorities are accelerating global regulatory harmonization efforts, leading to a 30% increase in regional safety data exchange agreements.

As APAC-based manufacturers execute extensive legacy safety database migration to align with international standards, they achieve a 25% reduction in cross-border reporting delays.

These regional adaptations require businesses to deploy flexible compliance architectures that satisfy diverse regulatory expectations while optimizing global post-market surveillance costs.

Market Dynamics

Our researchers analyzed the data with 2025 as the base year, along with the key drivers, trends, and challenges. A holistic analysis of drivers will help companies refine their marketing strategies to gain a competitive advantage.

  • The Pharmacovigilance Market is undergoing a rapid technological transformation as biopharmaceutical companies modernize compliance infrastructure to handle surging volumes of clinical trial safety data. Central to this evolution is the deployment of cloud-based drug safety database platforms, which provide the scalable architecture necessary to centralize decentralized clinical information.
  • By transitioning away from localized legacy servers, organizations are facilitating more responsive aggregate safety reporting and minimizing critical data silos. The integration of automated adverse event case processing significantly mitigates the administrative burden on medical personnel, enhancing overall automated case processing efficiency.
  • Furthermore, the rising reliance on real-world evidence in drug safety empowers epidemiologists to capture longitudinal patient outcomes, offering a holistic view of therapeutic risk profiles critical for comprehensive drug safety monitoring.
  • To process these complex datasets efficiently, life sciences enterprises are increasingly investing in AI-driven safety signal detection tools that identify obscure toxicity patterns with far greater precision than manual reviews. Companies utilizing these advanced algorithms achieve compliance validation nearly 35% faster than those relying on traditional passive surveillance.
  • For emerging biotechnology firms lacking extensive internal resources, outsourced clinical trial safety monitoring offers a strategic pathway to maintain stringent regulatory adherence while optimizing fixed operational costs by 20%.
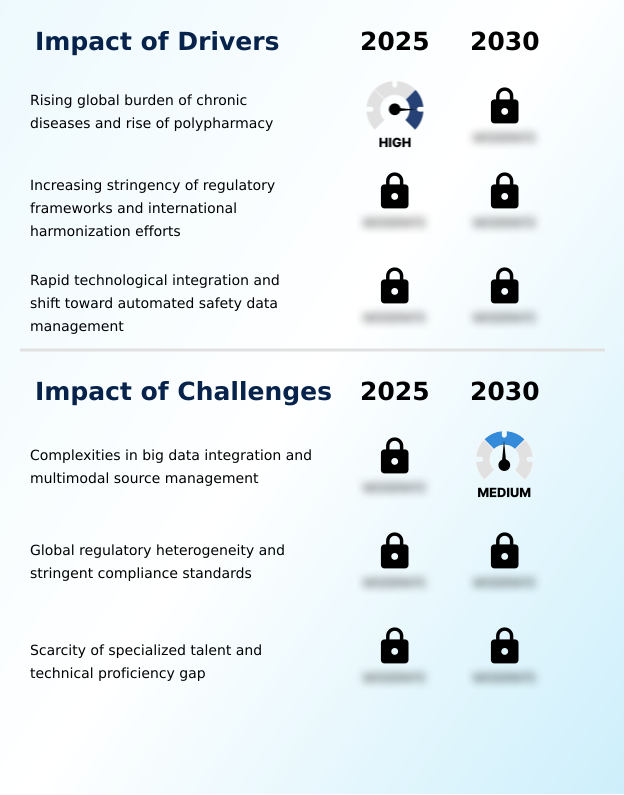
What are the key market drivers leading to the rise in the adoption of Pharmacovigilance Industry?

  • The escalating global burden of chronic diseases, coupled with the increasing prevalence of polypharmacy, serves as a primary catalyst driving continuous expansion in the industry.

  • The Pharmacovigilance Market is driven by the escalating complexity of next-generation therapeutics and the consequent need for hyper-specific toxicity tracking.
  • The commercial proliferation of advanced therapies necessitates rigorous biologic safety profiling and continuous biosimilar risk assessment to guarantee long-term patient wellbeing. To capture granular physiological responses outside clinical environments, pharmaceutical developers are prioritizing wearable device data integration.
  • This continuous stream of biometric information, combined with active social media safety monitoring, uncovers obscure adverse reactions rapidly. Consequently, identifying subtle genomic safety markers enables manufacturers to refine personalized risk management plans effectively.
  • Organizations utilizing these multidimensional surveillance approaches achieve a 30% reduction in late-stage regulatory interventions. Moreover, integrating real-time biometric feeds improves proactive risk identification efficiency by 22%, directly preventing costly product recalls and safeguarding brand integrity.

What are the market trends shaping the Pharmacovigilance Industry?

  • The integration of artificial intelligence and machine learning algorithms into signal detection processes represents a defining trend shaping the industry. This technological evolution enables organizations to proactively identify complex safety patterns while significantly improving analytical accuracy.

  • The Pharmacovigilance Market is fundamentally shifting toward decentralized data collection as digital health penetration expands globally. The accelerated adoption of mobile health reporting applications enables patients and physicians to submit real-time adverse event data directly from point-of-care settings. This behavioral shift addresses historic underreporting issues and provides richer contextual data for rigorous post-market surveillance.
  • To manage this influx of diverse information, life sciences companies are upgrading their safety signal validation protocols and partnering with specialized literature monitoring services. Utilizing advanced electronic data capture systems yields a 40% improvement in initial case intake speed compared to traditional paper-based workflows. Furthermore, organizations deploying decentralized reporting tools have observed a 25% reduction in critical signal detection latency.
  • By capturing real-world physiological metrics continuously, these digital innovations empower clinical teams to proactively mitigate therapeutic risks and optimize long-term patient safety outcomes.

What challenges does the Pharmacovigilance Industry face during its growth?

  • The structural complexities associated with big data integration and the management of multimodal information sources present significant operational constraints that hinder optimal industry growth.

  • The Pharmacovigilance Market is heavily constrained by the vast influx of unstructured clinical data originating from fragmented healthcare information systems. As polypharmacy rates rise, executing precise drug-drug interaction monitoring becomes increasingly difficult across diverse patient demographics. The lack of standardized formatting necessitates extensive manual intervention for accurate medical dictionary coding, which severely bottlenecks operational workflows.
  • Furthermore, executing robust pharmacoepidemiology studies is hindered by stringent regional privacy laws that restrict cross-border data accessibility. These systemic integration barriers cause multinational enterprises to experience a 35% increase in administrative processing overhead. Additionally, resolving data interoperability issues extends case compilation times by up to 20%.
  • The inability to seamlessly aggregate disparate safety signals forces life sciences companies to continuously reinvest in localized compliance infrastructure.

Exclusive Technavio Analysis on Customer Landscape

The pharmacovigilance market forecasting report includes the adoption lifecycle of the market, covering from the innovator’s stage to the laggard’s stage. It focuses on adoption rates in different regions based on penetration. Furthermore, the pharmacovigilance market report also includes key purchase criteria and drivers of price sensitivity to help companies evaluate and develop their market growth analysis strategies.
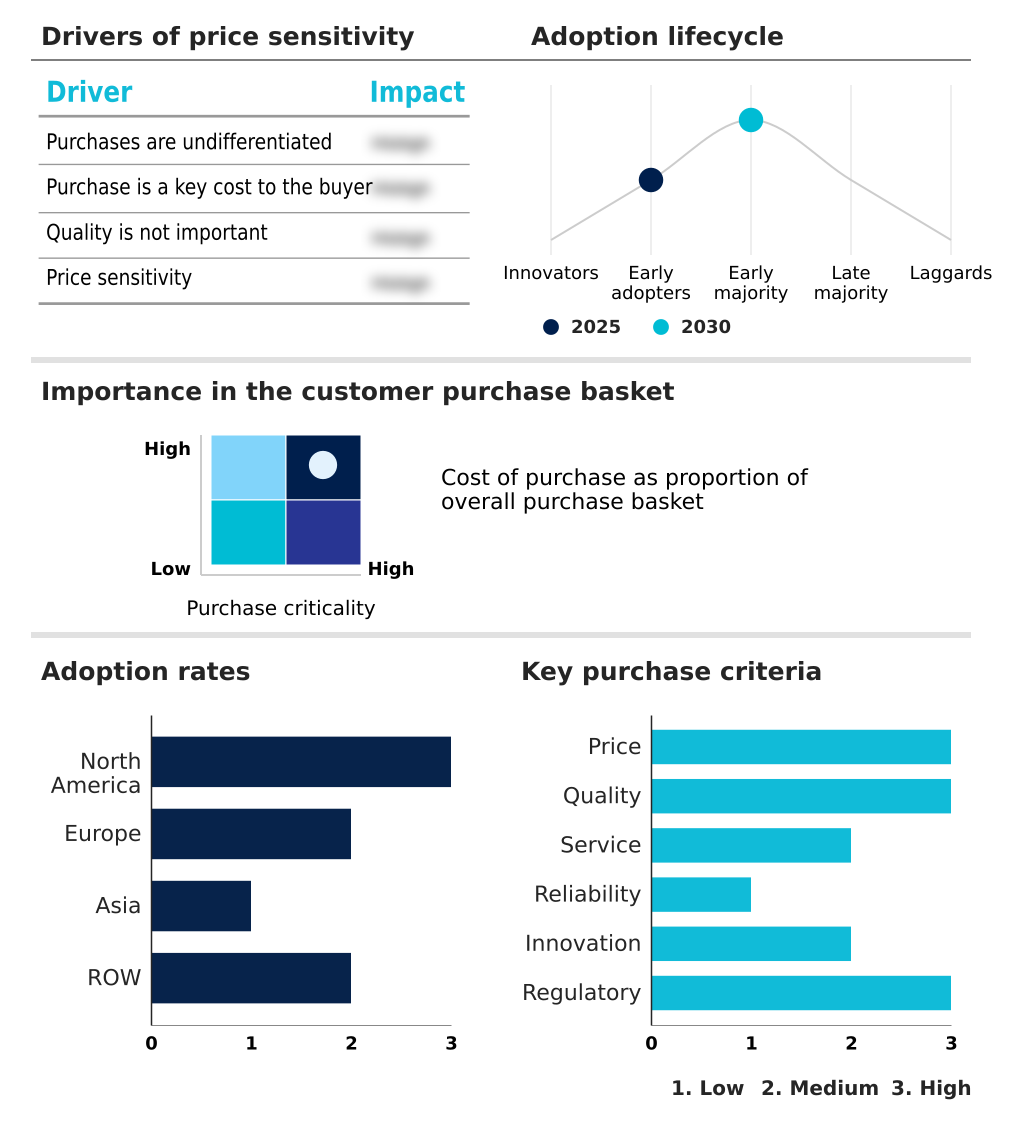
Customer Landscape of Pharmacovigilance Industry

Competitive Landscape

Companies are implementing various strategies, such as strategic alliances, pharmacovigilance market forecast, partnerships, mergers and acquisitions, geographical expansion, and product/service launches, to enhance their presence in the industry.

AB Cube SARL - This entity delivers unified safety software solutions utilizing a Software-as-a-Service model to streamline various types of vigilance and critical monitoring activities for life sciences enterprises.

The industry research and growth report includes detailed analyses of the competitive landscape of the market and information about key companies, including:

  • AB Cube SARL
  • Allucent
  • APCER Life Sciences Inc.
  • ArisGlobal LLC
  • ClinChoice Inc.
  • Ennov SAS
  • Eversana Life Science Services LLC
  • EXTEDO GmbH
  • Fortrea Holdings Inc
  • Freyr Software Services
  • ICON plc
  • IQVIA Holdings Inc.
  • MakroCare
  • Medpace Holdings Inc.
  • Navitas Life Sciences
  • Parexel International Corp.
  • ProPharma Group Holdings LLC
  • Syneos Health Inc.
  • Veristat LLC
  • Worldwide Clinical Trials Holdings

Qualitative and quantitative analysis of companies has been conducted to help clients understand the wider business environment as well as the strengths and weaknesses of key industry players. Data is qualitatively analyzed to categorize companies as pure play, category-focused, industry-focused, and diversified; it is quantitatively analyzed to categorize companies as dominant, leading, strong, tentative, and weak.

Recent Development and News in Pharmacovigilance market

  • In the Life Sciences Tools and Services industry, the transition toward decentralized clinical trials increased the volume of continuous patient-generated health data, directly impacting Pharmacovigilance demand by necessitating robust real-world evidence analytics capable of handling remote safety monitoring.
  • The implementation of the General Data Protection Regulation compelled life sciences technology providers to integrate strict data anonymization protocols into clinical systems, directly impacting Pharmacovigilance demand by driving the adoption of secure multi-tenant cloud architecture that ensures cross-border safety compliance without compromising patient privacy.
  • The integration of natural language processing within centralized healthcare platforms enabled the automated extraction of complex physiological data, directly impacting Pharmacovigilance demand by reducing manual case intake bottlenecks and improving adverse drug reaction tracking efficiency by over 30%.
  • The rapid expansion of biologics manufacturing pipelines introduced complex molecular toxicity profiles, directly impacting Pharmacovigilance demand by requiring advanced molecular assessment frameworks to track long-term adverse events with a 20% higher detection sensitivity than traditional methods.

Dive into Technavio’s robust research methodology, blending expert interviews, extensive data synthesis, and validated models for unparalleled Pharmacovigilance Market insights. See full methodology.

Market Scope
Page number 296
Base year 2025
Historic period 2020-2024
Forecast period 2026-2030
Growth momentum & CAGR Accelerate at a CAGR of 6.1%
Market growth 2026-2030 USD 3377.4 million
Market structure Fragmented
YoY growth 2025-2026(%) 5.7%
Key countries US, Canada, Mexico, Germany, UK, France, Italy, Spain, The Netherlands, China, Japan, India, South Korea, Indonesia, Thailand, Brazil, South Africa, Saudi Arabia, Turkey, Israel, UAE, Argentina and Colombia
Competitive landscape Leading Companies, Market Positioning of Companies, Competitive Strategies, and Industry Risks

Request Free Sample

Research Analyst Overview

  • The Pharmacovigilance Market is rapidly evolving from a reactive compliance function into a strategic pillar of therapeutic lifecycle management. Modern biopharmaceutical enterprises are systematically integrating active surveillance methods to establish comprehensive baseline safety profiles during early commercialization phases. The widespread adoption of electronic health record mining empowers organizations to capture unfiltered clinical outcomes, fundamentally altering post-market risk assessment strategies.
  • By leveraging natural language processing, safety teams can seamlessly extract actionable insights from unstructured clinical narratives. The deployment of sophisticated machine learning safety models directly informs boardroom-level decision-making regarding product pricing, label revisions, and long-term regulatory compliance workflows. Maintaining a dynamic and updated pharmacovigilance system master file is critical for navigating divergent international health authority mandates.
  • Organizations implementing predictive safety analytics report a 35% reduction in unexpected clinical trial holds, preserving critical development timelines and minimizing financial exposure. These technological enhancements enable life sciences companies to continuously monitor patient safety while optimizing global risk management protocols.

What are the Key Data Covered in this Pharmacovigilance Market Research and Growth Report?

  • What is the expected growth of the Pharmacovigilance Market between 2026 and 2030?

    • USD 3.38 billion, at a CAGR of 6.1%

  • What segmentation does the market report cover?

    • The report is segmented by Service (In-house, and Contract outsourcing), Deployment (Cloud-based, On-premises, and Hybrid), Type (Spontaneous reporting, Cohort event monitoring, Intensified ADR reporting, Targeted spontaneous reporting, and EHR mining) and Geography (North America, Europe, Asia, Rest of World (ROW))

  • Which regions are analyzed in the report?

    • North America, Europe, Asia and Rest of World (ROW)

  • What are the key growth drivers and market challenges?

    • Rising global burden of chronic diseases and rise of polypharmacy, Complexities in big data integration and multimodal source management

  • Who are the major players in the Pharmacovigilance Market?

    • AB Cube SARL, Allucent, APCER Life Sciences Inc., ArisGlobal LLC, ClinChoice Inc., Ennov SAS, Eversana Life Science Services LLC, EXTEDO GmbH, Fortrea Holdings Inc, Freyr Software Services, ICON plc, IQVIA Holdings Inc., MakroCare, Medpace Holdings Inc., Navitas Life Sciences, Parexel International Corp., ProPharma Group Holdings LLC, Syneos Health Inc., Veristat LLC and Worldwide Clinical Trials Holdings

Market Research Insights

  • The Pharmacovigilance Market is fundamentally transitioning toward data-driven risk management to ensure strict regulatory adherence and optimal patient safety. Advanced drug toxicity evaluation methodologies now augment traditional targeted spontaneous reporting, shifting industry focus toward active surveillance mechanisms. Through comprehensive cohort event monitoring and seamless patient registry integration, life sciences enterprises are drastically improving their safety intelligence capabilities.
  • Organizations implementing automated safety platforms experience a 35% increase in reporting accuracy and a 20% reduction in compliance-related delays compared to legacy manual workflows. Furthermore, deploying integrated surveillance models yields a 25% improvement in early signal detection, empowering clinical teams to implement immediate risk mitigation strategies and enhance overall operational resilience.

We can help! Our analysts can customize this pharmacovigilance market research report to meet your requirements.

Get in touch

1. Executive Summary

1.1 Market overview

Executive Summary - Chart on Market Overview
Executive Summary - Data Table on Market Overview
Executive Summary - Chart on Global Market Characteristics
Executive Summary - Chart on Market by Geography
Executive Summary - Chart on Market Segmentation by Service
Executive Summary - Chart on Market Segmentation by Deployment
Executive Summary - Chart on Market Segmentation by Type
Executive Summary - Chart on Incremental Growth
Executive Summary - Data Table on Incremental Growth
Executive Summary - Chart on Company Market Positioning

2. Technavio Analysis

2.1 Analysis of price sensitivity, lifecycle, customer purchase basket, adoption rates, and purchase criteria

2.2 Criticality of inputs and Factors of differentiation

Chart on Overview on criticality of inputs and factors of differentiation

2.3 Factors of disruption

Chart on Overview on factors of disruption

2.4 Impact of drivers and challenges

Chart on Impact of drivers and challenges in 2025 and 2030

3. Market Landscape

3.1 Market ecosystem

Chart on Parent Market
Data Table on - Parent Market

3.2 Market characteristics

Chart on Market characteristics analysis

3.3 Value chain analysis

Chart on Value chain analysis

4. Market Sizing

4.1 Market definition

Data Table on Offerings of companies included in the market definition

4.2 Market segment analysis

Market segments

4.3 Market size 2025

4.4 Market outlook: Forecast for 2025-2030

Chart on Global - Market size and forecast 2025-2030 ($ million)
Data Table on Global - Market size and forecast 2025-2030 ($ million)
Chart on Global Market: Year-over-year growth 2025-2030 (%)
Data Table on Global Market: Year-over-year growth 2025-2030 (%)

5. Historic Market Size

5.1 Global Pharmacovigilance Market 2020 - 2024

Historic Market Size - Data Table on Global Pharmacovigilance Market 2020 - 2024 ($ million)

5.2 Service segment analysis 2020 - 2024

Historic Market Size - Service Segment 2020 - 2024 ($ million)

5.3 Deployment segment analysis 2020 - 2024

Historic Market Size - Deployment Segment 2020 - 2024 ($ million)

5.4 Type segment analysis 2020 - 2024

Historic Market Size - Type Segment 2020 - 2024 ($ million)

5.5 Geography segment analysis 2020 - 2024

Historic Market Size - Geography Segment 2020 - 2024 ($ million)

5.6 Country segment analysis 2020 - 2024

Historic Market Size - Country Segment 2020 - 2024 ($ million)

6. Qualitative Analysis

6.1 Impact of AI on Global Pharmacovigilance Market

6.2 Impact of Geopolitical Conflicts on Global Pharmacovigilance Market

7. Five Forces Analysis

7.1 Five forces summary

Five forces analysis - Comparison between 2025 and 2030

7.2 Bargaining power of buyers

Bargaining power of buyers - Impact of key factors 2025 and 2030

7.3 Bargaining power of suppliers

Bargaining power of suppliers - Impact of key factors in 2025 and 2030

7.4 Threat of new entrants

Threat of new entrants - Impact of key factors in 2025 and 2030

7.5 Threat of substitutes

Threat of substitutes - Impact of key factors in 2025 and 2030

7.6 Threat of rivalry

Threat of rivalry - Impact of key factors in 2025 and 2030

7.7 Market condition

Chart on Market condition - Five forces 2025 and 2030

8. Market Segmentation by Service

8.1 Market segments

Chart on Service - Market share 2025-2030 (%)
Data Table on Service - Market share 2025-2030 (%)

8.2 Comparison by Service

Chart on Comparison by Service
Data Table on Comparison by Service

8.3 In-house - Market size and forecast 2025-2030

Chart on In-house - Market size and forecast 2025-2030 ($ million)
Data Table on In-house - Market size and forecast 2025-2030 ($ million)
Chart on In-house - Year-over-year growth 2025-2030 (%)
Data Table on In-house - Year-over-year growth 2025-2030 (%)

8.4 Contract outsourcing - Market size and forecast 2025-2030

Chart on Contract outsourcing - Market size and forecast 2025-2030 ($ million)
Data Table on Contract outsourcing - Market size and forecast 2025-2030 ($ million)
Chart on Contract outsourcing - Year-over-year growth 2025-2030 (%)
Data Table on Contract outsourcing - Year-over-year growth 2025-2030 (%)

8.5 Market opportunity by Service

Market opportunity by Service ($ million)
Data Table on Market opportunity by Service ($ million)

9. Market Segmentation by Deployment

9.1 Market segments

Chart on Deployment - Market share 2025-2030 (%)
Data Table on Deployment - Market share 2025-2030 (%)

9.2 Comparison by Deployment

Chart on Comparison by Deployment
Data Table on Comparison by Deployment

9.3 Cloud-based - Market size and forecast 2025-2030

Chart on Cloud-based - Market size and forecast 2025-2030 ($ million)
Data Table on Cloud-based - Market size and forecast 2025-2030 ($ million)
Chart on Cloud-based - Year-over-year growth 2025-2030 (%)
Data Table on Cloud-based - Year-over-year growth 2025-2030 (%)

9.4 On-premises - Market size and forecast 2025-2030

Chart on On-premises - Market size and forecast 2025-2030 ($ million)
Data Table on On-premises - Market size and forecast 2025-2030 ($ million)
Chart on On-premises - Year-over-year growth 2025-2030 (%)
Data Table on On-premises - Year-over-year growth 2025-2030 (%)

9.5 Hybrid - Market size and forecast 2025-2030

Chart on Hybrid - Market size and forecast 2025-2030 ($ million)
Data Table on Hybrid - Market size and forecast 2025-2030 ($ million)
Chart on Hybrid - Year-over-year growth 2025-2030 (%)
Data Table on Hybrid - Year-over-year growth 2025-2030 (%)

9.6 Market opportunity by Deployment

Market opportunity by Deployment ($ million)
Data Table on Market opportunity by Deployment ($ million)

10. Market Segmentation by Type

10.1 Market segments

Chart on Type - Market share 2025-2030 (%)
Data Table on Type - Market share 2025-2030 (%)

10.2 Comparison by Type

Chart on Comparison by Type
Data Table on Comparison by Type

10.3 Spontaneous reporting - Market size and forecast 2025-2030

Chart on Spontaneous reporting - Market size and forecast 2025-2030 ($ million)
Data Table on Spontaneous reporting - Market size and forecast 2025-2030 ($ million)
Chart on Spontaneous reporting - Year-over-year growth 2025-2030 (%)
Data Table on Spontaneous reporting - Year-over-year growth 2025-2030 (%)

10.4 Cohort event monitoring - Market size and forecast 2025-2030

Chart on Cohort event monitoring - Market size and forecast 2025-2030 ($ million)
Data Table on Cohort event monitoring - Market size and forecast 2025-2030 ($ million)
Chart on Cohort event monitoring - Year-over-year growth 2025-2030 (%)
Data Table on Cohort event monitoring - Year-over-year growth 2025-2030 (%)

10.5 Intensified ADR reporting - Market size and forecast 2025-2030

Chart on Intensified ADR reporting - Market size and forecast 2025-2030 ($ million)
Data Table on Intensified ADR reporting - Market size and forecast 2025-2030 ($ million)
Chart on Intensified ADR reporting - Year-over-year growth 2025-2030 (%)
Data Table on Intensified ADR reporting - Year-over-year growth 2025-2030 (%)

10.6 Targeted spontaneous reporting - Market size and forecast 2025-2030

Chart on Targeted spontaneous reporting - Market size and forecast 2025-2030 ($ million)
Data Table on Targeted spontaneous reporting - Market size and forecast 2025-2030 ($ million)
Chart on Targeted spontaneous reporting - Year-over-year growth 2025-2030 (%)
Data Table on Targeted spontaneous reporting - Year-over-year growth 2025-2030 (%)

10.7 EHR mining - Market size and forecast 2025-2030

Chart on EHR mining - Market size and forecast 2025-2030 ($ million)
Data Table on EHR mining - Market size and forecast 2025-2030 ($ million)
Chart on EHR mining - Year-over-year growth 2025-2030 (%)
Data Table on EHR mining - Year-over-year growth 2025-2030 (%)

10.8 Market opportunity by Type

Market opportunity by Type ($ million)
Data Table on Market opportunity by Type ($ million)

11. Customer Landscape

11.1 Customer landscape overview

Analysis of price sensitivity, lifecycle, customer purchase basket, adoption rates, and purchase criteria

12. Geographic Landscape

12.1 Geographic segmentation

Chart on Market share by geography 2025-2030 (%)
Data Table on Market share by geography 2025-2030 (%)

12.2 Geographic comparison

Chart on Geographic comparison
Data Table on Geographic comparison

12.3 North America - Market size and forecast 2025-2030

Chart on North America - Market size and forecast 2025-2030 ($ million)
Data Table on North America - Market size and forecast 2025-2030 ($ million)
Chart on North America - Year-over-year growth 2025-2030 (%)
Data Table on North America - Year-over-year growth 2025-2030 (%)
Chart on Regional Comparison - North America
Data Table on Regional Comparison - North America

12.3.1 US - Market size and forecast 2025-2030

Chart on US - Market size and forecast 2025-2030 ($ million)
Data Table on US - Market size and forecast 2025-2030 ($ million)
Chart on US - Year-over-year growth 2025-2030 (%)
Data Table on US - Year-over-year growth 2025-2030 (%)

12.3.2 Canada - Market size and forecast 2025-2030

Chart on Canada - Market size and forecast 2025-2030 ($ million)
Data Table on Canada - Market size and forecast 2025-2030 ($ million)
Chart on Canada - Year-over-year growth 2025-2030 (%)
Data Table on Canada - Year-over-year growth 2025-2030 (%)

12.3.3 Mexico - Market size and forecast 2025-2030

Chart on Mexico - Market size and forecast 2025-2030 ($ million)
Data Table on Mexico - Market size and forecast 2025-2030 ($ million)
Chart on Mexico - Year-over-year growth 2025-2030 (%)
Data Table on Mexico - Year-over-year growth 2025-2030 (%)

12.4 Europe - Market size and forecast 2025-2030

Chart on Europe - Market size and forecast 2025-2030 ($ million)
Data Table on Europe - Market size and forecast 2025-2030 ($ million)
Chart on Europe - Year-over-year growth 2025-2030 (%)
Data Table on Europe - Year-over-year growth 2025-2030 (%)
Chart on Regional Comparison - Europe
Data Table on Regional Comparison - Europe

12.4.1 Germany - Market size and forecast 2025-2030

Chart on Germany - Market size and forecast 2025-2030 ($ million)
Data Table on Germany - Market size and forecast 2025-2030 ($ million)
Chart on Germany - Year-over-year growth 2025-2030 (%)
Data Table on Germany - Year-over-year growth 2025-2030 (%)

12.4.2 UK - Market size and forecast 2025-2030

Chart on UK - Market size and forecast 2025-2030 ($ million)
Data Table on UK - Market size and forecast 2025-2030 ($ million)
Chart on UK - Year-over-year growth 2025-2030 (%)
Data Table on UK - Year-over-year growth 2025-2030 (%)

12.4.3 France - Market size and forecast 2025-2030

Chart on France - Market size and forecast 2025-2030 ($ million)
Data Table on France - Market size and forecast 2025-2030 ($ million)
Chart on France - Year-over-year growth 2025-2030 (%)
Data Table on France - Year-over-year growth 2025-2030 (%)

12.4.4 Italy - Market size and forecast 2025-2030

Chart on Italy - Market size and forecast 2025-2030 ($ million)
Data Table on Italy - Market size and forecast 2025-2030 ($ million)
Chart on Italy - Year-over-year growth 2025-2030 (%)
Data Table on Italy - Year-over-year growth 2025-2030 (%)

12.4.5 Spain - Market size and forecast 2025-2030

Chart on Spain - Market size and forecast 2025-2030 ($ million)
Data Table on Spain - Market size and forecast 2025-2030 ($ million)
Chart on Spain - Year-over-year growth 2025-2030 (%)
Data Table on Spain - Year-over-year growth 2025-2030 (%)

12.4.6 The Netherlands - Market size and forecast 2025-2030

Chart on The Netherlands - Market size and forecast 2025-2030 ($ million)
Data Table on The Netherlands - Market size and forecast 2025-2030 ($ million)
Chart on The Netherlands - Year-over-year growth 2025-2030 (%)
Data Table on The Netherlands - Year-over-year growth 2025-2030 (%)

12.5 Asia - Market size and forecast 2025-2030

Chart on Asia - Market size and forecast 2025-2030 ($ million)
Data Table on Asia - Market size and forecast 2025-2030 ($ million)
Chart on Asia - Year-over-year growth 2025-2030 (%)
Data Table on Asia - Year-over-year growth 2025-2030 (%)
Chart on Regional Comparison - Asia
Data Table on Regional Comparison - Asia

12.5.1 China - Market size and forecast 2025-2030

Chart on China - Market size and forecast 2025-2030 ($ million)
Data Table on China - Market size and forecast 2025-2030 ($ million)
Chart on China - Year-over-year growth 2025-2030 (%)
Data Table on China - Year-over-year growth 2025-2030 (%)

12.5.2 Japan - Market size and forecast 2025-2030

Chart on Japan - Market size and forecast 2025-2030 ($ million)
Data Table on Japan - Market size and forecast 2025-2030 ($ million)
Chart on Japan - Year-over-year growth 2025-2030 (%)
Data Table on Japan - Year-over-year growth 2025-2030 (%)

12.5.3 India - Market size and forecast 2025-2030

Chart on India - Market size and forecast 2025-2030 ($ million)
Data Table on India - Market size and forecast 2025-2030 ($ million)
Chart on India - Year-over-year growth 2025-2030 (%)
Data Table on India - Year-over-year growth 2025-2030 (%)

12.5.4 South Korea - Market size and forecast 2025-2030

Chart on South Korea - Market size and forecast 2025-2030 ($ million)
Data Table on South Korea - Market size and forecast 2025-2030 ($ million)
Chart on South Korea - Year-over-year growth 2025-2030 (%)
Data Table on South Korea - Year-over-year growth 2025-2030 (%)

12.5.5 Indonesia - Market size and forecast 2025-2030

Chart on Indonesia - Market size and forecast 2025-2030 ($ million)
Data Table on Indonesia - Market size and forecast 2025-2030 ($ million)
Chart on Indonesia - Year-over-year growth 2025-2030 (%)
Data Table on Indonesia - Year-over-year growth 2025-2030 (%)

12.5.6 Thailand - Market size and forecast 2025-2030

Chart on Thailand - Market size and forecast 2025-2030 ($ million)
Data Table on Thailand - Market size and forecast 2025-2030 ($ million)
Chart on Thailand - Year-over-year growth 2025-2030 (%)
Data Table on Thailand - Year-over-year growth 2025-2030 (%)

12.6 Rest of World (ROW) - Market size and forecast 2025-2030

Chart on Rest of World (ROW) - Market size and forecast 2025-2030 ($ million)
Data Table on Rest of World (ROW) - Market size and forecast 2025-2030 ($ million)
Chart on Rest of World (ROW) - Year-over-year growth 2025-2030 (%)
Data Table on Rest of World (ROW) - Year-over-year growth 2025-2030 (%)
Chart on Regional Comparison - Rest of World (ROW)
Data Table on Regional Comparison - Rest of World (ROW)

12.6.1 Brazil - Market size and forecast 2025-2030

Chart on Brazil - Market size and forecast 2025-2030 ($ million)
Data Table on Brazil - Market size and forecast 2025-2030 ($ million)
Chart on Brazil - Year-over-year growth 2025-2030 (%)
Data Table on Brazil - Year-over-year growth 2025-2030 (%)

12.6.2 South Africa - Market size and forecast 2025-2030

Chart on South Africa - Market size and forecast 2025-2030 ($ million)
Data Table on South Africa - Market size and forecast 2025-2030 ($ million)
Chart on South Africa - Year-over-year growth 2025-2030 (%)
Data Table on South Africa - Year-over-year growth 2025-2030 (%)

12.6.3 Saudi Arabia - Market size and forecast 2025-2030

Chart on Saudi Arabia - Market size and forecast 2025-2030 ($ million)
Data Table on Saudi Arabia - Market size and forecast 2025-2030 ($ million)
Chart on Saudi Arabia - Year-over-year growth 2025-2030 (%)
Data Table on Saudi Arabia - Year-over-year growth 2025-2030 (%)

12.6.4 Turkey - Market size and forecast 2025-2030

Chart on Turkey - Market size and forecast 2025-2030 ($ million)
Data Table on Turkey - Market size and forecast 2025-2030 ($ million)
Chart on Turkey - Year-over-year growth 2025-2030 (%)
Data Table on Turkey - Year-over-year growth 2025-2030 (%)

12.6.5 Israel - Market size and forecast 2025-2030

Chart on Israel - Market size and forecast 2025-2030 ($ million)
Data Table on Israel - Market size and forecast 2025-2030 ($ million)
Chart on Israel - Year-over-year growth 2025-2030 (%)
Data Table on Israel - Year-over-year growth 2025-2030 (%)

12.6.6 UAE - Market size and forecast 2025-2030

Chart on UAE - Market size and forecast 2025-2030 ($ million)
Data Table on UAE - Market size and forecast 2025-2030 ($ million)
Chart on UAE - Year-over-year growth 2025-2030 (%)
Data Table on UAE - Year-over-year growth 2025-2030 (%)

12.6.7 Argentina - Market size and forecast 2025-2030

Chart on Argentina - Market size and forecast 2025-2030 ($ million)
Data Table on Argentina - Market size and forecast 2025-2030 ($ million)
Chart on Argentina - Year-over-year growth 2025-2030 (%)
Data Table on Argentina - Year-over-year growth 2025-2030 (%)

12.6.8 Colombia - Market size and forecast 2025-2030

Chart on Colombia - Market size and forecast 2025-2030 ($ million)
Data Table on Colombia - Market size and forecast 2025-2030 ($ million)
Chart on Colombia - Year-over-year growth 2025-2030 (%)
Data Table on Colombia - Year-over-year growth 2025-2030 (%)

12.7 Market opportunity by geography

Market opportunity by geography ($ million)
Data Tables on Market opportunity by geography ($ million)

13. Drivers, Challenges, and Opportunity

13.1 Market drivers

Rising global burden of chronic diseases and rise of polypharmacy
Increasing stringency of regulatory frameworks and international harmonization efforts
Rapid technological integration and shift toward automated safety data management

13.2 Market challenges

Complexities in big data integration and multimodal source management
Global regulatory heterogeneity and stringent compliance standards
Scarcity of specialized talent and technical proficiency gap

13.3 Impact of drivers and challenges

Impact of drivers and challenges in 2025 and 2030

13.4 Market opportunities

Integration of AI and machine learning in signal detection
Shift toward active surveillance and real world evidence integration
Rising adoption of outsourcing and functional service provider models

14. Competitive Landscape

14.1 Overview

14.2

Overview on criticality of inputs and factors of differentiation

14.3 Landscape disruption

Overview on factors of disruption

14.4 Industry risks

Impact of key risks on business

15. Competitive Analysis

15.1 Companies profiled

Companies covered

15.2 Company ranking index

15.3 Market positioning of companies

Matrix on companies position and classification

15.4 AB Cube SARL

AB Cube SARL - Overview
AB Cube SARL - Product / Service
AB Cube SARL - Key offerings
SWOT

15.5 ArisGlobal LLC

ArisGlobal LLC - Overview
ArisGlobal LLC - Product / Service
ArisGlobal LLC - Key offerings
SWOT

15.6 Ennov SAS

Ennov SAS - Overview
Ennov SAS - Product / Service
Ennov SAS - Key offerings
SWOT

15.7 Eversana Life Science Services LLC

Eversana Life Science Services LLC - Overview
Eversana Life Science Services LLC - Product / Service
Eversana Life Science Services LLC - Key offerings
SWOT

15.8 EXTEDO GmbH

EXTEDO GmbH - Overview
EXTEDO GmbH - Product / Service
EXTEDO GmbH - Key offerings
SWOT

15.9 Fortrea Holdings Inc

Fortrea Holdings Inc - Overview
Fortrea Holdings Inc - Product / Service
Fortrea Holdings Inc - Key offerings
SWOT

15.10 ICON plc

ICON plc - Overview
ICON plc - Product / Service
ICON plc - Key offerings
SWOT

15.11 IQVIA Holdings Inc.

IQVIA Holdings Inc. - Overview
IQVIA Holdings Inc. - Business segments
IQVIA Holdings Inc. - Key offerings
IQVIA Holdings Inc. - Segment focus
SWOT

15.12 Medpace Holdings Inc.

Medpace Holdings Inc. - Overview
Medpace Holdings Inc. - Product / Service
Medpace Holdings Inc. - Key offerings
SWOT

15.13 Navitas Life Sciences

Navitas Life Sciences - Overview
Navitas Life Sciences - Product / Service
Navitas Life Sciences - Key offerings
SWOT

15.14 Parexel International Corp.

Parexel International Corp. - Overview
Parexel International Corp. - Product / Service
Parexel International Corp. - Key offerings
SWOT

15.15 ProPharma Group Holdings LLC

ProPharma Group Holdings LLC - Overview
ProPharma Group Holdings LLC - Product / Service
ProPharma Group Holdings LLC - Key news
ProPharma Group Holdings LLC - Key offerings
SWOT

15.16 Syneos Health Inc.

Syneos Health Inc. - Overview
Syneos Health Inc. - Product / Service
Syneos Health Inc. - Key offerings
SWOT

15.17 Veristat LLC

Veristat LLC - Overview
Veristat LLC - Product / Service
Veristat LLC - Key offerings
SWOT

15.18 Worldwide Clinical Trials Holdings

Worldwide Clinical Trials Holdings - Overview
Worldwide Clinical Trials Holdings - Product / Service
Worldwide Clinical Trials Holdings - Key offerings
SWOT

16. Appendix

16.1 Scope of the report

Market definition
Objectives
Notes and caveats

16.2 Inclusions and exclusions checklist

Inclusions checklist
Exclusions checklist

16.3 Currency conversion rates for US$

16.4 Research methodology

16.5 Data procurement

Information sources

16.6 Data validation

16.7 Validation techniques employed for market sizing

16.8 Data synthesis

16.9 360 degree market analysis

16.10 List of abbreviations

Research Methodology

Technavio presents a detailed picture of the market by way of study, synthesis, and summation of data from multiple sources. The analysts have presented the various facets of the market with a particular focus on identifying the key industry influencers. The data thus presented is comprehensive, reliable, and the result of extensive research, both primary and secondary.

INFORMATION SOURCES

Primary sources

  • Manufacturers and suppliers
  • Channel partners
  • Industry experts
  • Strategic decision makers

Secondary sources

  • Industry journals and periodicals
  • Government data
  • Financial reports of key industry players
  • Historical data
  • Press releases

DATA ANALYSIS

Data Synthesis

  • Collation of data
  • Estimation of key figures
  • Analysis of derived insights

Data Validation

  • Triangulation with data models
  • Reference against proprietary databases
  • Corroboration with industry experts

REPORT WRITING

Qualitative

  • Market drivers
  • Market challenges
  • Market trends
  • Five forces analysis

Quantitative

  • Market size and forecast
  • Market segmentation
  • Geographical insights
  • Competitive landscape

Interested in this report?

Get your sample now to see our research methodology and insights!

Download Now

Frequently Asked Questions

Pharmacovigilance market growth will increase by USD 3377.4 million during 2026-2030.

The Pharmacovigilance market is expected to grow at a CAGR of 6.1% during 2026-2030.

Pharmacovigilance market is segmented by Service (In-house, Contract outsourcing) Deployment (Cloud-based, On-premises, Hybrid) Type (Spontaneous reporting, Cohort event monitoring, Intensified ADR reporting, Targeted spontaneous reporting, EHR mining)

AB Cube SARL, Allucent, APCER Life Sciences Inc., ArisGlobal LLC, ClinChoice Inc., Ennov SAS, Eversana Life Science Services LLC, EXTEDO GmbH, Fortrea Holdings Inc, Freyr Software Services, ICON plc, IQVIA Holdings Inc., MakroCare, Medpace Holdings Inc., Navitas Life Sciences, Parexel International Corp., ProPharma Group Holdings LLC, Syneos Health Inc., Veristat LLC, Worldwide Clinical Trials Holdings are a few of the key vendors in the Pharmacovigilance market.

North America will register the highest growth rate of 33.2% among the other regions. Therefore, the Pharmacovigilance market in North America is expected to garner significant business opportunities for the vendors during the forecast period.

US, Canada, Mexico, Germany, UK, France, Italy, Spain, The Netherlands, China, Japan, India, South Korea, Indonesia, Thailand, Brazil, South Africa, Saudi Arabia, Turkey, Israel, UAE, Argentina, Colombia

  • Rising global burden of chronic diseases and rise of polypharmacy is the driving factor this market.

The Pharmacovigilance market vendors should focus on grabbing business opportunities from the Service segment as it accounted for the largest market share in the base year.
RIA - Research AI Assistant
Ask RIA
