
Phenylketonuria Treatment Market Size 2024-2028
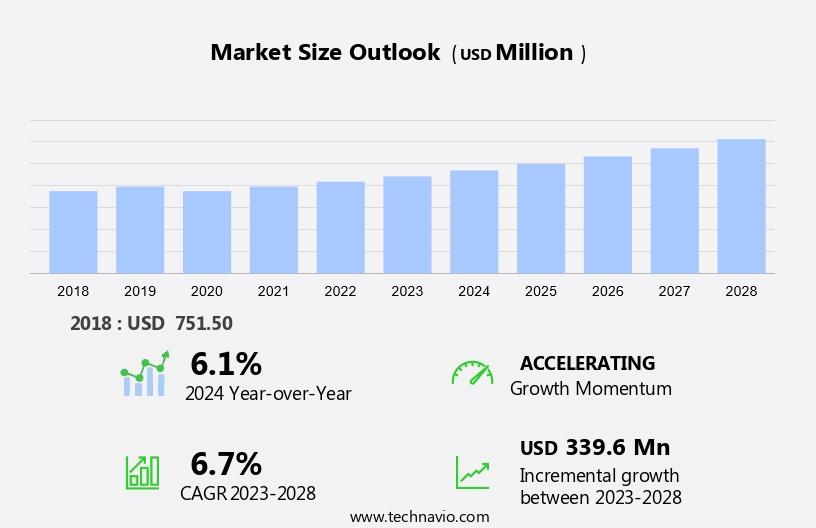
The phenylketonuria treatment market size is forecast to increase by USD 339.6 million at a CAGR of 6.7% between 2023 and 2028.
- Phenylketonuria (PKU), a genetic disorder affecting amino acid metabolism, necessitates careful management to prevent complications. Treatment approaches include dietary management and drug therapy. Dietary management involves strict adherence to a low-protein diet to limit phenylalanine intake. Drug therapy includes oral and parenteral administration of phenylalanine-lowering agents. Market trends include increasing investments in genomic research and development, driving advancements in PKU treatment. Strategic alliances among market players further boost innovation. However, the high cost of treatment remains a significant challenge, limiting access for many patients. This report provides a comprehensive analysis of the treatment market, covering adult and pediatric medical devices management, and the role of hospitals and specialty clinics in its delivery.
What will the Phenylketonuria Treatment Market Size during the forecast period?
- Phenylketonuria (PKU), a metabolic disorder characterized by the inability to metabolize phenylalanine (Phe), necessitates stringent management for optimal patient outcomes. Early diagnosis through newborn screening programs and subsequent implementation of appropriate therapies play a crucial role in mitigating the adverse effects of this condition. Currently, the primary treatment for PKU involves adhering to a low-Phe diet and, in some cases, pharmacological interventions. The low-Phe diet restricts the intake of Phe-rich foods to prevent the accumulation of toxic levels in the blood.
- This dietary management is essential for managing PKU, as elevated Phe levels can lead to neurocognitive impairments and other complications. Pharmacological interventions, such as sapropterin dihydrochloride, are employed to enhance metabolic control in individuals with PKU. These treatments aim to reduce the body's production of Phe or enhance its metabolism, thereby improving patient outcomes. Genetic testing is another crucial aspect of PKU management. Identifying carriers and at-risk individuals through genetic testing can help prevent the condition's transmission and facilitate early intervention. Hospitals and clinics play a vital role in providing genetic testing services and managing PKU patients through teleconsultancy and regular monitoring.
How is this market segmented and which is the largest segment?
The market research report provides comprehensive data (region-wise segment analysis), with forecasts and estimates in "USD million" for the period 2024-2028, as well as historical data from 2018-2022 for the following segments.
- Drug Class
- Sapropterin
- Pegvaliase-pqpz
- Geography
- North America
- Canada
- US
- Europe
- Asia
- Rest of World (ROW)
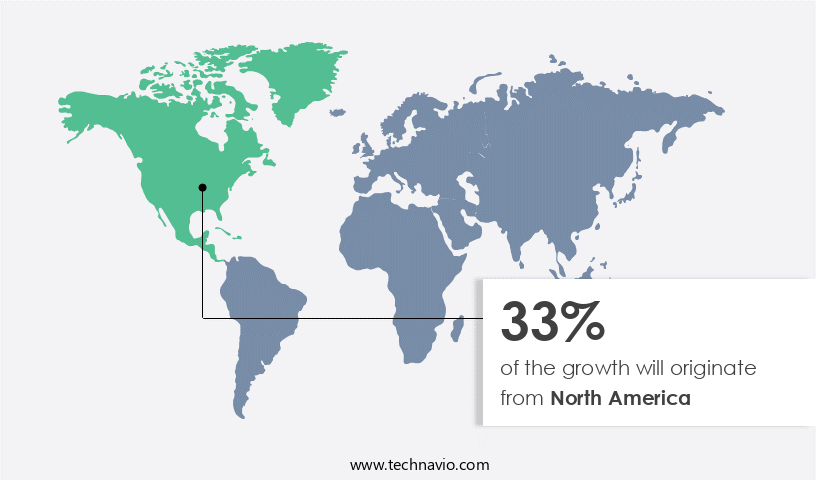
- North America
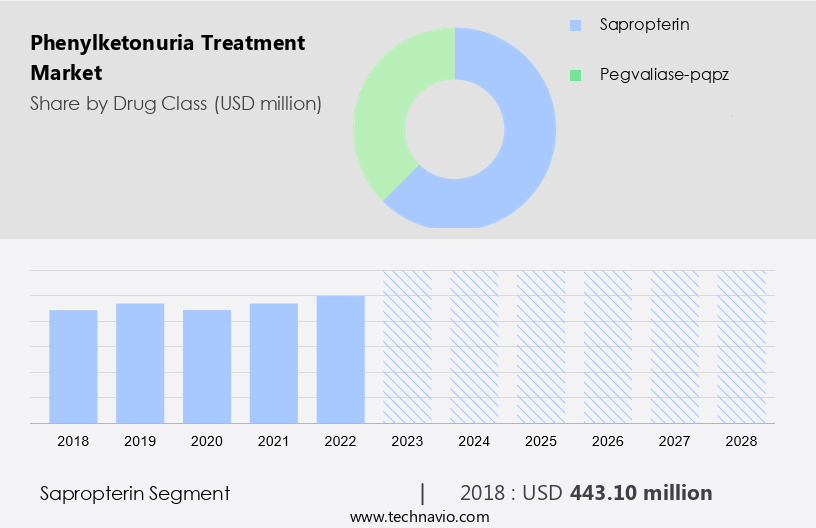
By Drug Class Insights
- The sapropterin segment is estimated to witness significant growth during the forecast period.
Phenylketonuria (PKU), a genetic disorder affecting amino acid metabolism, requires careful management to prevent the buildup of phenylalanine in the blood. Two primary approaches for PKU treatment are dietary management and drug therapy. Sapropterin dihydrochloride, a synthetic formulation of the active 6R-isomer of tetrahydrobiopterin, is an approved treatment for tetrahydrobiopterin-responsive PKU in Europe for patients over 4 years old and in adults and children responsive to such treatment. In the market, sapropterin is authorized to reduce blood phenylalanine levels in patients with tetrahydrobiopterin-responsive PKU. This medication is administered orally and has been proven effective in lowering blood phenylalanine levels in randomized, double-blind trials.
Furthermore, hospitals, healthcare services, and specialty clinics are common settings for PKU treatment, offering both dietary management and drug therapy options. Hence, such factors are fuelling the growth of this segment during the forecast period.
Get a glance at the market report of share of various segments Request Free Sample
The sapropterin segment was valued at USD 443.10 million in 2018 and showed a gradual increase during the forecast period.
Regional Analysis
- North America is estimated to contribute 33% to the growth of the global market during the forecast period.
Technavio's analysts have elaborately explained the regional trends and drivers that shape the market during the forecast period.
For more insights on the market share of various regions Request Free Sample
The prevalence of Phenylketonuria (PKU), a genetic disorder affecting amino acid metabolism, is on the rise in the United States, leading to a growing need for effective treatment solutions. Newborn screening programs have become increasingly important in identifying PKU cases early, allowing for timely intervention and improved patient outcomes. The market for PKU treatment in the US is witnessing significant growth due to this heightened focus on patient care and the availability of advanced therapies. Pharmacological treatments, such as sapropterin dihydrochloride, are commonly used to manage PKU symptoms. However, the low-phenylketonuria (LPKD) diet remains a crucial aspect of PKU management.
Genetic testing and novel therapies are also being explored to address the underlying causes of PKU and improve patient quality of life. Despite these advancements, the social stigma surrounding PKU can pose challenges for patients. Some patients may require parenteral administration of treatments, which can further complicate their care. As research continues to uncover new insights into PKU and its treatment, it is expected that the market for PKU treatment in the US will continue to expand, offering opportunities for companies to make a positive impact on patient lives.
Market Dynamics
Our researchers analyzed the data with 2023 as the base year, along with the key drivers, trends, and challenges. A holistic analysis of drivers will help companies refine their marketing strategies to gain a competitive advantage.
What are the key market drivers leading to the rise in adoption of Phenylketonuria Treatment Market?
Rising investments in genomic research and development is the key driver of the market.
- The advancements in genetics research have garnered substantial investments from various sources, enabling institutions and organizations to develop innovative therapeutics and personalized medicines for a range of conditions, including Phenylketonuria (PKU).
- This genetic disorder necessitates strict dietary restrictions to manage Phenylalanine (Phe) levels and prevent neurocognitive impairment. Healthcare professionals and specialty clinics play a crucial role in the management of PKU, offering treatment alternatives and ensuring treatment adherence. Teleconsultancy and metabolic control are essential components of PKU care, allowing for regular monitoring and adjustments to treatment plans. The PKU treatment market has witnessed considerable growth due to the increasing prevalence of this condition and the availability of advanced treatment options.
What are the market trends shaping the Phenylketonuria Treatment Market?
Rising strategic alliances by companies is the upcoming trend in the market.
- The market is characterized by a limited number of major players. Notable companies dominate the market due to their extensive offerings of protein ingredients for PKU treatment. They are actively engaged in research and development initiatives to expand the application of these treatments in various medical and research contexts. To maintain their competitive edge, these key players employ strategies such as mergers and acquisitions, product launches, and collaborations.
- Advancements in newborn screening technologies have led to earlier PKU detection and diagnosis, necessitating the development of innovative therapeutic solutions. Gene editing techniques, including prime editing and base editing, are increasingly being explored as potential treatments for PKU. Drug formulations that address the underlying genetic causes of PKU are also under development. The focus on these advanced therapeutic approaches is expected to significantly impact patient outcomes and drive market growth. In conclusion, the market is driven by the presence of a few major players, each offering a diverse range of protein ingredients and finished products. These companies are dedicated to research and development efforts, ensuring the availability of cutting-edge therapeutic solutions for PKU.
What challenges does Phenylketonuria Treatment Market face during its growth?
The high cost of treatment is a key challenge affecting the market growth.
- Phenylketonuria (PKU), a genetic disorder affecting metabolism, requires ongoing treatment to manage blood phenylalanine levels. The primary interventions include a strict diet and medication. However, the high cost of these treatments poses a significant challenge to the growth of the PKU treatment market. Specialty medical foods and formulae, essential for PKU patients, are expensive and often unaffordable for individuals with limited financial resources. Unfortunately, these essential components are not always covered by insurance or state programs, exacerbating the financial burden for patients.
- This high cost is anticipated to negatively impact the treatment market during the forecast period. Gene transfer therapies, such as those developed by PTC Therapeutics, offer potential solutions to this issue by addressing the root cause of PKU. However, clinical trials and regulatory approvals are necessary before these treatments can be widely adopted. PKU awareness programs and collaborations between metabolism specialists and geneticists are crucial to increasing access to affordable and effective treatments for this condition.
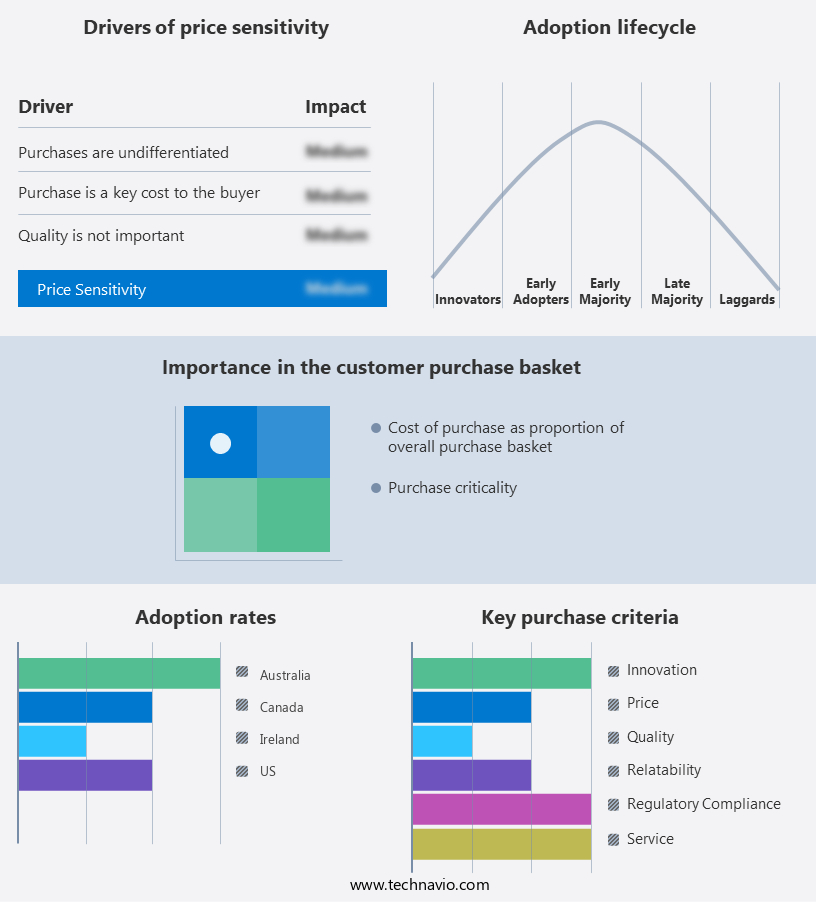
Exclusive Customer Landscape
The market forecasting report includes the adoption lifecycle of the market, covering from the innovator's stage to the laggard's stage. It focuses on adoption rates in different regions based on penetration. Furthermore, the market report also includes key purchase criteria and drivers of price sensitivity to help companies evaluate and develop their market growth analysis strategies.
Customer Landscape
Key Companies & Market Insights
Companies are implementing various strategies, such as strategic alliances, market forecast, partnerships, mergers and acquisitions, geographical expansion, and product/service launches, to enhance their presence in the market. The market research and growth report includes detailed analyses of the competitive landscape of the market and information about key companies, including:
- American Gene Technologies
- BioMarin Pharmaceutical Inc.
- Codexis Inc
- Dr. Schar
- Evox Therapeutics Ltd.
- Homology Medicines Inc.
- Jnana Therapeutics
- Nestle Health Science S.A.
- SOM Innovation Biotech S.A.
- Synlogic Inc.
Qualitative and quantitative analysis of companies has been conducted to help clients understand the wider business environment as well as the strengths and weaknesses of key market players. Data is qualitatively analyzed to categorize companies as pure play, category-focused, industry-focused, and diversified; it is quantitatively analyzed to categorize companies as dominant, leading, strong, tentative, and weak.
Research Analyst Overview
Phenylketonuria (PKU), a rare genetic disorder, affects the metabolism of the essential amino acid phenylalanine (Phe). Untreated PKU can lead to neurological damage and developmental delays. Early detection through enhanced newborn screening is crucial for effective management. Therapeutic solutions include dietary management and pharmacological treatments. Dietary management involves strict adherence to a low-Phe diet, while drug therapies such as sapropterin dihydrochloride help increase the body's ability to metabolize Phe. Advanced therapies like gene therapy, prime editing, and base editing hold promise for PKU treatment. These novel therapies aim to correct the underlying genetic mutation, offering potential long-term benefits.
Moreover, patient outcomes significantly improve with early diagnosis and personalized treatment plans. Healthcare providers in hospitals and specialty clinics play a vital role in PKU management. Patient awareness programs and immunoprotein diagnostic testing are essential for timely intervention. Teleconsultancy and clinical trials further expand treatment options. Adult and pediatric management strategies vary, with oral and parenteral administration methods available. Medical foods and next-generation sequencing contribute to better patient care. Healthcare professionals continue to explore treatment alternatives to minimize the social stigma associated with PKU and ensure optimal metabolic control.
|
Market Scope |
|
|
Report Coverage |
Details |
|
Page number |
151 |
|
Base year |
2023 |
|
Historic period |
2018-2022 |
|
Forecast period |
2024-2028 |
|
Growth momentum & CAGR |
Accelerate at a CAGR of 6.7% |
|
Market Growth 2024-2028 |
USD 339.6 million |
|
Market structure |
Concentrated |
|
YoY growth 2023-2024(%) |
6.1 |
|
Key countries |
US, Canada, Australia, and Ireland |
|
Competitive landscape |
Leading Companies, Market Positioning of Companies, Competitive Strategies, and Industry Risks |
What are the Key Data Covered in this Market Research and Growth Report?
- CAGR of the market during the forecast period
- Detailed information on factors that will drive the market growth and forecasting between 2024 and 2028
- Precise estimation of the size of the market and its contribution of the market in focus to the parent market
- Accurate predictions about upcoming market growth and trends and changes in consumer behaviour
- Growth of the market across North America, Europe, Asia, and Rest of World (ROW)
- Thorough analysis of the market's competitive landscape and detailed information about companies
- Comprehensive analysis of factors that will challenge the growth of market companies
We can help! Our analysts can customize this market research report to meet your requirements. Get in touch
 RIA -
RIA - 
