Polysilicon Market Analysis, Size, and Forecast 2024-2028: North America (US and Canada), Europe (France, Germany, Italy, and UK), Middle East and Africa (Egypt, KSA, Oman, and UAE), APAC (China, India, and Japan), South America (Argentina and Brazil), and Rest of World (ROW)

Polysilicon Market Analysis, Size, and Forecast 2024-2028:
North America (US and Canada), Europe (France, Germany, Italy, and UK), Middle East and Africa (Egypt, KSA, Oman, and UAE), APAC (China, India, and Japan), South America (Argentina and Brazil), and Rest of World (ROW)

Published: Jul 2024 153 Pages SKU: IRTNTR76121

Market Overview at a Glance

$14.25 B
Market Opportunity
16.83%
CAGR
14.01
YoY growth 2023-2024(%)

Polysilicon Market Size 2024-2028

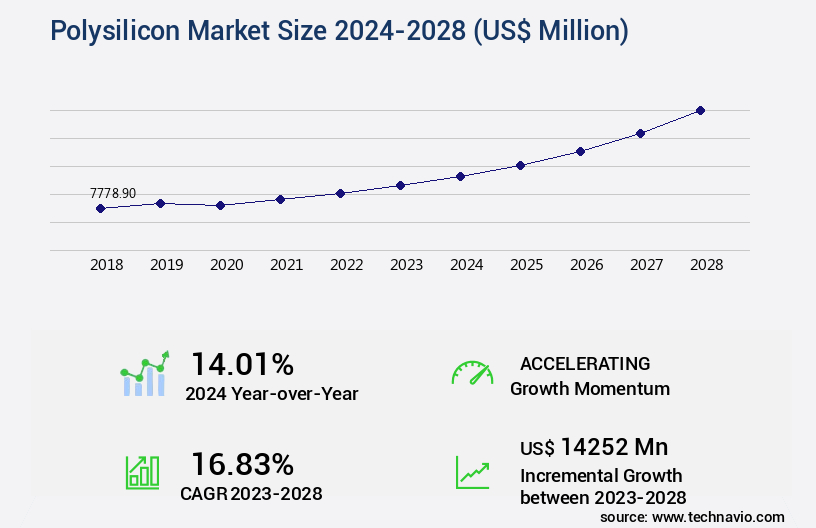
The polysilicon market size is valued to increase USD 14.25 billion, at a CAGR of 16.83% from 2023 to 2028. Rise in solar PV installations will drive the polysilicon market.

Major Market Trends & Insights

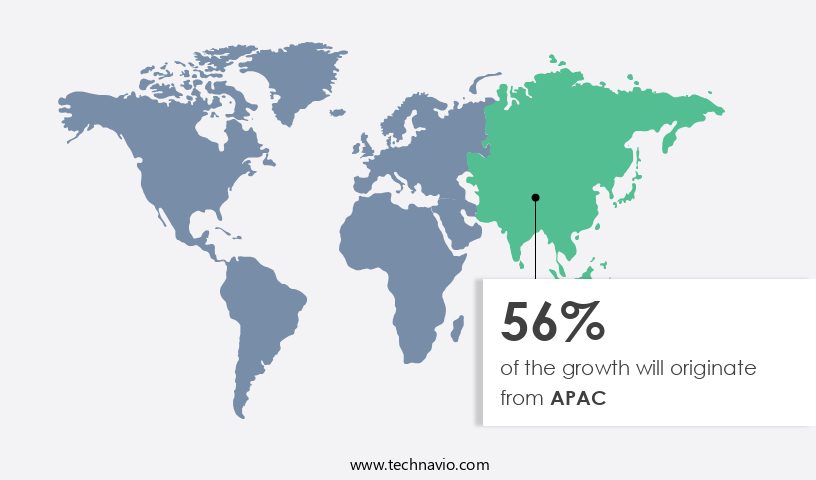
  • APAC dominated the market and accounted for a 56% growth during the forecast period.
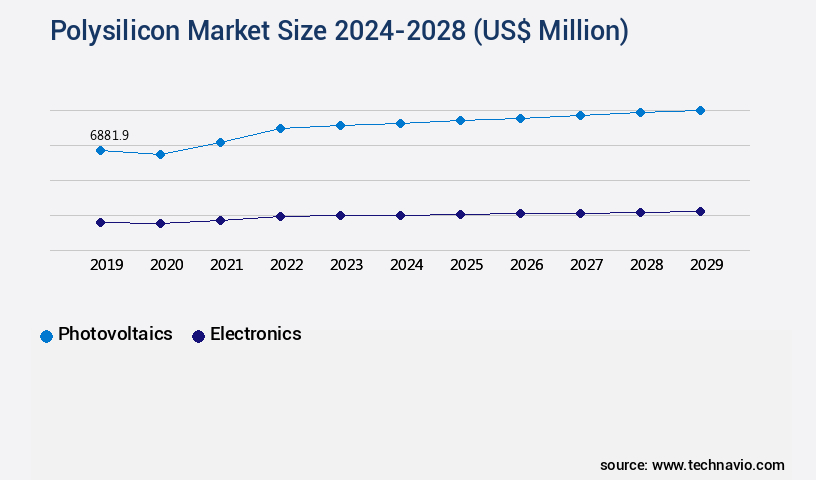
  • By Application - Photovoltaics segment was valued at USD 6.09 billion in 2022
  • By Type - Wafers or chips segment accounted for the largest market revenue share in 2022

Market Size & Forecast

  • Market Opportunities: USD 238.99 million
  • Market Future Opportunities: USD 14252.00 million
  • CAGR : 16.83%
  • APAC: Largest market in 2022

Market Summary

  • The market encompasses the production, sale, and application of polysilicon, a crucial material in the semiconductor and solar industries. Core technologies, such as monocrystalline and multicrystalline silicon, dominate the solar photovolvoltaic (PV) sector, driving market growth. Applications include solar PV modules and solar cells, with the latter accounting for approximately 90% of global polysilicon demand. However, the intermittent nature of solar power generation necessitates advancements in energy storage solutions like microgrids. Regulations, such as the European Union's REPowerEU plan, aim to boost renewable energy adoption, creating opportunities for the market expansion.
  • As of 2021, the solar PV industry accounted for over 90% of global polysilicon demand, with an estimated 110 GW of new solar PV capacity expected to be installed by 2025.

What will be the Size of the Polysilicon Market during the forecast period?

Polysilicon Market Size

Get Key Insights on Market Forecast (PDF) Request Free Sample

How is the Polysilicon Market Segmented and what are the key trends of market segmentation?

The polysilicon industry research report provides comprehensive data (region-wise segment analysis), with forecasts and estimates in "USD million" for the period 2024-2028, as well as historical data from 2018-2022 for the following segments.

  • Application
    • Photovoltaics
    • Electronics
  • Type
    • Wafers or chips
    • Chunks
    • Rods
  • Production Process
    • Siemens Process
    • Fluidized Bed Reactor
    • Upgraded Metallurgical Grade
  • End-use Industry
    • Renewable Energy
    • Electronics
    • Industrial
  • Geography
    • North America
      • US
      • Canada
    • Europe
      • France
      • Germany
      • Italy
      • UK
    • Middle East and Africa
      • Egypt
      • KSA
      • Oman
      • UAE
    • APAC
      • China
      • India
      • Japan
    • South America
      • Argentina
      • Brazil
    • Rest of World (ROW)

By Application Insights

The photovoltaics segment is estimated to witness significant growth during the forecast period.

The market holds substantial growth potential, particularly in the photovoltaic (PV) segment. Solar PV cells and panels are manufactured using molten silicon, which is poured into a cast and solidified into multi-polysilicon wafers. This approach, an alternative to using single silicon crystals, offers several advantages. The abundance, stability, and low toxicity of silicon, coupled with the cost-effectiveness of polysilicon, make it a preferred choice for photovoltaic applications. Grain size is a critical factor influencing the efficiency of polysilicon solar PV cells. Generally, larger grain sizes lead to increased efficiency. Process optimization techniques, such as crystal growth rate control, silicon purification, and crystal orientation control, are essential for producing high-quality polysilicon.

These techniques contribute to the production of solar-grade silicon, which is used extensively in solar cell manufacturing. Power electronics and material characterization are other significant applications of polysilicon. Metallurgical-grade silicon, a lower-purity form of polysilicon, is used in these applications. The semiconductor industry also relies heavily on polysilicon due to its excellent material properties. Cost reduction strategies, such as fluidized bed reactors, silicon tetrachloride usage, defect density control, and waste reduction methods, are essential for maintaining the competitiveness of polysilicon manufacturers. Quality control processes, including chemical vapor deposition and impurity reduction, ensure the production of high-purity polysilicon. The market is expected to grow by approximately 15% in the next year, driven by increasing demand for solar energy and advancements in polysilicon production technology.

Additionally, the market is projected to expand by around 12% annually over the next five years. These growth figures underscore the market's dynamic and evolving nature.

Polysilicon Market Size

Request Free Sample

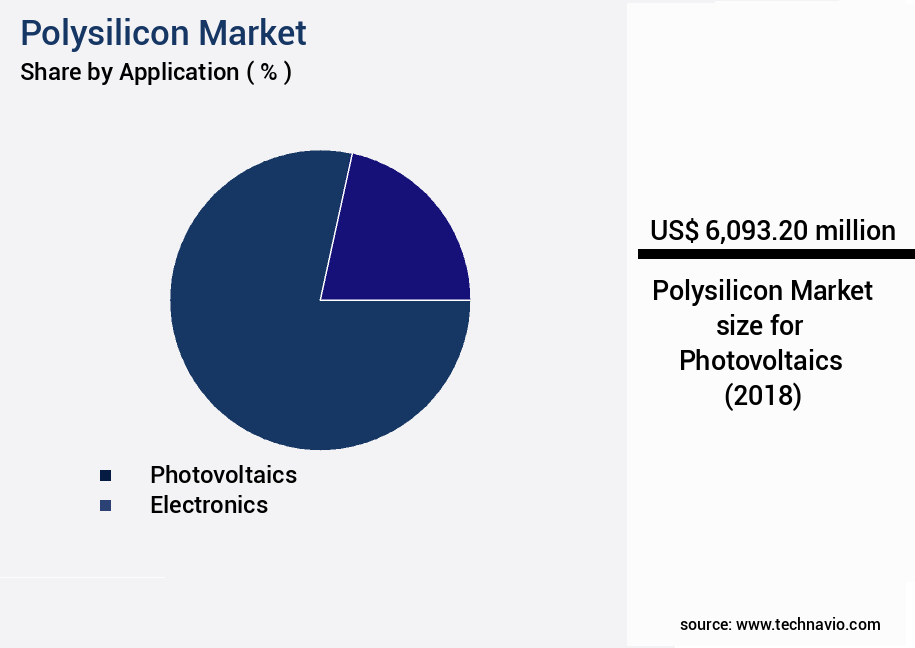
The Photovoltaics segment was valued at USD 6.09 billion in 2018 and showed a gradual increase during the forecast period.

Polysilicon Market Size

Request Free Sample

Regional Analysis

APAC is estimated to contribute 56% to the growth of the global market during the forecast period.Technavio's analysts have elaborately explained the regional trends and drivers that shape the market during the forecast period.

Polysilicon Market Share by Geography

See How Polysilicon Market Demand is Rising in APAC Request Free Sample

The APAC the market is experiencing substantial expansion, with China, Japan, India, Australia, and South Korea being the major contributors. China holds a significant market share due to government financial incentive programs like feed-in tariffs (FiTs) in China, Japan, Thailand, and Vietnam. These initiatives aim to encourage the shift towards renewable energy, particularly solar power, in response to increasing greenhouse gas emissions in China and India. The region's rapid execution of solar energy projects underscores the growing focus on replacing fossil fuels.

In 2023, China, Japan, India, Australia, and South Korea accounted for approximately 85% of the APAC the market share. The region's commitment to renewable energy and the ongoing execution of solar projects indicate a promising future for the market in APAC.

Market Dynamics

Our researchers analyzed the data with 2023 as the base year, along with the key drivers, trends, and challenges. A holistic analysis of drivers will help companies refine their marketing strategies to gain a competitive advantage.

The market is a critical sector in the semiconductor and solar industries, driven by the continuous quest for silicon ingot production yield enhancement and reducing silicon wafer defect density. The global market is focused on improving polysilicon purity levels through advanced silicon purification techniques, such as controlled crystal growth rate in the Czochralski process and minimizing energy consumption in polysilicon production. Optimizing fluidized bed reactor performance and employing innovative advanced chemical vapor deposition methods are other key strategies to enhance silicon wafer surface quality and improve polysilicon production efficiency. Advanced methods for silicon purification, including effective impurity reduction strategies, precise control of crystallographic orientation, and robust wafer polishing techniques, are essential to meet the stringent requirements of high-purity polysilicon production processes.

The market is witnessing significant investments in research and development to introduce new technologies for solar-grade silicon production. Compared to traditional production methods, the latest innovations in silicon wafer manufacturing are expected to reduce the cost of polysilicon production by more than 20%. This cost reduction is a result of the improved efficiency of advanced purification techniques and the optimization of silicon ingot slicing techniques. The industrial application segment is projected to account for a significantly larger share of the market compared to the academic segment, driven by the growing demand for semiconductors in various industries. In conclusion, the market is a dynamic and evolving sector, with a strong focus on enhancing production efficiency, reducing costs, and improving purity levels.

The market is expected to witness robust growth, driven by the continuous advancements in silicon purification techniques and the increasing demand for high-purity polysilicon in various industries.

Polysilicon Market Size

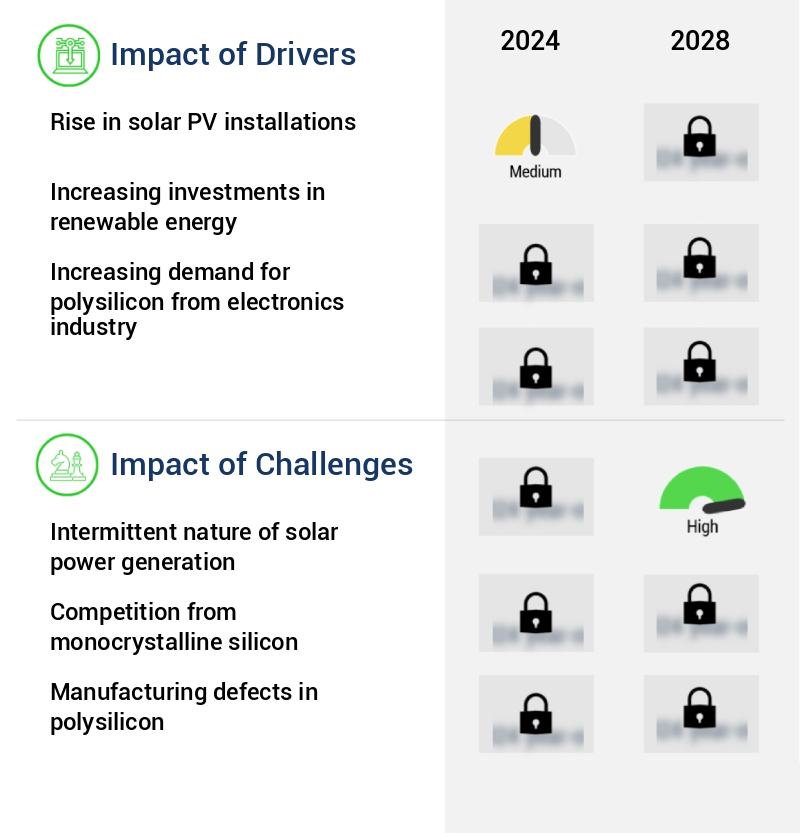
What are the key market drivers leading to the rise in the adoption of Polysilicon Industry?

  • The significant increase in solar photovoltaic (PV) installations serves as the primary market driver. 
  • Solar photovoltaic (PV) installations have experienced substantial growth in recent years, fueled by the decreasing cost of solar PV components and systems. Solar energy has emerged as a cost-effective alternative to fossil fuel-powered generators, making it an attractive choice for electricity generation. This cost advantage enables countries to expand their solar power capacity at an accelerated pace compared to other renewable energy sources. According to the International Energy Agency (IEA), solar PV installations are projected to increase by approximately 30% in China and the United States in the upcoming years. This surge in installations can be attributed to developers' efforts to complete projects before potential policy changes take effect.
  • Solar power's affordability and increasing adoption across various sectors, including residential, commercial, and utility-scale, further underscore its market significance. The solar power market's continuous evolution is driven by technological advancements, policy incentives, and increasing investor interest. As a result, the market presents significant opportunities for businesses and investors seeking to capitalize on the growing demand for clean, renewable energy solutions. In summary, the solar power market is undergoing significant growth due to the declining cost of solar PV systems, making it a cost-effective electricity generation option. Countries are expanding their solar power capacity at a faster rate than other renewables, and this trend is expected to continue as technological advancements, policy incentives, and investor interest drive market growth.

What are the market trends shaping the Polysilicon Industry?

  • The increasing trend in the market is the wider adoption of microgrids. Microgrids are becoming more prevalent in various industries and applications.
  • A microgrid is a self-contained power system that incorporates local generation and storage resources. Microgrids can function autonomously or collaborate with other small power grids, transitioning between grid-connected and island modes as needed. Microgrids offer resilience against power outages, particularly in regions prone to instability. According to recent studies, microgrids have gained significant traction in various sectors, including healthcare, education, and industrial applications. For instance, in the healthcare sector, microgrids ensure uninterrupted power supply during emergencies. In the education sector, microgrids provide a reliable power source during campus power outages.
  • In the industrial sector, microgrids enhance energy efficiency and reduce reliance on the main power grid. The integration of renewable energy sources into microgrids further bolsters their appeal, contributing to a more sustainable energy landscape. Microgrids' flexibility and adaptability make them an essential component of modern power systems.

What challenges does the Polysilicon Industry face during its growth?

  • The intermittent nature of solar power generation poses a significant challenge to the industry's growth, requiring continuous research and development of advanced energy storage solutions and grid management systems to ensure a stable and reliable electricity supply. 
  • Solar power adoption has witnessed a notable rise as the prices of photovolvoltaic (PV) systems and related technologies decline. This trend has led to a substantial increase in solar PV installations globally. Yet, the intermittent nature of solar power poses a considerable challenge to its widespread adoption. Solar PV output is subject to various factors, including the degree of shading, panel efficiency, and solar irradiation, which can fluctuate throughout the day and under overcast conditions. Despite these challenges, advancements in energy storage solutions and smart grid technologies are enabling the integration of solar power into the electricity grid more efficiently.
  • For instance, the use of batteries for energy storage can help balance the intermittency of solar power and ensure a consistent power supply. Additionally, smart grid technologies can optimize the distribution of electricity and prioritize the use of renewable energy sources like solar power during peak hours. These advancements underscore the evolving nature of the solar power market and the ongoing efforts to address the intermittency challenge. As the industry continues to innovate and adapt, the adoption of solar power is expected to grow further, making it an increasingly viable and sustainable energy source for businesses and households alike.

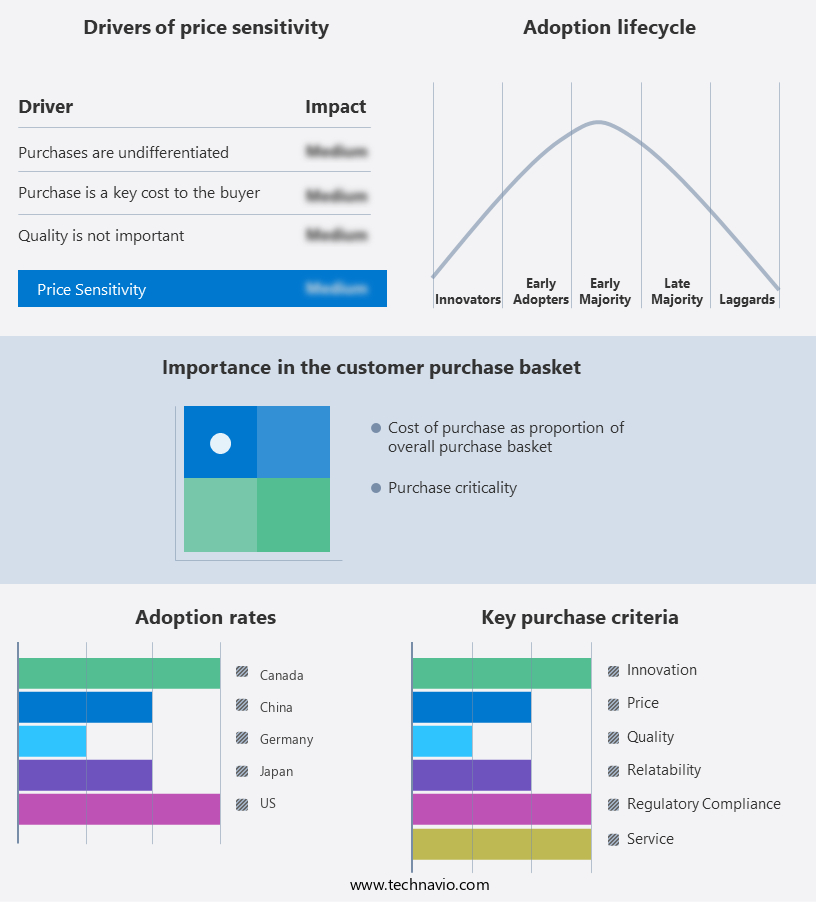
Exclusive Customer Landscape

The polysilicon market forecasting report includes the adoption lifecycle of the market, covering from the innovator's stage to the laggard's stage. It focuses on adoption rates in different regions based on penetration. Furthermore, the polysilicon market report also includes key purchase criteria and drivers of price sensitivity to help companies evaluate and develop their market growth analysis strategies.

Polysilicon Market Share by Geography

 Customer Landscape of Polysilicon Industry

Competitive Landscape & Market Insights

Companies are implementing various strategies, such as strategic alliances, polysilicon market forecast, partnerships, mergers and acquisitions, geographical expansion, and product/service launches, to enhance their presence in the industry.

Asia Silicon (Qinghai) Co. Ltd. - The company specializes in producing medium to extra large polysilicon chunks for solar industries, ensuring high-quality standards and consistent supply. With a strong focus on research and development, this entity remains a significant player in The market.

The industry research and growth report includes detailed analyses of the competitive landscape of the market and information about key companies, including:

  • Asia Silicon (Qinghai) Co. Ltd.
  • Daqo New Energy Corp.
  • East Hope Group
  • GCL-Poly Energy Holdings
  • Hankook Silicon Co. Ltd.
  • Hemlock Semiconductor
  • LDK Solar
  • Mitsubishi Materials Corporation
  • OCI Company Ltd.
  • Osaka Titanium Technologies
  • Qatar Solar Technologies
  • REC Silicon ASA
  • Shin-Etsu Chemical Co. Ltd.
  • SunEdison
  • TBEA Co. Ltd.
  • Tokuyama Corporation
  • Tongwei Group
  • Wacker Chemie AG
  • Xinte Energy Co. Ltd.
  • Yongxiang Polysilicon

Qualitative and quantitative analysis of companies has been conducted to help clients understand the wider business environment as well as the strengths and weaknesses of key industry players. Data is qualitatively analyzed to categorize companies as pure play, category-focused, industry-focused, and diversified; it is quantitatively analyzed to categorize companies as dominant, leading, strong, tentative, and weak.

Recent Development and News in Polysilicon Market

  • In January 2024, Wacker Chemicals AG, a leading polysilicon manufacturer, announced the expansion of its polysilicon production capacity by 15,000 metric tons per year at its Burghausen site in Germany (Wacker Chemicals AG press release). This expansion aimed to meet the growing demand for solar-grade polysilicon in the renewable energy sector.
  • In March 2024, MEMC Electronic Materials, a global leader in silicon wafer and solar photovoltaic (PV) solutions, entered into a strategic partnership with Hanwha Q CELLS, a leading solar module manufacturer, to develop and supply advanced silicon materials for Hanwha's high-performance solar modules (MEMC Electronic Materials press release). This collaboration aimed to enhance the efficiency and competitiveness of Hanwha's solar modules.
  • In May 2024, GCL-Poly Energy Holdings Limited, the world's largest polysilicon producer, raised approximately USD1.2 billion through a share placement to fund its expansion plans (Reuters). The funds were allocated towards increasing its polysilicon production capacity and strengthening its presence in the global solar market.
  • In April 2025, the European Union (EU) announced the approval of a €2.2 billion (USD2.5 billion) funding program to support the production of solar-grade polysilicon in Europe (European Commission press release). The program aimed to reduce Europe's dependence on imports and boost the European solar industry's competitiveness. This initiative was expected to create thousands of jobs and contribute significantly to the EU's green energy goals.

Dive into Technavio's robust research methodology, blending expert interviews, extensive data synthesis, and validated models for unparalleled Polysilicon Market insights. See full methodology.

Market Scope

Report Coverage

Details

Page number

153

Base year

2023

Historic period

2018-2022

Forecast period

2024-2028

Growth momentum & CAGR

Accelerate at a CAGR of 16.83%

Market growth 2024-2028

USD 14252 million

Market structure

Concentrated

YoY growth 2023-2024(%)

14.01

Key countries

US, Canada, Germany, UK, Italy, France, China, India, Japan, Brazil, Egypt, UAE, Oman, Argentina, KSA, UAE, Brazil, and Rest of World (ROW)

Competitive landscape

Leading Companies, Market Positioning of Companies, Competitive Strategies, and Industry Risks

Request Free Sample

Research Analyst Overview

  • The market is a dynamic and evolving landscape, driven by continuous advancements in process optimization techniques for silicon ingot production. Two prominent methods, the Czochralski method and Siemens process, are utilized to manufacture high-purity polysilicon for various applications. In photovoltaic applications, material properties analysis plays a crucial role in ensuring the optimal crystal growth rate for solar cell manufacturing. Power electronics and material characterization are essential for understanding the behavior of metallurgical grade silicon in different applications. Cost reduction strategies are a significant focus in the polysilicon industry, with ongoing research into improving production yield optimization, crystal orientation control, and impurity reduction.
  • Solar grade silicon is a key component in the production of solar panels, with fluidized bed reactors and silicon purification processes playing essential roles in enhancing polysilicon's purity. Wafers manufacturing also undergoes constant innovation, with a focus on grain size control and quality control processes to minimize defect density and waste. Chemical vapor deposition and other purification techniques are employed to enhance polysilicon's purity further. Energy efficiency metrics and electronic devices are integral to the market, with electronic grade silicon being a critical component in semiconductor materials. The market's evolution is characterized by a relentless pursuit of cost reduction strategies, process optimization, and material characterization to meet the evolving demands of various industries.

What are the Key Data Covered in this Polysilicon Market Research and Growth Report?

  • What is the expected growth of the Polysilicon Market between 2024 and 2028?

    • USD 14.25 billion, at a CAGR of 16.83%

  • What segmentation does the market report cover?

    • The report segmented by Application (Photovoltaics and Electronics), Type (Wafers or chips, Chunks, and Rods), Geography (APAC, North America, Europe, South America, and Middle East and Africa), Production Process (Siemens Process, Fluidized Bed Reactor, and Upgraded Metallurgical Grade), and End-use Industry (Renewable Energy, Electronics, and Industrial)

  • Which regions are analyzed in the report?

    • APAC, North America, Europe, South America, and Middle East and Africa

  • What are the key growth drivers and market challenges?

    • Rise in solar PV installations, Intermittent nature of solar power generation

  • Who are the major players in the Polysilicon Market?

    • Key Companies Asia Silicon (Qinghai) Co. Ltd., Daqo New Energy Corp., East Hope Group, GCL-Poly Energy Holdings, Hankook Silicon Co. Ltd., Hemlock Semiconductor, LDK Solar, Mitsubishi Materials Corporation, OCI Company Ltd., Osaka Titanium Technologies, Qatar Solar Technologies, REC Silicon ASA, Shin-Etsu Chemical Co. Ltd., SunEdison, TBEA Co. Ltd., Tokuyama Corporation, Tongwei Group, Wacker Chemie AG, Xinte Energy Co. Ltd., and Yongxiang Polysilicon

Market Research Insights

  • The market is a critical component of the semiconductor industry, with global demand projected to reach 1.2 million metric tons by 2025, representing a significant increase from the 800,000 metric tons consumed in 2020. This growth is driven by the increasing demand for solar panels and semiconductor devices, which rely on high-purity polysilicon for their production. Maintaining product specifications is a key challenge in the market. Crystallographic defects, particle contamination, and metal impurities can significantly impact the resistivity and minority carrier lifetime of the final product. Regulatory compliance and safety protocols are essential to ensure the production of high-quality polysilicon.
  • Automation technologies, such as data acquisition systems and process control systems, are increasingly being adopted to improve yield and reduce production costs. Supply chain management and raw material sourcing are also critical areas of focus, with a growing emphasis on carbon concentration and oxygen concentration in the production process. Equipment maintenance and real-time monitoring are essential for ensuring consistent product quality and minimizing process troubleshooting. The market is characterized by stringent industry standards and a focus on continuous improvement methods, including energy consumption analysis, cost analysis models, and environmental impact assessment. Silicon nitride ingot slicing and wafer polishing techniques are also crucial aspects of the production process, with a strong emphasis on surface defect inspection and quality assurance protocols.

We can help! Our analysts can customize this polysilicon market research report to meet your requirements.

Get in touch

1 Executive Summary

  • 1.1 Market overview
    • Executive Summary - Chart on Market Overview
    • Executive Summary - Data Table on Market Overview
    • Executive Summary - Chart on Global Market Characteristics
    • Executive Summary - Chart on Market by Geography
    • Executive Summary - Chart on Market Segmentation by Application
    • Executive Summary - Chart on Market Segmentation by Type
    • Executive Summary - Chart on Incremental Growth
    • Executive Summary - Data Table on Incremental Growth
    • Executive Summary - Chart on Company Market Positioning

2 Market Landscape

  • 2.1 Market ecosystem
    • Parent Market
    • Data Table on - Parent Market
  • 2.2 Market characteristics
    • Market characteristics analysis
  • 2.3 Value chain analysis
    • Value Chain Analysis

3 Market Sizing

  • 3.1 Market definition
    • Offerings of companies included in the market definition
  • 3.2 Market segment analysis
    • Market segments
  • 3.3 Market size 2023
    • 3.4 Market outlook: Forecast for 2023-2028
      • Chart on Global - Market size and forecast 2023-2028 ($ million)
      • Data Table on Global - Market size and forecast 2023-2028 ($ million)
      • Chart on Global Market: Year-over-year growth 2023-2028 (%)
      • Data Table on Global Market: Year-over-year growth 2023-2028 (%)

    4 Historic Market Size

    • 4.1 Global Polysilicon Market 2018 - 2022
      • Historic Market Size - Data Table on Global Polysilicon Market 2018 - 2022 ($ million)
    • 4.2 Application segment analysis 2018 - 2022
      • Historic Market Size - Application Segment 2018 - 2022 ($ million)
    • 4.3 Type segment analysis 2018 - 2022
      • Historic Market Size - Type Segment 2018 - 2022 ($ million)
    • 4.4 Geography segment analysis 2018 - 2022
      • Historic Market Size - Geography Segment 2018 - 2022 ($ million)
    • 4.5 Country segment analysis 2018 - 2022
      • Historic Market Size - Country Segment 2018 - 2022 ($ million)

    5 Five Forces Analysis

    • 5.1 Five forces summary
      • Five forces analysis - Comparison between 2023 and 2028
    • 5.2 Bargaining power of buyers
      • Bargaining power of buyers - Impact of key factors 2023 and 2028
    • 5.3 Bargaining power of suppliers
      • Bargaining power of suppliers - Impact of key factors in 2023 and 2028
    • 5.4 Threat of new entrants
      • Threat of new entrants - Impact of key factors in 2023 and 2028
    • 5.5 Threat of substitutes
      • Threat of substitutes - Impact of key factors in 2023 and 2028
    • 5.6 Threat of rivalry
      • Threat of rivalry - Impact of key factors in 2023 and 2028
    • 5.7 Market condition
      • Chart on Market condition - Five forces 2023 and 2028

    6 Market Segmentation by Application

    • 6.1 Market segments
      • Chart on Application - Market share (2023-2028) (%)
      • Data Table on Application - Market share (2023-2028) (%)
    • 6.2 Comparison by Application
      • Chart on Comparison by Application
      • Data Table on Comparison by Application
    • 6.3 Photovoltaics - Market size and forecast (2023-2028)
      • Chart on Photovoltaics - Market size and forecast (2023-2028) ($ million)
      • Data Table on Photovoltaics - Market size and forecast (2023-2028) ($ million)
      • Chart on Photovoltaics - Year-over-year growth (2023-2028) (%)
      • Data Table on Photovoltaics - Year-over-year growth (2023-2028) (%)
    • 6.4 Electronics - Market size and forecast (2023-2028)
      • Chart on Electronics - Market size and forecast (2023-2028) ($ million)
      • Data Table on Electronics - Market size and forecast (2023-2028) ($ million)
      • Chart on Electronics - Year-over-year growth (2023-2028) (%)
      • Data Table on Electronics - Year-over-year growth (2023-2028) (%)
    • 6.5 Market opportunity by Application
      • Market opportunity by Application ($ million)
      • Data Table on Market opportunity by Application ($ million)

    7 Market Segmentation by Type

    • 7.1 Market segments
      • Chart on Type - Market share (2023-2028) (%)
      • Data Table on Type - Market share (2023-2028) (%)
    • 7.2 Comparison by Type
      • Chart on Comparison by Type
      • Data Table on Comparison by Type
    • 7.3 Wafers or chips - Market size and forecast (2023-2028)
      • Chart on Wafers or chips - Market size and forecast (2023-2028) ($ million)
      • Data Table on Wafers or chips - Market size and forecast (2023-2028) ($ million)
      • Chart on Wafers or chips - Year-over-year growth (2023-2028) (%)
      • Data Table on Wafers or chips - Year-over-year growth (2023-2028) (%)
    • 7.4 Chunks - Market size and forecast (2023-2028)
      • Chart on Chunks - Market size and forecast (2023-2028) ($ million)
      • Data Table on Chunks - Market size and forecast (2023-2028) ($ million)
      • Chart on Chunks - Year-over-year growth (2023-2028) (%)
      • Data Table on Chunks - Year-over-year growth (2023-2028) (%)
    • 7.5 Rods - Market size and forecast (2023-2028)
      • Chart on Rods - Market size and forecast (2023-2028) ($ million)
      • Data Table on Rods - Market size and forecast (2023-2028) ($ million)
      • Chart on Rods - Year-over-year growth (2023-2028) (%)
      • Data Table on Rods - Year-over-year growth (2023-2028) (%)
    • 7.6 Market opportunity by Type
      • Market opportunity by Type ($ million)
      • Data Table on Market opportunity by Type ($ million)

    8 Market Segmentation by Production Process

    • 8.1 Market segments
      • Chart on Production Process - Market share (2023-2028) (%)
      • Data Table on Production Process - Market share (2023-2028) (%)
    • 8.2 Comparison by Production Process
      • Chart on Comparison by Production Process
      • Data Table on Comparison by Production Process
    • 8.3 Siemens Process - Market size and forecast (2023-2028)
      • Chart on Siemens Process - Market size and forecast (2023-2028) ($ million)
      • Data Table on Siemens Process - Market size and forecast (2023-2028) ($ million)
      • Chart on Siemens Process - Year-over-year growth (2023-2028) (%)
      • Data Table on Siemens Process - Year-over-year growth (2023-2028) (%)
    • 8.4 Fluidized Bed Reactor - Market size and forecast (2023-2028)
      • Chart on Fluidized Bed Reactor - Market size and forecast (2023-2028) ($ million)
      • Data Table on Fluidized Bed Reactor - Market size and forecast (2023-2028) ($ million)
      • Chart on Fluidized Bed Reactor - Year-over-year growth (2023-2028) (%)
      • Data Table on Fluidized Bed Reactor - Year-over-year growth (2023-2028) (%)
    • 8.5 Upgraded Metallurgical Grade - Market size and forecast (2023-2028)
      • Chart on Upgraded Metallurgical Grade - Market size and forecast (2023-2028) ($ million)
      • Data Table on Upgraded Metallurgical Grade - Market size and forecast (2023-2028) ($ million)
      • Chart on Upgraded Metallurgical Grade - Year-over-year growth (2023-2028) (%)
      • Data Table on Upgraded Metallurgical Grade - Year-over-year growth (2023-2028) (%)
    • 8.6 Market opportunity by Production Process
      • Market opportunity by Production Process ($ million)
      • Data Table on Market opportunity by Production Process ($ million)

    9 Market Segmentation by End-use Industry

    • 9.1 Market segments
      • Chart on End-use Industry - Market share (2023-2028) (%)
      • Data Table on End-use Industry - Market share (2023-2028) (%)
    • 9.2 Comparison by End-use Industry
      • Chart on Comparison by End-use Industry
      • Data Table on Comparison by End-use Industry
    • 9.3 Renewable Energy - Market size and forecast (2023-2028)
      • Chart on Renewable Energy - Market size and forecast (2023-2028) ($ million)
      • Data Table on Renewable Energy - Market size and forecast (2023-2028) ($ million)
      • Chart on Renewable Energy - Year-over-year growth (2023-2028) (%)
      • Data Table on Renewable Energy - Year-over-year growth (2023-2028) (%)
    • 9.4 Electronics - Market size and forecast (2023-2028)
      • Chart on Electronics - Market size and forecast (2023-2028) ($ million)
      • Data Table on Electronics - Market size and forecast (2023-2028) ($ million)
      • Chart on Electronics - Year-over-year growth (2023-2028) (%)
      • Data Table on Electronics - Year-over-year growth (2023-2028) (%)
    • 9.5 Industrial - Market size and forecast (2023-2028)
      • Chart on Industrial - Market size and forecast (2023-2028) ($ million)
      • Data Table on Industrial - Market size and forecast (2023-2028) ($ million)
      • Chart on Industrial - Year-over-year growth (2023-2028) (%)
      • Data Table on Industrial - Year-over-year growth (2023-2028) (%)
    • 9.6 Market opportunity by End-use Industry
      • Market opportunity by End-use Industry ($ million)
      • Data Table on Market opportunity by End-use Industry ($ million)

    10 Customer Landscape

    • 10.1 Customer landscape overview
      • Analysis of price sensitivity, lifecycle, customer purchase basket, adoption rates, and purchase criteria

    11 Geographic Landscape

    • 11.1 Geographic segmentation
      • Chart on Market share by geography 2023-2028 (%)
      • Data Table on Market share by geography 2023-2028 (%)
    • 11.2 Geographic comparison
      • Chart on Geographic comparison
      • Data Table on Geographic comparison
    • 11.3 APAC - Market size and forecast 2023-2028
      • Chart on APAC - Market size and forecast 2023-2028 ($ million)
      • Data Table on APAC - Market size and forecast 2023-2028 ($ million)
      • Chart on APAC - Year-over-year growth 2023-2028 (%)
      • Data Table on APAC - Year-over-year growth 2023-2028 (%)
    • 11.4 North America - Market size and forecast 2023-2028
      • Chart on North America - Market size and forecast 2023-2028 ($ million)
      • Data Table on North America - Market size and forecast 2023-2028 ($ million)
      • Chart on North America - Year-over-year growth 2023-2028 (%)
      • Data Table on North America - Year-over-year growth 2023-2028 (%)
    • 11.5 Europe - Market size and forecast 2023-2028
      • Chart on Europe - Market size and forecast 2023-2028 ($ million)
      • Data Table on Europe - Market size and forecast 2023-2028 ($ million)
      • Chart on Europe - Year-over-year growth 2023-2028 (%)
      • Data Table on Europe - Year-over-year growth 2023-2028 (%)
    • 11.6 South America - Market size and forecast 2023-2028
      • Chart on South America - Market size and forecast 2023-2028 ($ million)
      • Data Table on South America - Market size and forecast 2023-2028 ($ million)
      • Chart on South America - Year-over-year growth 2023-2028 (%)
      • Data Table on South America - Year-over-year growth 2023-2028 (%)
    • 11.7 Middle East and Africa - Market size and forecast 2023-2028
      • Chart on Middle East and Africa - Market size and forecast 2023-2028 ($ million)
      • Data Table on Middle East and Africa - Market size and forecast 2023-2028 ($ million)
      • Chart on Middle East and Africa - Year-over-year growth 2023-2028 (%)
      • Data Table on Middle East and Africa - Year-over-year growth 2023-2028 (%)
    • 11.8 China - Market size and forecast 2023-2028
      • Chart on China - Market size and forecast 2023-2028 ($ million)
      • Data Table on China - Market size and forecast 2023-2028 ($ million)
      • Chart on China - Year-over-year growth 2023-2028 (%)
      • Data Table on China - Year-over-year growth 2023-2028 (%)
    • 11.9 US - Market size and forecast 2023-2028
      • Chart on US - Market size and forecast 2023-2028 ($ million)
      • Data Table on US - Market size and forecast 2023-2028 ($ million)
      • Chart on US - Year-over-year growth 2023-2028 (%)
      • Data Table on US - Year-over-year growth 2023-2028 (%)
    • 11.10 Japan - Market size and forecast 2023-2028
      • Chart on Japan - Market size and forecast 2023-2028 ($ million)
      • Data Table on Japan - Market size and forecast 2023-2028 ($ million)
      • Chart on Japan - Year-over-year growth 2023-2028 (%)
      • Data Table on Japan - Year-over-year growth 2023-2028 (%)
    • 11.11 Germany - Market size and forecast 2023-2028
      • Chart on Germany - Market size and forecast 2023-2028 ($ million)
      • Data Table on Germany - Market size and forecast 2023-2028 ($ million)
      • Chart on Germany - Year-over-year growth 2023-2028 (%)
      • Data Table on Germany - Year-over-year growth 2023-2028 (%)
    • 11.12 Canada - Market size and forecast 2023-2028
      • Chart on Canada - Market size and forecast 2023-2028 ($ million)
      • Data Table on Canada - Market size and forecast 2023-2028 ($ million)
      • Chart on Canada - Year-over-year growth 2023-2028 (%)
      • Data Table on Canada - Year-over-year growth 2023-2028 (%)
    • 11.13 Market opportunity by geography
      • Market opportunity by geography ($ million)
      • Data Tables on Market opportunity by geography ($ million)
    • 11.14 UK - Market size and forecast (2023-2028)
      • Chart on UK - Market size and forecast (2023-2028) ($ million)
      • Data Table on UK - Market size and forecast (2023-2028) ($ million)
      • Chart on UK - Year-over-year growth (2023-2028) (%)
      • Data Table on UK - Year-over-year growth (2023-2028) (%)
    • 11.15 Italy - Market size and forecast (2023-2028)
      • Chart on Italy - Market size and forecast (2023-2028) ($ million)
      • Data Table on Italy - Market size and forecast (2023-2028) ($ million)
      • Chart on Italy - Year-over-year growth (2023-2028) (%)
      • Data Table on Italy - Year-over-year growth (2023-2028) (%)
    • 11.16 France - Market size and forecast (2023-2028)
      • Chart on France - Market size and forecast (2023-2028) ($ million)
      • Data Table on France - Market size and forecast (2023-2028) ($ million)
      • Chart on France - Year-over-year growth (2023-2028) (%)
      • Data Table on France - Year-over-year growth (2023-2028) (%)
    • 11.17 India - Market size and forecast (2023-2028)
      • Chart on India - Market size and forecast (2023-2028) ($ million)
      • Data Table on India - Market size and forecast (2023-2028) ($ million)
      • Chart on India - Year-over-year growth (2023-2028) (%)
      • Data Table on India - Year-over-year growth (2023-2028) (%)
    • 11.18 Brazil - Market size and forecast (2023-2028)
      • Chart on Brazil - Market size and forecast (2023-2028) ($ million)
      • Data Table on Brazil - Market size and forecast (2023-2028) ($ million)
      • Chart on Brazil - Year-over-year growth (2023-2028) (%)
      • Data Table on Brazil - Year-over-year growth (2023-2028) (%)
    • 11.19 Egypt - Market size and forecast (2023-2028)
      • Chart on Egypt - Market size and forecast (2023-2028) ($ million)
      • Data Table on Egypt - Market size and forecast (2023-2028) ($ million)
      • Chart on Egypt - Year-over-year growth (2023-2028) (%)
      • Data Table on Egypt - Year-over-year growth (2023-2028) (%)
    • 11.20 UAE - Market size and forecast (2023-2028)
      • Chart on UAE - Market size and forecast (2023-2028) ($ million)
      • Data Table on UAE - Market size and forecast (2023-2028) ($ million)
      • Chart on UAE - Year-over-year growth (2023-2028) (%)
      • Data Table on UAE - Year-over-year growth (2023-2028) (%)
    • 11.21 Oman - Market size and forecast (2023-2028)
      • Chart on Oman - Market size and forecast (2023-2028) ($ million)
      • Data Table on Oman - Market size and forecast (2023-2028) ($ million)
      • Chart on Oman - Year-over-year growth (2023-2028) (%)
      • Data Table on Oman - Year-over-year growth (2023-2028) (%)
    • 11.22 Argentina - Market size and forecast (2023-2028)
      • Chart on Argentina - Market size and forecast (2023-2028) ($ million)
      • Data Table on Argentina - Market size and forecast (2023-2028) ($ million)
      • Chart on Argentina - Year-over-year growth (2023-2028) (%)
      • Data Table on Argentina - Year-over-year growth (2023-2028) (%)
    • 11.23 KSA - Market size and forecast (2023-2028)
      • Chart on KSA - Market size and forecast (2023-2028) ($ million)
      • Data Table on KSA - Market size and forecast (2023-2028) ($ million)
      • Chart on KSA - Year-over-year growth (2023-2028) (%)
      • Data Table on KSA - Year-over-year growth (2023-2028) (%)
    • 11.24 Rest of World (ROW) - Market size and forecast (2023-2028)
      • Chart on Rest of World (ROW) - Market size and forecast (2023-2028) ($ million)
      • Data Table on Rest of World (ROW) - Market size and forecast (2023-2028) ($ million)
      • Chart on Rest of World (ROW) - Year-over-year growth (2023-2028) (%)
      • Data Table on Rest of World (ROW) - Year-over-year growth (2023-2028) (%)

    12 Drivers, Challenges, and Opportunity/Restraints

    • 12.1 Market drivers
      • 12.2 Market challenges
        • 12.3 Impact of drivers and challenges
          • Impact of drivers and challenges in 2023 and 2028
        • 12.4 Market opportunities/restraints

          13 Competitive Landscape

          • 13.1 Overview
            • 13.2 Competitive Landscape
              • Overview on criticality of inputs and factors of differentiation
            • 13.3 Landscape disruption
              • Overview on factors of disruption
            • 13.4 Industry risks
              • Impact of key risks on business

            14 Competitive Analysis

            • 14.1 Companies profiled
              • Companies covered
            • 14.2 Market positioning of companies
              • Matrix on companies position and classification
            • 14.3 Asia Silicon (Qinghai) Co. Ltd.
              • Asia Silicon (Qinghai) Co. Ltd. - Overview
              • Asia Silicon (Qinghai) Co. Ltd. - Product / Service
              • Asia Silicon (Qinghai) Co. Ltd. - Key offerings
            • 14.4 Daqo New Energy Corp.
              • Daqo New Energy Corp. - Overview
              • Daqo New Energy Corp. - Product / Service
              • Daqo New Energy Corp. - Key offerings
            • 14.5 East Hope Group
              • East Hope Group - Overview
              • East Hope Group - Product / Service
              • East Hope Group - Key offerings
            • 14.6 GCL-Poly Energy Holdings
              • GCL-Poly Energy Holdings - Overview
              • GCL-Poly Energy Holdings - Product / Service
              • GCL-Poly Energy Holdings - Key offerings
            • 14.7 Hankook Silicon Co. Ltd.
              • Hankook Silicon Co. Ltd. - Overview
              • Hankook Silicon Co. Ltd. - Product / Service
              • Hankook Silicon Co. Ltd. - Key offerings
            • 14.8 Hemlock Semiconductor
              • Hemlock Semiconductor - Overview
              • Hemlock Semiconductor - Product / Service
              • Hemlock Semiconductor - Key offerings
            • 14.9 LDK Solar
              • LDK Solar - Overview
              • LDK Solar - Product / Service
              • LDK Solar - Key offerings
            • 14.10 Mitsubishi Materials Corporation
              • Mitsubishi Materials Corporation - Overview
              • Mitsubishi Materials Corporation - Product / Service
              • Mitsubishi Materials Corporation - Key offerings
            • 14.11 OCI Company Ltd.
              • OCI Company Ltd. - Overview
              • OCI Company Ltd. - Product / Service
              • OCI Company Ltd. - Key offerings
            • 14.12 Osaka Titanium Technologies
              • Osaka Titanium Technologies - Overview
              • Osaka Titanium Technologies - Product / Service
              • Osaka Titanium Technologies - Key offerings
            • 14.13 Qatar Solar Technologies
              • Qatar Solar Technologies - Overview
              • Qatar Solar Technologies - Product / Service
              • Qatar Solar Technologies - Key offerings
            • 14.14 REC Silicon ASA
              • REC Silicon ASA - Overview
              • REC Silicon ASA - Product / Service
              • REC Silicon ASA - Key offerings
            • 14.15 Shin-Etsu Chemical Co. Ltd.
              • Shin-Etsu Chemical Co. Ltd. - Overview
              • Shin-Etsu Chemical Co. Ltd. - Product / Service
              • Shin-Etsu Chemical Co. Ltd. - Key offerings
            • 14.16 SunEdison
              • SunEdison - Overview
              • SunEdison - Product / Service
              • SunEdison - Key offerings
            • 14.17 TBEA Co. Ltd.
              • TBEA Co. Ltd. - Overview
              • TBEA Co. Ltd. - Product / Service
              • TBEA Co. Ltd. - Key offerings
            • 14.18 Tokuyama Corporation
              • Tokuyama Corporation - Overview
              • Tokuyama Corporation - Product / Service
              • Tokuyama Corporation - Key offerings
            • 14.19 Tongwei Group
              • Tongwei Group - Overview
              • Tongwei Group - Product / Service
              • Tongwei Group - Key offerings
            • 14.20 Wacker Chemie AG
              • Wacker Chemie AG - Overview
              • Wacker Chemie AG - Product / Service
              • Wacker Chemie AG - Key offerings
            • 14.21 Xinte Energy Co. Ltd.
              • Xinte Energy Co. Ltd. - Overview
              • Xinte Energy Co. Ltd. - Product / Service
              • Xinte Energy Co. Ltd. - Key offerings
            • 14.22 Yongxiang Polysilicon
              • Yongxiang Polysilicon - Overview
              • Yongxiang Polysilicon - Product / Service
              • Yongxiang Polysilicon - Key offerings
            • 14.23 Wacker Chemie AG
              • Wacker Chemie AG - Overview
              • Wacker Chemie AG - Product / Service
              • Wacker Chemie AG - Key offerings
            • 14.24 OCI Company Ltd.
              • OCI Company Ltd. - Overview
              • OCI Company Ltd. - Product / Service
              • OCI Company Ltd. - Key offerings
            • 14.25 GCL-Poly Energy Holdings
              • GCL-Poly Energy Holdings - Overview
              • GCL-Poly Energy Holdings - Product / Service
              • GCL-Poly Energy Holdings - Key offerings
            • 14.26 Tongwei Group
              • Tongwei Group - Overview
              • Tongwei Group - Product / Service
              • Tongwei Group - Key offerings
            • 14.27 Daqo New Energy Corp.
              • Daqo New Energy Corp. - Overview
              • Daqo New Energy Corp. - Product / Service
              • Daqo New Energy Corp. - Key offerings
            • 14.28 Hemlock Semiconductor
              • Hemlock Semiconductor - Overview
              • Hemlock Semiconductor - Product / Service
              • Hemlock Semiconductor - Key offerings
            • 14.29 Xinte Energy Co. Ltd.
              • Xinte Energy Co. Ltd. - Overview
              • Xinte Energy Co. Ltd. - Product / Service
              • Xinte Energy Co. Ltd. - Key offerings
            • 14.30 REC Silicon ASA
              • REC Silicon ASA - Overview
              • REC Silicon ASA - Product / Service
              • REC Silicon ASA - Key offerings
            • 14.31 Tokuyama Corporation
              • Tokuyama Corporation - Overview
              • Tokuyama Corporation - Product / Service
              • Tokuyama Corporation - Key offerings
            • 14.32 SunEdison
              • SunEdison - Overview
              • SunEdison - Product / Service
              • SunEdison - Key offerings
            • 14.33 Asia Silicon (Qinghai) Co. Ltd.
              • Asia Silicon (Qinghai) Co. Ltd. - Overview
              • Asia Silicon (Qinghai) Co. Ltd. - Product / Service
              • Asia Silicon (Qinghai) Co. Ltd. - Key offerings
            • 14.34 Yongxiang Polysilicon
              • Yongxiang Polysilicon - Overview
              • Yongxiang Polysilicon - Product / Service
              • Yongxiang Polysilicon - Key offerings
            • 14.35 East Hope Group
              • East Hope Group - Overview
              • East Hope Group - Product / Service
              • East Hope Group - Key offerings
            • 14.36 Shin-Etsu Chemical Co. Ltd.
              • Shin-Etsu Chemical Co. Ltd. - Overview
              • Shin-Etsu Chemical Co. Ltd. - Product / Service
              • Shin-Etsu Chemical Co. Ltd. - Key offerings
            • 14.37 LDK Solar
              • LDK Solar - Overview
              • LDK Solar - Product / Service
              • LDK Solar - Key offerings
            • 14.38 TBEA Co. Ltd.
              • TBEA Co. Ltd. - Overview
              • TBEA Co. Ltd. - Product / Service
              • TBEA Co. Ltd. - Key offerings
            • 14.39 Mitsubishi Materials Corporation
              • Mitsubishi Materials Corporation - Overview
              • Mitsubishi Materials Corporation - Product / Service
              • Mitsubishi Materials Corporation - Key offerings
            • 14.40 Osaka Titanium Technologies
              • Osaka Titanium Technologies - Overview
              • Osaka Titanium Technologies - Product / Service
              • Osaka Titanium Technologies - Key offerings
            • 14.41 Qatar Solar Technologies
              • Qatar Solar Technologies - Overview
              • Qatar Solar Technologies - Product / Service
              • Qatar Solar Technologies - Key offerings
            • 14.42 Hankook Silicon Co. Ltd.
              • Hankook Silicon Co. Ltd. - Overview
              • Hankook Silicon Co. Ltd. - Product / Service
              • Hankook Silicon Co. Ltd. - Key offerings

            15 Appendix

            • 15.1 Scope of the report
              • 15.2 Inclusions and exclusions checklist
                • Inclusions checklist
                • Exclusions checklist
              • 15.3 Currency conversion rates for US$
                • Currency conversion rates for US$
              • 15.4 Research methodology
                • Research methodology
              • 15.5 Data procurement
                • Information sources
              • 15.6 Data validation
                • Data validation
              • 15.7 Validation techniques employed for market sizing
                • Validation techniques employed for market sizing
              • 15.8 Data synthesis
                • Data synthesis
              • 15.9 360 degree market analysis
                • 360 degree market analysis
              • 15.10 List of abbreviations
                • List of abbreviations

              Research Methodology

              Technavio presents a detailed picture of the market by way of study, synthesis, and summation of data from multiple sources. The analysts have presented the various facets of the market with a particular focus on identifying the key industry influencers. The data thus presented is comprehensive, reliable, and the result of extensive research, both primary and secondary.

              INFORMATION SOURCES

              Primary sources

              • Manufacturers and suppliers
              • Channel partners
              • Industry experts
              • Strategic decision makers

              Secondary sources

              • Industry journals and periodicals
              • Government data
              • Financial reports of key industry players
              • Historical data
              • Press releases

              DATA ANALYSIS

              Data Synthesis

              • Collation of data
              • Estimation of key figures
              • Analysis of derived insights

              Data Validation

              • Triangulation with data models
              • Reference against proprietary databases
              • Corroboration with industry experts

              REPORT WRITING

              Qualitative

              • Market drivers
              • Market challenges
              • Market trends
              • Five forces analysis

              Quantitative

              • Market size and forecast
              • Market segmentation
              • Geographical insights
              • Competitive landscape

              Interested in this report?

              Get your sample now to see our research methodology and insights!

              Download Now

              Frequently Asked Questions

              Polysilicon market growth will increase by $ 14252 mn during 2024-2028 .

              The Polysilicon market is expected to grow at a CAGR of 16.83% during 2024-2028 .

              Polysilicon market is segmented by Application( Photovoltaics, Electronics) Type( Wafers or chips, Chunks, Rods)

              Asia Silicon (Qinghai) Co. Ltd., Daqo New Energy Corp., East Hope Group, GCL-Poly Energy Holdings, Hankook Silicon Co. Ltd., Hemlock Semiconductor, LDK Solar, Mitsubishi Materials Corporation, OCI Company Ltd., Osaka Titanium Technologies, Qatar Solar Technologies, REC Silicon ASA, Shin-Etsu Chemical Co. Ltd., SunEdison, TBEA Co. Ltd., Tokuyama Corporation, Tongwei Group, Wacker Chemie AG, Xinte Energy Co. Ltd., Yongxiang Polysilicon are a few of the key vendors in the Polysilicon market.

              APAC will register the highest growth rate of 56% among the other regions. Therefore, the Polysilicon market in APAC is expected to garner significant business opportunities for the vendors during the forecast period.

              US, Canada, Germany, UK, Italy, France, China, India, Japan, Brazil, Egypt, UAE, Oman, Argentina, KSA, UAE, Brazil, Rest of World (ROW)

              • Rise in solar PV installationsGlobally is the driving factor this market.
              • solar PV installations have undergone a significant rise over the last few years due to the decline in the cost of solar PV components and systems. Solar energy has become less costly than most fossil fuel-powered generators and has become one of the least expensive options for electricity generation. This allows countries to expand their installed capacity for solar power at a faster rate than other renewables. According to the International Energy Agency (IEA) is the driving factor this market.
              • solar PV installations are set to jump by 30% in China and the US in the coming years is the driving factor this market.
              • as developers would rush to complete projects before changes in policies take effect. Many solar projects are operational or are under construction across the world. In September 2022 is the driving factor this market.
              • Saudi Arabia announced the beginning of five new renewable energy projects is the driving factor this market.
              • which include three solar and two wind projects. These National Renewable Energy Program (NREP)-related projects will have a combined capacity of 3 is the driving factor this market.
              • 300 megawatts of power. Such factors are expected to drive the growth of the global polysilicon market during the forecast period. Traditional solar PV markets such as China is the driving factor this market.
              • Europe is the driving factor this market.
              • and the US will continue to grow due to the growing demand for energy and the focus on clean and sustainable energy. China accounts for about two-thirds of global cumulative solar capacity. Spain is the driving factor this market.
              • Australia is the driving factor this market.
              • the UAE is the driving factor this market.
              • Brazil is the driving factor this market.
              • and South Korea are also expected to expand their solar power production significantly during the forecast period. The rise in solar PV installations will increase the sales of polysilicon significantly is the driving factor this market.
              • thereby driving the growth of the global polysilicon market during the forecast period. is the driving factor this market.

              The Polysilicon market vendors should focus on grabbing business opportunities from the Photovoltaics segment as it accounted for the largest market share in the base year.