Polystyrene (PS) Market Size 2026-2030
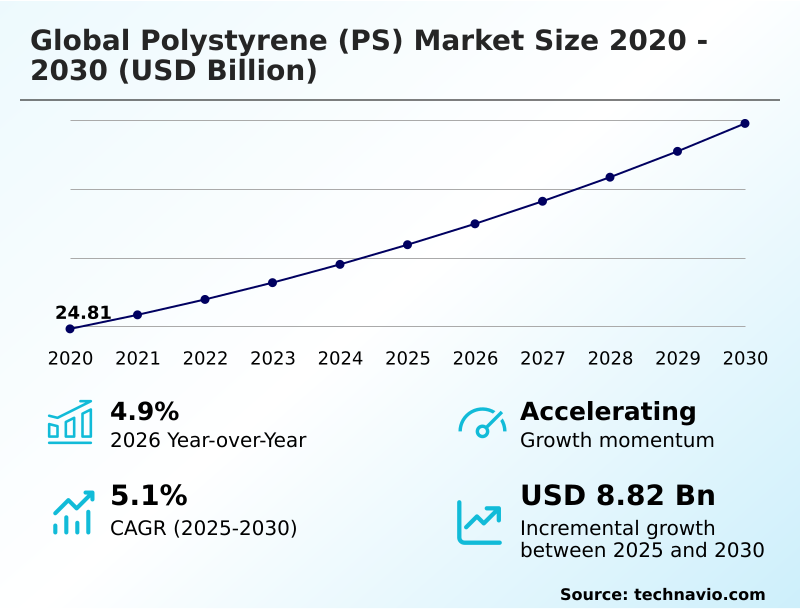
The polystyrene (ps) market size is valued to increase by USD 8.82 billion, at a CAGR of 5.1% from 2025 to 2030. Expansion of energy-efficient building infrastructures will drive the polystyrene (ps) market.
Major Market Trends & Insights
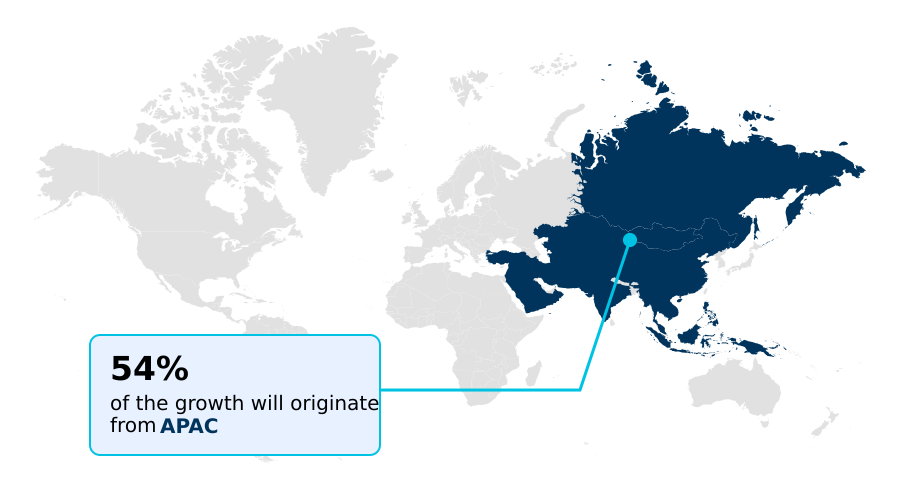
- APAC dominated the market and accounted for a 54.2% growth during the forecast period.
- By Resin Type - Expanded polystyrene (EPS) segment was valued at USD 12.67 billion in 2024
- By End-user - Packaging segment accounted for the largest market revenue share in 2024
Market Size & Forecast
- Market Opportunities: USD 14.94 billion
- Market Future Opportunities: USD 8.82 billion
- CAGR from 2025 to 2030 : 5.1%
Market Summary
- Polystyrene (PS) is a versatile synthetic aromatic hydrocarbon polymer fundamental to numerous industries. This thermoplastic material, characterized by its transparency and rigidity, is processed through methods like injection molding and extrusion into grades such as General Purpose Polystyrene (GPPS), High Impact Polystyrene (HIPS), and Expanded Polystyrene (EPS).
- The Polystyrene (PS) market is driven by sustained demand in packaging, construction, and electronics, yet it navigates a complex landscape of environmental regulations and a strategic pivot toward sustainability. For instance, a packaging converter supplying the food service industry must balance the cost-effectiveness of virgin polystyrene with increasing client mandates for recycled content.
- This requires investing in supply chains that can provide certified recycled polystyrene (rPS) created through advanced chemical recycling, ensuring compliance with food-contact regulations while meeting corporate sustainability goals without disrupting production efficiency.
- The industry's evolution is defined by this balance between traditional performance demands and the imperative for circular economy frameworks, pushing innovation in bio-attributed feedstocks and end-of-life solutions to ensure the material's long-term viability.
What will be the Size of the Polystyrene (PS) Market during the forecast period?
Get Key Insights on Market Forecast (PDF) Get Free Sample
How is the Polystyrene (PS) Market Segmented?
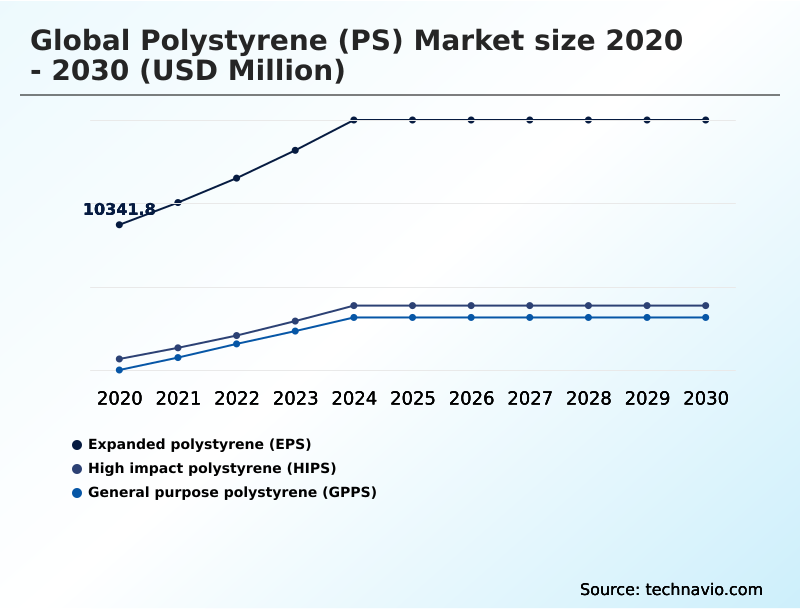
The polystyrene (ps) industry research report provides comprehensive data (region-wise segment analysis), with forecasts and estimates in "USD million" for the period 2026-2030, as well as historical data from 2020-2024 for the following segments.
- Resin type
- Expanded polystyrene (EPS)
- High impact polystyrene (HIPS)
- General purpose polystyrene (GPPS)
- End-user
- Packaging
- Electronics
- Construction
- Others
- Form factor
- Foams
- Films and sheets
- Injection molding
- Others
- Geography
- APAC
- China
- Japan
- India
- North America
- US
- Canada
- Mexico
- Europe
- Germany
- UK
- France
- South America
- Brazil
- Argentina
- Middle East and Africa
- UAE
- Saudi Arabia
- South Africa
- Rest of World (ROW)
- APAC
By Resin Type Insights
The expanded polystyrene (eps) segment is estimated to witness significant growth during the forecast period.
The expanded polystyrene (EPS) segment is defined by its unique cellular structure and superior performance in the global polystyrene (PS) market.
This rigid, closed-cell thermoplastic material is produced through a process where beads containing a blowing agent are expanded, creating a lightweight foam.
Its high compressive strength and shock-absorbing qualities make it a primary choice for protective packaging, particularly for consumer electronics and television casings. In construction, its low thermal conductivity is essential for insulation.
The ongoing evolution of this material, including biomass-balanced grades, has led to a documented 20% reduction in carbon footprint for certain insulation projects, enhancing its appeal for sustainable building and lightweight composites in engineering applications.
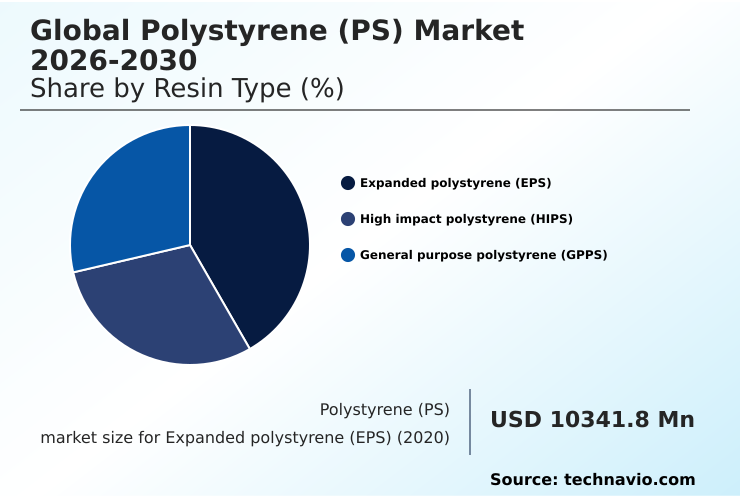
The Expanded polystyrene (EPS) segment was valued at USD 12.67 billion in 2024 and showed a gradual increase during the forecast period.
Regional Analysis
APAC is estimated to contribute 54.2% to the growth of the global market during the forecast period.Technavio’s analysts have elaborately explained the regional trends and drivers that shape the market during the forecast period.
See How Polystyrene (PS) Market Demand is Rising in APAC Get Free Sample
APAC leads the market, contributing over 54% of the incremental growth, driven by its manufacturing dominance.
The region’s robust consumer electronics and appliance sectors create immense demand for high-impact polystyrene (HIPS) and general-purpose polystyrene (GPPS), which are processed via injection molding and extrusion.
These styrenic polymers are integral to producing items such as air conditioner components and other goods. The expansion of cold chain logistics also fuels demand for insulation materials.
While regulatory landscapes are fragmented, a strategic shift is emerging, with regional producers scaling assets to serve industrialization, achieving a year-over-year growth rate approximately 1.7 percentage points higher than in North America.
This growth supports the manufacturing of automotive components and medical devices using advanced thermoforming techniques.
Market Dynamics
Our researchers analyzed the data with 2025 as the base year, along with the key drivers, trends, and challenges. A holistic analysis of drivers will help companies refine their marketing strategies to gain a competitive advantage.
- The strategic debate over polystyrene versus polypropylene in packaging continues to evolve, influenced by recycling infrastructure and material properties. For applications requiring robust thermal insulation, EPS foam for building insulation remains a cornerstone material, especially with innovations like graphite-infused EPS insulation benefits offering superior performance.
- In consumer goods, the use of HIPS in consumer electronic housings is standard due to its impact resistance and finish quality. Meanwhile, GPPS for transparent food containers offers clarity that enhances product visibility. The industry is tackling end-of-life challenges through advanced recycling of polystyrene waste, with dissolution recycling for polystyrene recovery showing promise.
- The development of bio-attributed polystyrene production methods, validated by mass balance certification for polymers, is key to reducing carbon footprint with rPS. This shift is crucial as the impact of EPR schemes on PS manufacturing and single-use plastic directive compliance intensify.
- The versatility of styrenic block copolymers and the high thermal resistance of XPS foam boards further expand applications, from polystyrene applications in automotive interiors to specialized uses like polystyrene in medical device packaging, where the chemical inertness of food-grade PS is critical.
What are the key market drivers leading to the rise in the adoption of Polystyrene (PS) Industry?
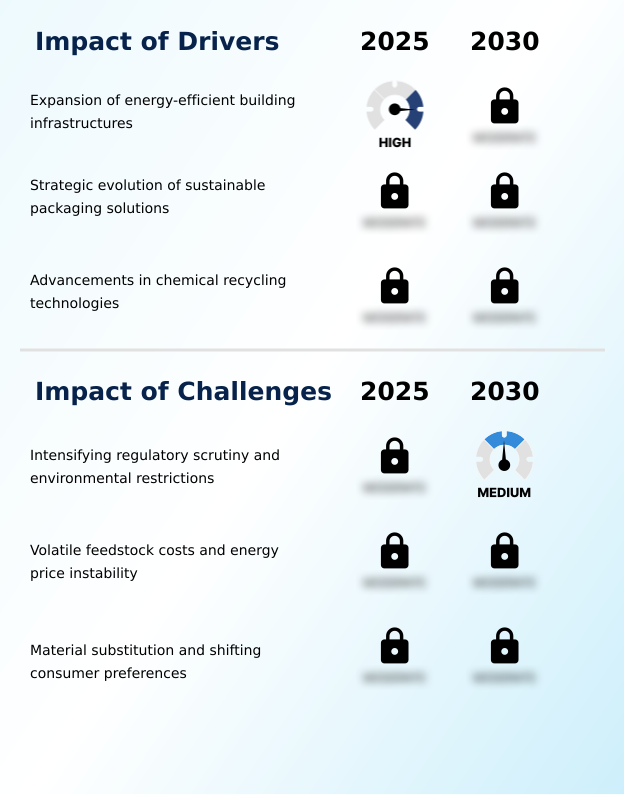
- Expansion of energy-efficient building infrastructures, driven by stringent green building codes and the pursuit of carbon neutrality targets, is a key driver for market growth.
- Demand from the construction industry is a primary market driver, propelled by mandates for energy-efficient building infrastructure. The exceptional thermal insulation properties of polystyrene foams, particularly extruded polystyrene (XPS), are critical for developing high-performance building envelopes.
- Compliance with stringent green building codes necessitates the use of materials with a high R-value in applications like external wall insulation and roofing membranes.
- The development of graphite-enhanced EPS further improves thermal performance, allowing for thinner insulation profiles in sub-floor applications.
- This focus on energy efficiency is reinforced by the need for high-performance insulation to meet global sustainability goals, driving the use of these materials in both new builds and retrofitting projects.
What are the market trends shaping the Polystyrene (PS) Industry?
- A prominent trend is the accelerating integration of bio-attributed feedstocks, which serves to decouple polymer production from its traditional dependency on fossil fuels.
- The integration of bio-attributed feedstocks represents a pivotal trend, fundamentally altering the production of styrenic polymers. Manufacturers are leveraging renewable raw materials like bionaphtha through a certified mass balance approach, enabling the creation of bio-polystyrene that is chemically identical to virgin polystyrene.
- This innovation is crucial for sustainable packaging solutions and other food-contact applications, allowing brand owners in sectors like food service items to meet carbon neutrality targets without compromising material performance. The adoption of the ISCC PLUS certification validates the sustainable content, ensuring transparency within circular economy frameworks and advancing the industry's decoupling from fossil fuel dependency.
- This shift supports the creation of materials for products ranging from disposable cutlery to clamshell containers.
What challenges does the Polystyrene (PS) Industry face during its growth?
- Intensifying regulatory scrutiny and environmental restrictions targeting single-use plastics represent a key challenge that influences industry investment and material development.
- Intensifying regulatory pressure on single-use plastics presents a significant market challenge. Legislative frameworks often target products like expandable polystyrene (EPS) used in packaging, imposing extended producer responsibility (EPR) schemes that shift waste management costs to producers. This climate of uncertainty impacts investment in traditional styrenic resins and compels a shift toward materials for durable appliances and other long-life products.
- The market is responding by accelerating investment in chemical recycling technologies, such as depolymerization and the dissolution process, to create viable circular polystyrene. These efforts aim to produce food-grade recycled polystyrene, mitigating environmental concerns and ensuring the material's future in packaging applications for items like yogurt cups and refrigerator liners.
Exclusive Technavio Analysis on Customer Landscape
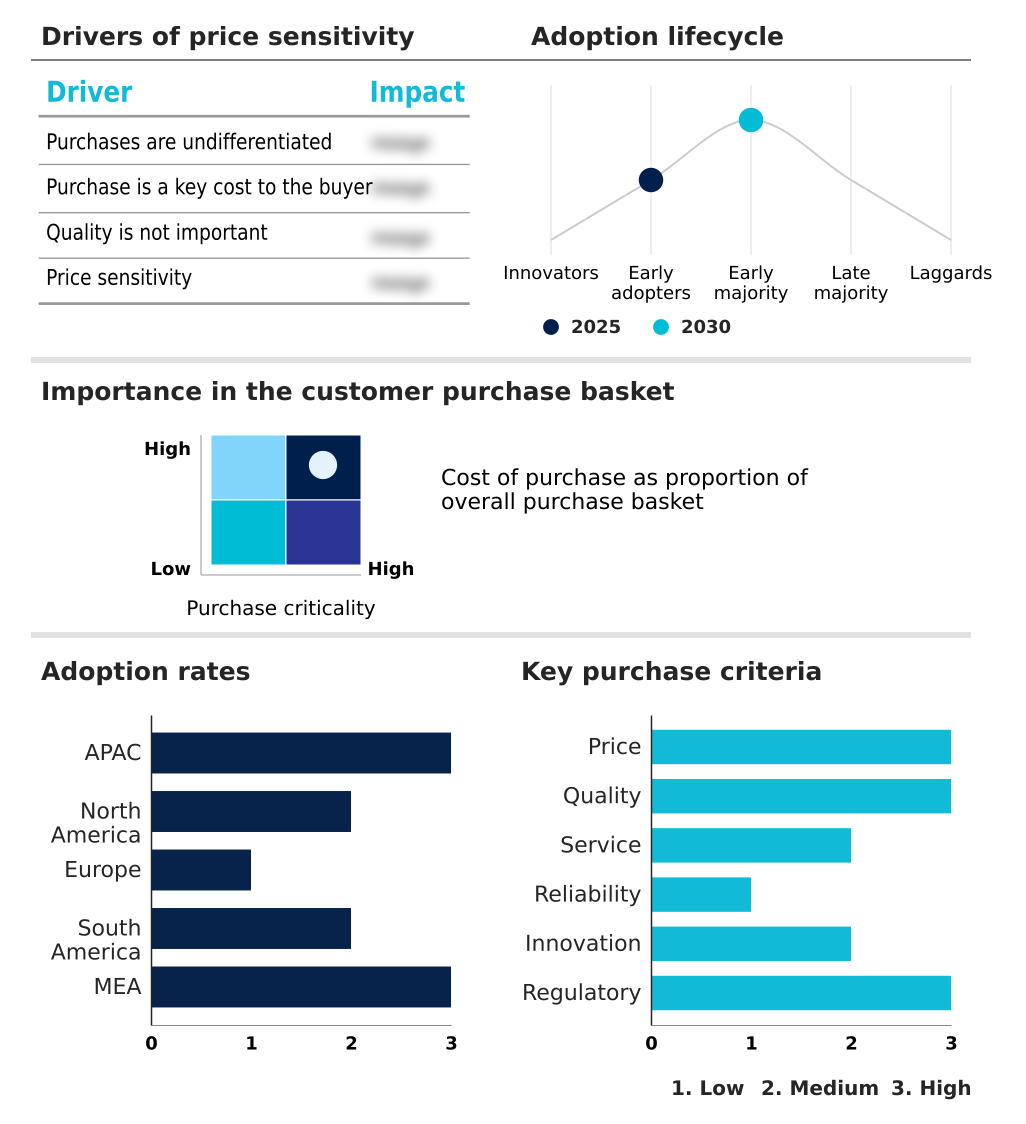
The polystyrene (ps) market forecasting report includes the adoption lifecycle of the market, covering from the innovator’s stage to the laggard’s stage. It focuses on adoption rates in different regions based on penetration. Furthermore, the polystyrene (ps) market report also includes key purchase criteria and drivers of price sensitivity to help companies evaluate and develop their market growth analysis strategies.
Customer Landscape of Polystyrene (PS) Industry
Competitive Landscape
Companies are implementing various strategies, such as strategic alliances, polystyrene (ps) market forecast, partnerships, mergers and acquisitions, geographical expansion, and product/service launches, to enhance their presence in the industry.
Alpek SAB de CV - Specialized polystyrene offerings include expandable grades for protective packaging and high-performance insulation solutions for construction and logistics applications.
The industry research and growth report includes detailed analyses of the competitive landscape of the market and information about key companies, including:
- Alpek SAB de CV
- Arkema Group
- BASF SE
- Chimei Corp.
- DuPont de Nemours Inc.
- Hanwha Group
- INEOS Styrolution Group GmbH
- Innova Electronics Corp.
- Insulfoam LLC
- Kaneka Corp.
- LG Chem Ltd.
- Lotte Chemical Corp.
- Michigan Foam Products LLC
- NOVA Chemicals Corp.
- Saudi Basic Industries
- Styrotech Inc.
- Synthos SA
- TotalEnergies SE
- Trinseo PLC
Qualitative and quantitative analysis of companies has been conducted to help clients understand the wider business environment as well as the strengths and weaknesses of key industry players. Data is qualitatively analyzed to categorize companies as pure play, category-focused, industry-focused, and diversified; it is quantitatively analyzed to categorize companies as dominant, leading, strong, tentative, and weak.
Recent Development and News in Polystyrene (ps) market
- In August, 2024, Austrotherm acquired the EPS insulation division of Brucha, a move expected to strengthen its position in the European expanded polystyrene industry.
- In October, 2024, BASF announced plans to increase its Neopor production capacity by 50,000 metric tons annually at its Ludwigshafen site to meet rising demand for graphite-infused expandable polystyrene (EPS).
- In January, 2025, Versalis, Eni's chemical subsidiary, proceeded with its industrial transformation plan in Italy, shifting from basic commodity chemicals toward specialized, bio-based, and circular polymer solutions.
- In January, 2025, the Plastics Industry Association (PLASTICS) launched the Polystyrene Recycling Alliance (PSRA) to expand recycling access and achieve widely recyclable status for polystyrene in the United States.
Dive into Technavio’s robust research methodology, blending expert interviews, extensive data synthesis, and validated models for unparalleled Polystyrene (PS) Market insights. See full methodology.
| Market Scope | |
|---|---|
| Page number | 302 |
| Base year | 2025 |
| Historic period | 2020-2024 |
| Forecast period | 2026-2030 |
| Growth momentum & CAGR | Accelerate at a CAGR of 5.1% |
| Market growth 2026-2030 | USD 8820.6 million |
| Market structure | Fragmented |
| YoY growth 2025-2026(%) | 4.9% |
| Key countries | China, Japan, India, South Korea, Australia, Indonesia, US, Canada, Mexico, Germany, UK, France, Italy, Spain, The Netherlands, Brazil, Argentina, Chile, UAE, Saudi Arabia, South Africa, Egypt and Turkey |
| Competitive landscape | Leading Companies, Market Positioning of Companies, Competitive Strategies, and Industry Risks |
Research Analyst Overview
- The Polystyrene (PS) market is undergoing a significant transformation, balancing demand for styrenic polymers with a strategic pivot towards sustainability. The core of this evolution lies in advanced production and recycling technologies. The traditional polymerization process is being augmented by innovations like the mass balance approach for incorporating bio-attributed feedstocks.
- This allows for the production of bio-polystyrene and circular polystyrene without compromising the qualities of virgin polystyrene. For end-of-life management, chemical recycling—including depolymerization and dissolution process techniques—is enabling the creation of high-quality recycled polystyrene (rPS), even achieving food-grade recycled polystyrene standards.
- In a key boardroom-level decision, companies are investing in these technologies to mitigate risks from extended producer responsibility (EPR) regulations. For instance, facilities adopting advanced sorting and purification have demonstrated the ability to process post-consumer waste into rPS with 99.9% purity, a critical metric for re-entry into high-value applications. This focus on circularity is reshaping the future of styrenic resins.
What are the Key Data Covered in this Polystyrene (PS) Market Research and Growth Report?
-
What is the expected growth of the Polystyrene (PS) Market between 2026 and 2030?
-
USD 8.82 billion, at a CAGR of 5.1%
-
-
What segmentation does the market report cover?
-
The report is segmented by Resin Type (Expanded polystyrene (EPS), High impact polystyrene (HIPS), and General purpose polystyrene (GPPS)), End-user (Packaging, Electronics, Construction, and Others), Form Factor (Foams, Films and sheets, Injection molding, and Others) and Geography (APAC, North America, Europe, South America, Middle East and Africa)
-
-
Which regions are analyzed in the report?
-
APAC, North America, Europe, South America and Middle East and Africa
-
-
What are the key growth drivers and market challenges?
-
Expansion of energy-efficient building infrastructures, Intensifying regulatory scrutiny and environmental restrictions
-
-
Who are the major players in the Polystyrene (PS) Market?
-
Alpek SAB de CV, Arkema Group, BASF SE, Chimei Corp., DuPont de Nemours Inc., Hanwha Group, INEOS Styrolution Group GmbH, Innova Electronics Corp., Insulfoam LLC, Kaneka Corp., LG Chem Ltd., Lotte Chemical Corp., Michigan Foam Products LLC, NOVA Chemicals Corp., Saudi Basic Industries, Styrotech Inc., Synthos SA, TotalEnergies SE and Trinseo PLC
-
Market Research Insights
- The market is shaped by a strategic shift towards sustainable packaging solutions and circular economy frameworks. Adoption of high-performance insulation for energy-efficient building infrastructure has improved thermal performance by up to 25% in compliant structures. In consumer electronics, manufacturers prioritizing materials for durable appliances have reduced warranty claims related to housing damage by 15%.
- This pivot is driven by the need to meet carbon neutrality targets and adhere to new green building codes. Key applications now span from food service items and protective packaging to complex automotive components and medical devices, reflecting a market adapting to both regulatory pressures and performance demands.
We can help! Our analysts can customize this polystyrene (ps) market research report to meet your requirements.
 RIA -
RIA - 
