Portable Analytical Instrument Market Analysis, Size, and Forecast 2026-2030: APAC (China, India, and Japan), North America (US, Canada, and Mexico), Europe (Germany, UK, and France), South America (Brazil, Argentina, and Colombia), Middle East and Africa (Saudi Arabia, UAE, and South Africa), Asia, Rest of World (ROW)

Portable Analytical Instrument Market Analysis, Size, and Forecast 2026-2030:
APAC (China, India, and Japan), North America (US, Canada, and Mexico), Europe (Germany, UK, and France), South America (Brazil, Argentina, and Colombia), Middle East and Africa (Saudi Arabia, UAE, and South Africa), Asia, Rest of World (ROW)

Published: Dec 2025 316 Pages SKU: IRTNTR71545

Market Overview at a Glance

$3.60 B
Market Opportunity
6%
CAGR 2025 - 2030
33.8%
Asia Growth
$5.07 B
Spectrometers segment 2024

Portable Analytical Instrument Market Size 2026-2030

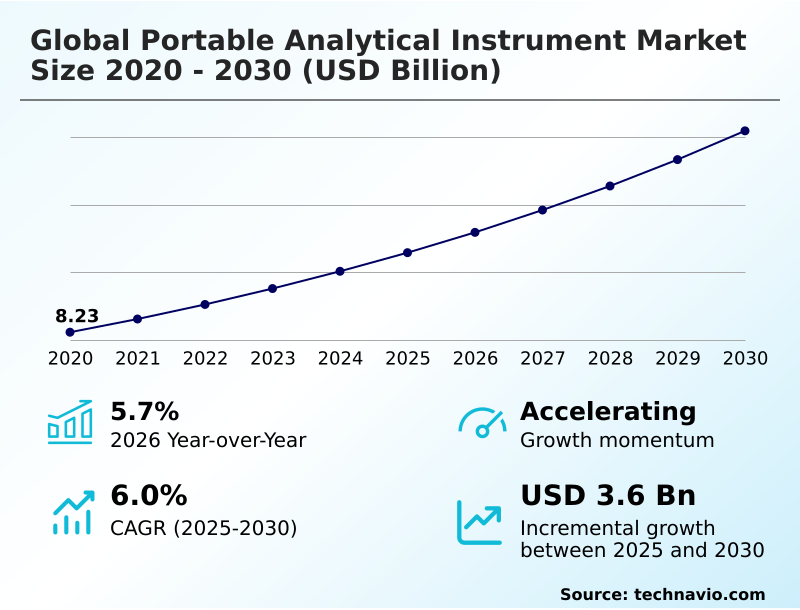
The portable analytical instrument market size is valued to increase by USD 3.60 billion, at a CAGR of 6% from 2025 to 2030. Pervasive technological advancements and instrument miniaturization will drive the portable analytical instrument market.

Major Market Trends & Insights

  • Asia dominated the market and accounted for a 33.8% growth during the forecast period.
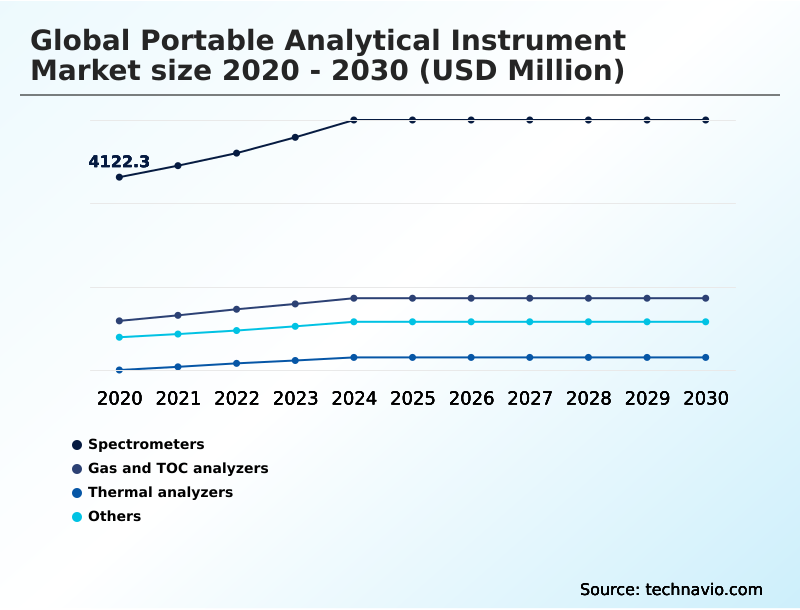
  • By Product - Spectrometers segment was valued at USD 5.07 billion in 2024
  • By End-user - Pharmaceutical and biotechnology companies segment accounted for the largest market revenue share in 2024

Market Size & Forecast

  • Market Opportunities: USD 5.95 billion
  • Market Future Opportunities: USD 3.60 billion
  • CAGR from 2025 to 2030 : 6%

Market Summary

  • The portable analytical instrument market is defined by a fundamental shift toward decentralized, point-of-need analysis, driven by relentless technological innovation and stringent regulatory pressures. The ability to gain immediate, lab-grade data in field environments is becoming an operational necessity across industries, from food safety to environmental monitoring.
  • This transition empowers organizations with greater agility for risk mitigation, quality assurance, and compliance. For instance, a pharmaceutical manufacturer can use handheld spectrometers for raw material identification directly on the loading dock, confirming authenticity in minutes rather than days.
  • This practice of on-site screening not only accelerates production cycles by enabling real-time process control with pat but also strengthens supply chain security against counterfeit materials. The integration of connected instrumentation with data logging capabilities ensures a verifiable audit trail, which is critical for meeting data integrity compliance mandates.
  • The market's trajectory is toward smarter, more autonomous devices that embed analytical intelligence directly into operational workflows, enhancing efficiency and decision-making.

What will be the Size of the Portable Analytical Instrument Market during the forecast period?

Get Key Insights on Market Forecast (PDF) Request Free Sample

How is the Portable Analytical Instrument Market Segmented?

The portable analytical instrument industry research report provides comprehensive data (region-wise segment analysis), with forecasts and estimates in "USD million" for the period 2026-2030, as well as historical data from 2020-2024 for the following segments.

  • Product
    • Spectrometers
    • Gas and TOC analyzers
    • Thermal analyzers
    • Others
  • End-user
    • Pharmaceutical and biotechnology companies
    • Food and beverage companies
    • Environmental testing organizations
    • Others
  • Technology
    • Spectroscopic analysis
    • Elemental analysis
    • Others
  • Geography
    • Asia
    • North America
      • US
      • Canada
      • Mexico
    • Europe
      • Germany
      • UK
      • France
    • Rest of World (ROW)

By Product Insights

The spectrometers segment is estimated to witness significant growth during the forecast period.

The spectrometers segment is advancing through miniaturized instrumentation, providing detailed compositional information via technologies like x-ray fluorescence and raman spectroscopy. These tools are indispensable for on-site material verification in manufacturing and environmental services, where rapid, non-destructive testing is paramount.

Enterprises using handheld spectrometers for quality control report a 20% reduction in material-related production errors. The adoption of spectral libraries and ai-driven analytics platform capabilities enhances molecular identification, moving beyond simple data collection to deliver actionable insights.

The demand for in-situ elemental analysis and spectral fingerprinting drives innovation, making these field-deployable analytical solutions essential for maintaining supply chain security and ensuring regulatory adherence across industries.

Request Free Sample

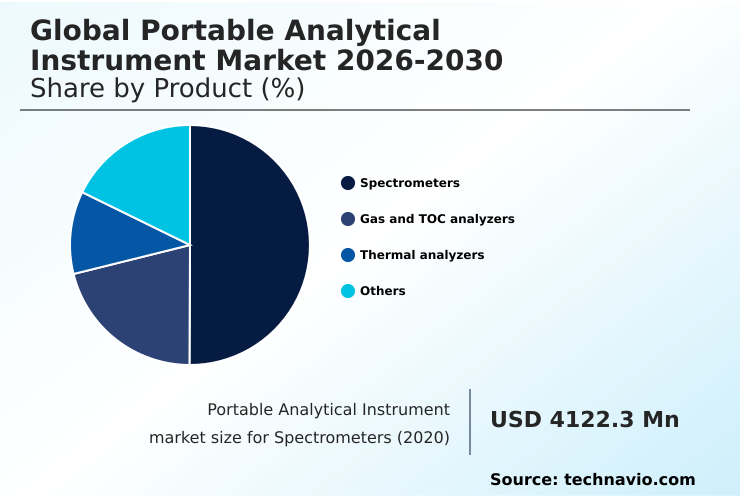
The Spectrometers segment was valued at USD 5.07 billion in 2024 and showed a gradual increase during the forecast period.

Request Free Sample

Regional Analysis

Asia is estimated to contribute 33.8% to the growth of the global market during the forecast period.Technavio’s analysts have elaborately explained the regional trends and drivers that shape the market during the forecast period.

See How Portable Analytical Instrument Market Demand is Rising in Asia Request Free Sample

The geographic landscape of the portable analytical instrument market is dynamic, with North America leading due to its mature regulatory environment and high technology adoption, growing at a 6.4% pace.

Asia is the fastest-growing region, driven by industrial expansion and new environmental mandates.

In these regions, using handheld form factors for geochemical exploration and other field-based analysis enables site characterization tasks to be completed 50% faster than methods requiring sample transport.

The deployment of portable gas chromatographs and ion-selective electrodes for on-site analysis is becoming standard practice for industrial hygiene monitoring and environmental site assessments.

This shift toward field-portable technologies underscores a global trend where immediate data access is critical for operational efficiency and regulatory compliance. Europe's market, growing at a 5.7% pace, remains a significant hub for high-value manufacturing applications.

Market Dynamics

Our researchers analyzed the data with 2025 as the base year, along with the key drivers, trends, and challenges. A holistic analysis of drivers will help companies refine their marketing strategies to gain a competitive advantage.

  • Strategic decisions in the portable analytical instrument market increasingly involve nuanced technical evaluations. The debate of xrf vs libs for elemental analysis is central for industries requiring alloy grading, where the choice impacts both speed and the ability to detect lighter elements.
  • Similarly, for pharmaceutical QC, the comparison between raman vs nir for raw material id is critical for compliance and efficiency. The growing need for pfas testing with portable mass spec highlights a key regulatory driver creating new application demands.
  • For infrastructure safety, the implementation of on-site pmi for pipeline integrity is non-negotiable, with studies showing project timelines can be reduced by more than half compared to traditional methods. Concerns over portable analytical instrument data integrity and data security in connected analytical devices are shaping purchasing criteria, especially with the rise of iot-enabled water quality monitoring.
  • Organizations are carefully choosing a handheld elemental analyzer or handheld spectrometer for counterfeit detection based on both performance and security protocols. Other key applications gaining traction include portable gc-ms for environmental monitoring and portable dsc for plastic recycling.
  • As businesses weigh the cost of portable analytical instruments against the lab vs portable instrument accuracy, the focus is shifting toward real-time process control with pat, field analysis for precision agriculture, and using ftir for polymer identification or nir analysis for food quality, ensuring a clear return on investment.

What are the key market drivers leading to the rise in the adoption of Portable Analytical Instrument Industry?

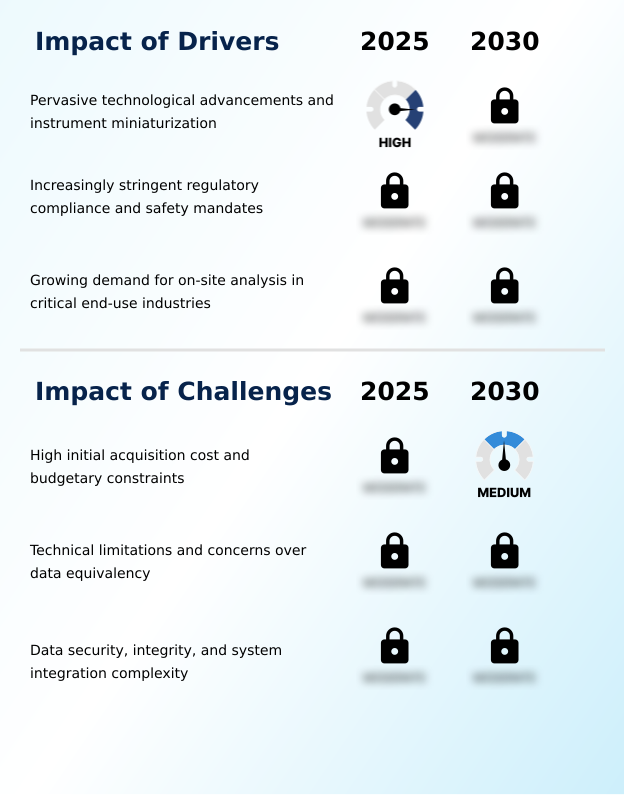
  • Pervasive technological advancements and ongoing instrument miniaturization are key drivers propelling market expansion.

  • The market is propelled by relentless technological innovation and the miniaturization of complex technologies like portable mass spectrometers and handheld xrf analyzers.
  • These advancements enable on-site analysis, which can reduce decision-making cycles by over 80% in critical processes like raw material identification.
  • Another major driver is the tightening of regulatory mandates, which now cover an additional 15% of industrial chemicals, compelling industries to adopt field-based analysis for compliance.
  • The growing demand for immediate data in key sectors fuels the need for point-of-use testing. For example, using handheld libs analyzer technology for on-site pmi in manufacturing ensures asset integrity management, preventing costly failures and strengthening supply chain security.

What are the market trends shaping the Portable Analytical Instrument Industry?

  • The ascendancy of connected instrumentation and the emergence of data-as-a-service models represent a transformative trend. This evolution is reshaping the value proposition of portable analysis.

  • A dominant trend is the rise of connected instrumentation, moving devices from isolated tools to intelligent nodes in a digital ecosystem. This shift, enabling real-time data transmission and fleet-wide oversight, allows organizations to reduce instrument downtime by up to 25% through predictive maintenance alerts from remote diagnostics. Concurrently, the proliferation of purpose-built instruments and user-centric devices is democratizing analysis.
  • These application-specific devices, featuring guided workflows, can decrease new operator training time by 40%. The convergence of analytical techniques in multi-modal instruments, leveraging sensor fusion, provides more comprehensive data for complex applications like geochemical exploration, enhancing analytical confidence. This evolution is also catalyzing new data-as-a-service business models, lowering adoption barriers.

What challenges does the Portable Analytical Instrument Industry face during its growth?

  • The high initial acquisition cost of advanced instruments and persistent budgetary constraints present a key challenge affecting industry growth.

  • A primary challenge is the high initial acquisition cost, which can delay the adoption of technologies like handheld raman spectrometer systems by up to 24 months for smaller enterprises, despite clear ROI benefits.
  • Technical limitations persist, as the accuracy of some portable devices may not match benchtop counterparts for ultra-low detection limits, necessitating a two-step verification process that diminishes the value of immediate results. Furthermore, the complexity of data management and cybersecurity for iot-enabled water quality monitoring systems is a growing concern.
  • The lack of standardized communication protocols can add 30% to the total cost of ownership due to the need for custom integration with existing enterprise systems, posing a significant hurdle to achieving seamless process analytical technology.

Exclusive Technavio Analysis on Customer Landscape

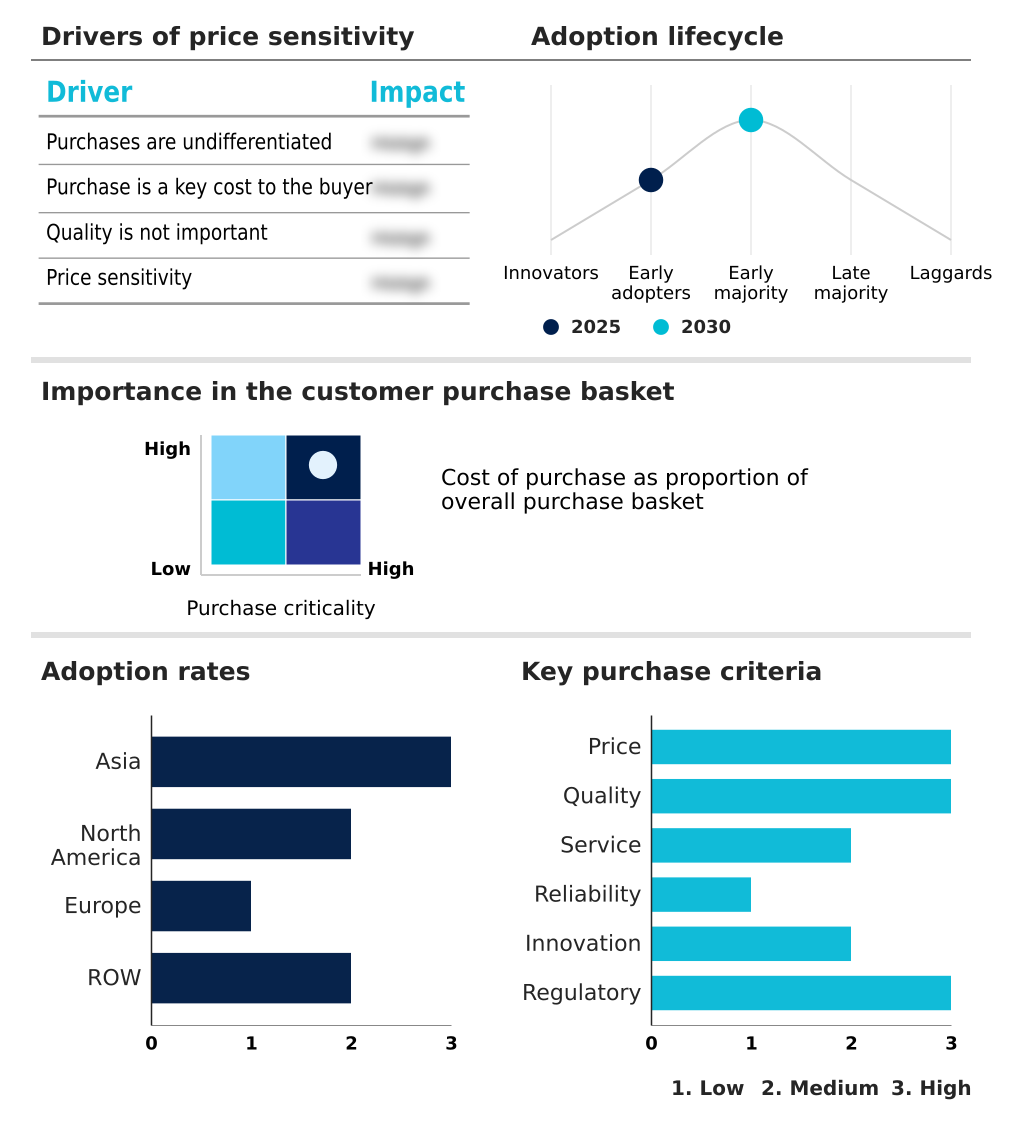
The portable analytical instrument market forecasting report includes the adoption lifecycle of the market, covering from the innovator’s stage to the laggard’s stage. It focuses on adoption rates in different regions based on penetration. Furthermore, the portable analytical instrument market report also includes key purchase criteria and drivers of price sensitivity to help companies evaluate and develop their market growth analysis strategies.

Customer Landscape of Portable Analytical Instrument Industry

Competitive Landscape

Companies are implementing various strategies, such as strategic alliances, portable analytical instrument market forecast, partnerships, mergers and acquisitions, geographical expansion, and product/service launches, to enhance their presence in the industry.

Agilent Technologies Inc. - The company delivers application-focused solutions, including instruments and software, to identify, quantify, and analyze the physical and biological properties of substances and products.

The industry research and growth report includes detailed analyses of the competitive landscape of the market and information about key companies, including:

  • Agilent Technologies Inc.
  • Bio Rad Laboratories Inc.
  • Bruker Corp.
  • Danaher Corp.
  • Eppendorf SE
  • F. Hoffmann La Roche Ltd.
  • Hitachi Ltd.
  • HORIBA Ltd.
  • JASCO International Co. Ltd.
  • JEOL Ltd.
  • Metrohm AG
  • METTLER TOLEDO
  • PerkinElmer US LLC
  • Rigaku Corp.
  • Rudolph Research Analytical
  • Shimadzu Corp.
  • Spectris plc
  • Teledyne Technologies Inc.
  • Thermo Fisher Scientific Inc.
  • Waters Corp.

Qualitative and quantitative analysis of companies has been conducted to help clients understand the wider business environment as well as the strengths and weaknesses of key industry players. Data is qualitatively analyzed to categorize companies as pure play, category-focused, industry-focused, and diversified; it is quantitatively analyzed to categorize companies as dominant, leading, strong, tentative, and weak.

Recent Development and News in Portable analytical instrument market

  • In August 2025, Thermo Fisher Scientific announced the launch of a new generation of portable mass spectrometers incorporating an AI-driven analytics platform for real-time spectral analysis and compound identification in the field.
  • In May 2025, the United States Environmental Protection Agency created significant demand for on-site testing capabilities by announcing an expansion of its regulations concerning per- and polyfluoroalkyl substances (PFAS), establishing new, lower maximum contaminant levels in drinking water.
  • In October 2025, a consortium of major European pharmaceutical companies, in partnership with INTERPOL, initiated the full-scale deployment of handheld Raman and near-infrared spectrometers to customs officials in Africa and Southeast Asia for an anti-counterfeiting initiative.
  • In April 2025, San Jose Water announced a six-month delay in deploying its network of IoT-enabled portable water quality analyzers after cybersecurity auditors discovered a critical firmware vulnerability, highlighting data security challenges in connected devices.

Dive into Technavio’s robust research methodology, blending expert interviews, extensive data synthesis, and validated models for unparalleled Portable Analytical Instrument Market insights. See full methodology.

Market Scope
Page number 316
Base year 2025
Historic period 2020-2024
Forecast period 2026-2030
Growth momentum & CAGR Accelerate at a CAGR of 6%
Market growth 2026-2030 USD 3604.2 million
Market structure Fragmented
YoY growth 2025-2026(%) 5.7%
Key countries China, India, Japan, South Korea, Thailand, Indonesia, US, Canada, Mexico, Germany, UK, France, Italy, The Netherlands, Spain, Brazil, Argentina, Colombia, Saudi Arabia, UAE, South Africa, Israel and Turkey
Competitive landscape Leading Companies, Market Positioning of Companies, Competitive Strategies, and Industry Risks

Request Free Sample

Research Analyst Overview

  • The portable analytical instrument market's evolution is anchored in continuous innovation, enabling a paradigm shift from centralized labs to point-of-need analysis. Core technologies such as handheld spectrometers, electrochemical sensors, and portable mass spectrometers are becoming smaller and more powerful, integrating advanced features like ai-driven analytics platform capabilities.
  • This trend toward miniaturized instrumentation is not just about convenience; it's about embedding analytical intelligence directly into workflows. The development of multi-modal instruments and user-centric devices is expanding applications into new domains, while connected instrumentation allows for unprecedented remote diagnostics and data management.
  • For boardroom consideration, the investment in devices with robust data logging capabilities directly addresses heightened data integrity compliance, with some firms reporting a 30% reduction in audit preparation time.
  • As technologies like fourier transform infrared spectroscopy and differential scanning calorimetry become available in handheld form factors, industries are rethinking their entire quality control and safety protocols, making these tools central to modern operational strategy.

What are the Key Data Covered in this Portable Analytical Instrument Market Research and Growth Report?

  • What is the expected growth of the Portable Analytical Instrument Market between 2026 and 2030?

    • USD 3.60 billion, at a CAGR of 6%

  • What segmentation does the market report cover?

    • The report is segmented by Product (Spectrometers, Gas and TOC analyzers, Thermal analyzers, and Others), End-user (Pharmaceutical and biotechnology companies, Food and beverage companies, Environmental testing organizations, and Others), Technology (Spectroscopic analysis, and Elemental analysis, and Others) and Geography (Asia, North America, Europe, Rest of World (ROW))

  • Which regions are analyzed in the report?

    • Asia, North America, Europe and Rest of World (ROW)

  • What are the key growth drivers and market challenges?

    • Pervasive technological advancements and instrument miniaturization, High initial acquisition cost and budgetary constraints

  • Who are the major players in the Portable Analytical Instrument Market?

    • Agilent Technologies Inc., Bio Rad Laboratories Inc., Bruker Corp., Danaher Corp., Eppendorf SE, F. Hoffmann La Roche Ltd., Hitachi Ltd., HORIBA Ltd., JASCO International Co. Ltd., JEOL Ltd., Metrohm AG, METTLER TOLEDO, PerkinElmer US LLC, Rigaku Corp., Rudolph Research Analytical, Shimadzu Corp., Spectris plc, Teledyne Technologies Inc., Thermo Fisher Scientific Inc. and Waters Corp.

Market Research Insights

  • The dynamics of the portable analytical instrument market are increasingly shaped by the demand for mobile analytical capabilities that deliver immediate, actionable intelligence. The adoption of field-portable technologies allows for decentralized testing, which has been shown to reduce material verification times by up to 90% compared to traditional off-site lab methods.
  • This efficiency gain directly enhances asset integrity management and accelerates quality management maturity programs. Furthermore, the use of application-specific devices for tasks such as food authenticity testing improves compliance documentation accuracy, leading to a 40% reduction in audit-related queries.
  • This focus on verifiable, on-site data generation is crucial as industries navigate complex global supply chains and heightened regulatory scrutiny, making point-of-use testing a cornerstone of modern operational strategy.

We can help! Our analysts can customize this portable analytical instrument market research report to meet your requirements.

Get in touch

1. Executive Summary

1.1 Market overview

Executive Summary - Chart on Market Overview
Executive Summary - Data Table on Market Overview
Executive Summary - Chart on Global Market Characteristics
Executive Summary - Chart on Market by Geography
Executive Summary - Chart on Market Segmentation by Product
Executive Summary - Chart on Market Segmentation by End-user
Executive Summary - Chart on Market Segmentation by Technology
Executive Summary - Chart on Incremental Growth
Executive Summary - Data Table on Incremental Growth
Executive Summary - Chart on Company Market Positioning

2. Technavio Analysis

2.1 Analysis of price sensitivity, lifecycle, customer purchase basket, adoption rates, and purchase criteria

2.2 Criticality of inputs and Factors of differentiation

Chart on Overview on criticality of inputs and factors of differentiation

2.3 Factors of disruption

Chart on Overview on factors of disruption

2.4 Impact of drivers and challenges

Chart on Impact of drivers and challenges in 2025 and 2030

3. Market Landscape

3.1 Market ecosystem

Chart on Parent Market
Data Table on - Parent Market

3.2 Market characteristics

Chart on Market characteristics analysis

3.3 Value chain analysis

Chart on Value chain analysis

4. Market Sizing

4.1 Market definition

Data Table on Offerings of companies included in the market definition

4.2 Market segment analysis

Market segments

4.3 Market size 2025

4.4 Market outlook: Forecast for 2025-2030

Chart on Global - Market size and forecast 2025-2030 ($ million)
Data Table on Global - Market size and forecast 2025-2030 ($ million)
Chart on Global Market: Year-over-year growth 2025-2030 (%)
Data Table on Global Market: Year-over-year growth 2025-2030 (%)

5. Historic Market Size

5.1 Global Portable Analytical Instrument Market 2020 - 2024

Historic Market Size - Data Table on Global Portable Analytical Instrument Market 2020 - 2024 ($ million)

5.2 Product segment analysis 2020 - 2024

Historic Market Size - Product Segment 2020 - 2024 ($ million)

5.3 End-user segment analysis 2020 - 2024

Historic Market Size - End-user Segment 2020 - 2024 ($ million)

5.4 Technology segment analysis 2020 - 2024

Historic Market Size - Technology Segment 2020 - 2024 ($ million)

5.5 Geography segment analysis 2020 - 2024

Historic Market Size - Geography Segment 2020 - 2024 ($ million)

5.6 Country segment analysis 2020 - 2024

Historic Market Size - Country Segment 2020 - 2024 ($ million)

6. Qualitative Analysis

6.1 The AI impact on global portable analytical instrument market

7. Five Forces Analysis

7.1 Five forces summary

Five forces analysis - Comparison between 2025 and 2030

7.2 Bargaining power of buyers

Bargaining power of buyers - Impact of key factors 2025 and 2030

7.3 Bargaining power of suppliers

Bargaining power of suppliers - Impact of key factors in 2025 and 2030

7.4 Threat of new entrants

Threat of new entrants - Impact of key factors in 2025 and 2030

7.5 Threat of substitutes

Threat of substitutes - Impact of key factors in 2025 and 2030

7.6 Threat of rivalry

Threat of rivalry - Impact of key factors in 2025 and 2030

7.7 Market condition

Chart on Market condition - Five forces 2025 and 2030

8. Market Segmentation by Product

8.1 Market segments

Chart on Product - Market share 2025-2030 (%)
Data Table on Product - Market share 2025-2030 (%)

8.2 Comparison by Product

Chart on Comparison by Product
Data Table on Comparison by Product

8.3 Spectrometers - Market size and forecast 2025-2030

Chart on Spectrometers - Market size and forecast 2025-2030 ($ million)
Data Table on Spectrometers - Market size and forecast 2025-2030 ($ million)
Chart on Spectrometers - Year-over-year growth 2025-2030 (%)
Data Table on Spectrometers - Year-over-year growth 2025-2030 (%)

8.4 Gas and TOC analyzers - Market size and forecast 2025-2030

Chart on Gas and TOC analyzers - Market size and forecast 2025-2030 ($ million)
Data Table on Gas and TOC analyzers - Market size and forecast 2025-2030 ($ million)
Chart on Gas and TOC analyzers - Year-over-year growth 2025-2030 (%)
Data Table on Gas and TOC analyzers - Year-over-year growth 2025-2030 (%)

8.5 Thermal analyzers - Market size and forecast 2025-2030

Chart on Thermal analyzers - Market size and forecast 2025-2030 ($ million)
Data Table on Thermal analyzers - Market size and forecast 2025-2030 ($ million)
Chart on Thermal analyzers - Year-over-year growth 2025-2030 (%)
Data Table on Thermal analyzers - Year-over-year growth 2025-2030 (%)

8.6 Others - Market size and forecast 2025-2030

Chart on Others - Market size and forecast 2025-2030 ($ million)
Data Table on Others - Market size and forecast 2025-2030 ($ million)
Chart on Others - Year-over-year growth 2025-2030 (%)
Data Table on Others - Year-over-year growth 2025-2030 (%)

8.7 Market opportunity by Product

Market opportunity by Product ($ million)
Data Table on Market opportunity by Product ($ million)

9. Market Segmentation by End-user

9.1 Market segments

Chart on End-user - Market share 2025-2030 (%)
Data Table on End-user - Market share 2025-2030 (%)

9.2 Comparison by End-user

Chart on Comparison by End-user
Data Table on Comparison by End-user

9.3 Pharmaceutical and biotechnology companies - Market size and forecast 2025-2030

Chart on Pharmaceutical and biotechnology companies - Market size and forecast 2025-2030 ($ million)
Data Table on Pharmaceutical and biotechnology companies - Market size and forecast 2025-2030 ($ million)
Chart on Pharmaceutical and biotechnology companies - Year-over-year growth 2025-2030 (%)
Data Table on Pharmaceutical and biotechnology companies - Year-over-year growth 2025-2030 (%)

9.4 Food and beverage companies - Market size and forecast 2025-2030

Chart on Food and beverage companies - Market size and forecast 2025-2030 ($ million)
Data Table on Food and beverage companies - Market size and forecast 2025-2030 ($ million)
Chart on Food and beverage companies - Year-over-year growth 2025-2030 (%)
Data Table on Food and beverage companies - Year-over-year growth 2025-2030 (%)

9.5 Environmental testing organizations - Market size and forecast 2025-2030

Chart on Environmental testing organizations - Market size and forecast 2025-2030 ($ million)
Data Table on Environmental testing organizations - Market size and forecast 2025-2030 ($ million)
Chart on Environmental testing organizations - Year-over-year growth 2025-2030 (%)
Data Table on Environmental testing organizations - Year-over-year growth 2025-2030 (%)

9.6 Others - Market size and forecast 2025-2030

Chart on Others - Market size and forecast 2025-2030 ($ million)
Data Table on Others - Market size and forecast 2025-2030 ($ million)
Chart on Others - Year-over-year growth 2025-2030 (%)
Data Table on Others - Year-over-year growth 2025-2030 (%)

9.7 Market opportunity by End-user

Market opportunity by End-user ($ million)
Data Table on Market opportunity by End-user ($ million)

10. Market Segmentation by Technology

10.1 Market segments

Chart on Technology - Market share 2025-2030 (%)
Data Table on Technology - Market share 2025-2030 (%)

10.2 Comparison by Technology

Chart on Comparison by Technology
Data Table on Comparison by Technology

10.3 Spectroscopic analysis - Market size and forecast 2025-2030

Chart on Spectroscopic analysis - Market size and forecast 2025-2030 ($ million)
Data Table on Spectroscopic analysis - Market size and forecast 2025-2030 ($ million)
Chart on Spectroscopic analysis - Year-over-year growth 2025-2030 (%)
Data Table on Spectroscopic analysis - Year-over-year growth 2025-2030 (%)

10.4 Elemental analysis - Market size and forecast 2025-2030

Chart on Elemental analysis - Market size and forecast 2025-2030 ($ million)
Data Table on Elemental analysis - Market size and forecast 2025-2030 ($ million)
Chart on Elemental analysis - Year-over-year growth 2025-2030 (%)
Data Table on Elemental analysis - Year-over-year growth 2025-2030 (%)

10.5 Others - Market size and forecast 2025-2030

Chart on Others - Market size and forecast 2025-2030 ($ million)
Data Table on Others - Market size and forecast 2025-2030 ($ million)
Chart on Others - Year-over-year growth 2025-2030 (%)
Data Table on Others - Year-over-year growth 2025-2030 (%)

10.6 Market opportunity by Technology

Market opportunity by Technology ($ million)
Data Table on Market opportunity by Technology ($ million)

11. Customer Landscape

11.1 Customer landscape overview

Analysis of price sensitivity, lifecycle, customer purchase basket, adoption rates, and purchase criteria

12. Geographic Landscape

12.1 Geographic segmentation

Chart on Market share by geography 2025-2030 (%)
Data Table on Market share by geography 2025-2030 (%)

12.2 Geographic comparison

Chart on Geographic comparison
Data Table on Geographic comparison

12.3 Asia - Market size and forecast 2025-2030

Chart on Asia - Market size and forecast 2025-2030 ($ million)
Data Table on Asia - Market size and forecast 2025-2030 ($ million)
Chart on Asia - Year-over-year growth 2025-2030 (%)
Data Table on Asia - Year-over-year growth 2025-2030 (%)
Chart on Regional Comparison - Asia
Data Table on Regional Comparison - Asia

12.3.1 China - Market size and forecast 2025-2030

Chart on China - Market size and forecast 2025-2030 ($ million)
Data Table on China - Market size and forecast 2025-2030 ($ million)
Chart on China - Year-over-year growth 2025-2030 (%)
Data Table on China - Year-over-year growth 2025-2030 (%)

12.3.2 India - Market size and forecast 2025-2030

Chart on India - Market size and forecast 2025-2030 ($ million)
Data Table on India - Market size and forecast 2025-2030 ($ million)
Chart on India - Year-over-year growth 2025-2030 (%)
Data Table on India - Year-over-year growth 2025-2030 (%)

12.3.3 Japan - Market size and forecast 2025-2030

Chart on Japan - Market size and forecast 2025-2030 ($ million)
Data Table on Japan - Market size and forecast 2025-2030 ($ million)
Chart on Japan - Year-over-year growth 2025-2030 (%)
Data Table on Japan - Year-over-year growth 2025-2030 (%)

12.3.4 South Korea - Market size and forecast 2025-2030

Chart on South Korea - Market size and forecast 2025-2030 ($ million)
Data Table on South Korea - Market size and forecast 2025-2030 ($ million)
Chart on South Korea - Year-over-year growth 2025-2030 (%)
Data Table on South Korea - Year-over-year growth 2025-2030 (%)

12.3.5 Thailand - Market size and forecast 2025-2030

Chart on Thailand - Market size and forecast 2025-2030 ($ million)
Data Table on Thailand - Market size and forecast 2025-2030 ($ million)
Chart on Thailand - Year-over-year growth 2025-2030 (%)
Data Table on Thailand - Year-over-year growth 2025-2030 (%)

12.3.6 Indonesia - Market size and forecast 2025-2030

Chart on Indonesia - Market size and forecast 2025-2030 ($ million)
Data Table on Indonesia - Market size and forecast 2025-2030 ($ million)
Chart on Indonesia - Year-over-year growth 2025-2030 (%)
Data Table on Indonesia - Year-over-year growth 2025-2030 (%)

12.4 North America - Market size and forecast 2025-2030

Chart on North America - Market size and forecast 2025-2030 ($ million)
Data Table on North America - Market size and forecast 2025-2030 ($ million)
Chart on North America - Year-over-year growth 2025-2030 (%)
Data Table on North America - Year-over-year growth 2025-2030 (%)
Chart on Regional Comparison - North America
Data Table on Regional Comparison - North America

12.4.1 US - Market size and forecast 2025-2030

Chart on US - Market size and forecast 2025-2030 ($ million)
Data Table on US - Market size and forecast 2025-2030 ($ million)
Chart on US - Year-over-year growth 2025-2030 (%)
Data Table on US - Year-over-year growth 2025-2030 (%)

12.4.2 Canada - Market size and forecast 2025-2030

Chart on Canada - Market size and forecast 2025-2030 ($ million)
Data Table on Canada - Market size and forecast 2025-2030 ($ million)
Chart on Canada - Year-over-year growth 2025-2030 (%)
Data Table on Canada - Year-over-year growth 2025-2030 (%)

12.4.3 Mexico - Market size and forecast 2025-2030

Chart on Mexico - Market size and forecast 2025-2030 ($ million)
Data Table on Mexico - Market size and forecast 2025-2030 ($ million)
Chart on Mexico - Year-over-year growth 2025-2030 (%)
Data Table on Mexico - Year-over-year growth 2025-2030 (%)

12.5 Europe - Market size and forecast 2025-2030

Chart on Europe - Market size and forecast 2025-2030 ($ million)
Data Table on Europe - Market size and forecast 2025-2030 ($ million)
Chart on Europe - Year-over-year growth 2025-2030 (%)
Data Table on Europe - Year-over-year growth 2025-2030 (%)
Chart on Regional Comparison - Europe
Data Table on Regional Comparison - Europe

12.5.1 Germany - Market size and forecast 2025-2030

Chart on Germany - Market size and forecast 2025-2030 ($ million)
Data Table on Germany - Market size and forecast 2025-2030 ($ million)
Chart on Germany - Year-over-year growth 2025-2030 (%)
Data Table on Germany - Year-over-year growth 2025-2030 (%)

12.5.2 UK - Market size and forecast 2025-2030

Chart on UK - Market size and forecast 2025-2030 ($ million)
Data Table on UK - Market size and forecast 2025-2030 ($ million)
Chart on UK - Year-over-year growth 2025-2030 (%)
Data Table on UK - Year-over-year growth 2025-2030 (%)

12.5.3 France - Market size and forecast 2025-2030

Chart on France - Market size and forecast 2025-2030 ($ million)
Data Table on France - Market size and forecast 2025-2030 ($ million)
Chart on France - Year-over-year growth 2025-2030 (%)
Data Table on France - Year-over-year growth 2025-2030 (%)

12.5.4 Italy - Market size and forecast 2025-2030

Chart on Italy - Market size and forecast 2025-2030 ($ million)
Data Table on Italy - Market size and forecast 2025-2030 ($ million)
Chart on Italy - Year-over-year growth 2025-2030 (%)
Data Table on Italy - Year-over-year growth 2025-2030 (%)

12.5.5 The Netherlands - Market size and forecast 2025-2030

Chart on The Netherlands - Market size and forecast 2025-2030 ($ million)
Data Table on The Netherlands - Market size and forecast 2025-2030 ($ million)
Chart on The Netherlands - Year-over-year growth 2025-2030 (%)
Data Table on The Netherlands - Year-over-year growth 2025-2030 (%)

12.5.6 Spain - Market size and forecast 2025-2030

Chart on Spain - Market size and forecast 2025-2030 ($ million)
Data Table on Spain - Market size and forecast 2025-2030 ($ million)
Chart on Spain - Year-over-year growth 2025-2030 (%)
Data Table on Spain - Year-over-year growth 2025-2030 (%)

12.6 Rest of World (ROW) - Market size and forecast 2025-2030

Chart on Rest of World (ROW) - Market size and forecast 2025-2030 ($ million)
Data Table on Rest of World (ROW) - Market size and forecast 2025-2030 ($ million)
Chart on Rest of World (ROW) - Year-over-year growth 2025-2030 (%)
Data Table on Rest of World (ROW) - Year-over-year growth 2025-2030 (%)
Chart on Regional Comparison - Rest of World (ROW)
Data Table on Regional Comparison - Rest of World (ROW)

12.6.1 Brazil - Market size and forecast 2025-2030

Chart on Brazil - Market size and forecast 2025-2030 ($ million)
Data Table on Brazil - Market size and forecast 2025-2030 ($ million)
Chart on Brazil - Year-over-year growth 2025-2030 (%)
Data Table on Brazil - Year-over-year growth 2025-2030 (%)

12.6.2 Argentina - Market size and forecast 2025-2030

Chart on Argentina - Market size and forecast 2025-2030 ($ million)
Data Table on Argentina - Market size and forecast 2025-2030 ($ million)
Chart on Argentina - Year-over-year growth 2025-2030 (%)
Data Table on Argentina - Year-over-year growth 2025-2030 (%)

12.6.3 Colombia - Market size and forecast 2025-2030

Chart on Colombia - Market size and forecast 2025-2030 ($ million)
Data Table on Colombia - Market size and forecast 2025-2030 ($ million)
Chart on Colombia - Year-over-year growth 2025-2030 (%)
Data Table on Colombia - Year-over-year growth 2025-2030 (%)

12.6.4 Saudi Arabia - Market size and forecast 2025-2030

Chart on Saudi Arabia - Market size and forecast 2025-2030 ($ million)
Data Table on Saudi Arabia - Market size and forecast 2025-2030 ($ million)
Chart on Saudi Arabia - Year-over-year growth 2025-2030 (%)
Data Table on Saudi Arabia - Year-over-year growth 2025-2030 (%)

12.6.5 UAE - Market size and forecast 2025-2030

Chart on UAE - Market size and forecast 2025-2030 ($ million)
Data Table on UAE - Market size and forecast 2025-2030 ($ million)
Chart on UAE - Year-over-year growth 2025-2030 (%)
Data Table on UAE - Year-over-year growth 2025-2030 (%)

12.6.6 South Africa - Market size and forecast 2025-2030

Chart on South Africa - Market size and forecast 2025-2030 ($ million)
Data Table on South Africa - Market size and forecast 2025-2030 ($ million)
Chart on South Africa - Year-over-year growth 2025-2030 (%)
Data Table on South Africa - Year-over-year growth 2025-2030 (%)

12.6.7 Israel - Market size and forecast 2025-2030

Chart on Israel - Market size and forecast 2025-2030 ($ million)
Data Table on Israel - Market size and forecast 2025-2030 ($ million)
Chart on Israel - Year-over-year growth 2025-2030 (%)
Data Table on Israel - Year-over-year growth 2025-2030 (%)

12.6.8 Turkey - Market size and forecast 2025-2030

Chart on Turkey - Market size and forecast 2025-2030 ($ million)
Data Table on Turkey - Market size and forecast 2025-2030 ($ million)
Chart on Turkey - Year-over-year growth 2025-2030 (%)
Data Table on Turkey - Year-over-year growth 2025-2030 (%)

12.7 Market opportunity by geography

Market opportunity by geography ($ million)
Data Tables on Market opportunity by geography ($ million)

13. Drivers, Challenges, and Opportunity

13.1 Market drivers

Pervasive technological advancements and instrument miniaturization
Increasingly stringent regulatory compliance and safety mandates
Growing demand for on-site analysis in critical end-use industries

13.2 Market challenges

High initial acquisition cost and budgetary constraints
Technical limitations and concerns over data equivalency
Data security, integrity, and system integration complexity

13.3 Impact of drivers and challenges

Impact of drivers and challenges in 2025 and 2030

13.4 Market opportunities

Ascendancy of connected instrumentation and data as service models
Proliferation of purpose-built instruments and democratization of analysis
Convergence of analytical techniques through multi-modal and sensor fusion instruments

14. Competitive Landscape

14.1 Overview

14.2

Overview on criticality of inputs and factors of differentiation

14.3 Landscape disruption

Overview on factors of disruption

14.4 Industry risks

Impact of key risks on business

15. Competitive Analysis

15.1 Companies profiled

Companies covered

15.2 Company ranking index

15.3 Market positioning of companies

Matrix on companies position and classification

15.4 Agilent Technologies Inc.

Agilent Technologies Inc. - Overview
Agilent Technologies Inc. - Business segments
Agilent Technologies Inc. - Key news
Agilent Technologies Inc. - Key offerings
Agilent Technologies Inc. - Segment focus
SWOT

15.5 Bio Rad Laboratories Inc.

Bio Rad Laboratories Inc. - Overview
Bio Rad Laboratories Inc. - Business segments
Bio Rad Laboratories Inc. - Key news
Bio Rad Laboratories Inc. - Key offerings
Bio Rad Laboratories Inc. - Segment focus
SWOT

15.6 Bruker Corp.

Bruker Corp. - Overview
Bruker Corp. - Business segments
Bruker Corp. - Key news
Bruker Corp. - Key offerings
Bruker Corp. - Segment focus
SWOT

15.7 Danaher Corp.

Danaher Corp. - Overview
Danaher Corp. - Business segments
Danaher Corp. - Key news
Danaher Corp. - Key offerings
Danaher Corp. - Segment focus
SWOT

15.8 Eppendorf SE

Eppendorf SE - Overview
Eppendorf SE - Product / Service
Eppendorf SE - Key news
Eppendorf SE - Key offerings
SWOT

15.9 F. Hoffmann La Roche Ltd.

F. Hoffmann La Roche Ltd. - Overview
F. Hoffmann La Roche Ltd. - Business segments
F. Hoffmann La Roche Ltd. - Key news
F. Hoffmann La Roche Ltd. - Key offerings
F. Hoffmann La Roche Ltd. - Segment focus
SWOT

15.10 Hitachi Ltd.

Hitachi Ltd. - Overview
Hitachi Ltd. - Business segments
Hitachi Ltd. - Key news
Hitachi Ltd. - Key offerings
Hitachi Ltd. - Segment focus
SWOT

15.11 HORIBA Ltd.

HORIBA Ltd. - Overview
HORIBA Ltd. - Business segments
HORIBA Ltd. - Key news
HORIBA Ltd. - Key offerings
HORIBA Ltd. - Segment focus
SWOT

15.12 METTLER TOLEDO

METTLER TOLEDO - Overview
METTLER TOLEDO - Business segments
METTLER TOLEDO - Key news
METTLER TOLEDO - Key offerings
METTLER TOLEDO - Segment focus
SWOT

15.13 PerkinElmer US LLC

PerkinElmer US LLC - Overview
PerkinElmer US LLC - Business segments
PerkinElmer US LLC - Key offerings
PerkinElmer US LLC - Segment focus
SWOT

15.14 Shimadzu Corp.

Shimadzu Corp. - Overview
Shimadzu Corp. - Business segments
Shimadzu Corp. - Key news
Shimadzu Corp. - Key offerings
Shimadzu Corp. - Segment focus
SWOT

15.15 Spectris plc

Spectris plc - Overview
Spectris plc - Business segments
Spectris plc - Key offerings
Spectris plc - Segment focus
SWOT

15.16 Teledyne Technologies Inc.

Teledyne Technologies Inc. - Overview
Teledyne Technologies Inc. - Business segments
Teledyne Technologies Inc. - Key news
Teledyne Technologies Inc. - Key offerings
Teledyne Technologies Inc. - Segment focus
SWOT

15.17 Thermo Fisher Scientific Inc.

Thermo Fisher Scientific Inc. - Overview
Thermo Fisher Scientific Inc. - Business segments
Thermo Fisher Scientific Inc. - Key news
Thermo Fisher Scientific Inc. - Key offerings
Thermo Fisher Scientific Inc. - Segment focus
SWOT

15.18 Waters Corp.

Waters Corp. - Overview
Waters Corp. - Business segments
Waters Corp. - Key offerings
Waters Corp. - Segment focus
SWOT

16. Appendix

16.1 Scope of the report

Market definition
Objectives
Notes and caveats

16.2 Inclusions and exclusions checklist

Inclusions checklist
Exclusions checklist

16.3 Currency conversion rates for US$

16.4 Research methodology

16.5 Data procurement

Information sources

16.6 Data validation

16.7 Validation techniques employed for market sizing

16.8 Data synthesis

16.9 360 degree market analysis

16.10 List of abbreviations

Research Methodology

Technavio presents a detailed picture of the market by way of study, synthesis, and summation of data from multiple sources. The analysts have presented the various facets of the market with a particular focus on identifying the key industry influencers. The data thus presented is comprehensive, reliable, and the result of extensive research, both primary and secondary.

INFORMATION SOURCES

Primary sources

  • Manufacturers and suppliers
  • Channel partners
  • Industry experts
  • Strategic decision makers

Secondary sources

  • Industry journals and periodicals
  • Government data
  • Financial reports of key industry players
  • Historical data
  • Press releases

DATA ANALYSIS

Data Synthesis

  • Collation of data
  • Estimation of key figures
  • Analysis of derived insights

Data Validation

  • Triangulation with data models
  • Reference against proprietary databases
  • Corroboration with industry experts

REPORT WRITING

Qualitative

  • Market drivers
  • Market challenges
  • Market trends
  • Five forces analysis

Quantitative

  • Market size and forecast
  • Market segmentation
  • Geographical insights
  • Competitive landscape

Interested in this report?

Get your sample now to see our research methodology and insights!

Download Now

Frequently Asked Questions

Portable Analytical Instrument market growth will increase by USD 3604.2 million during 2026-2030 .

The Portable Analytical Instrument market is expected to grow at a CAGR of 6% during 2026-2030 .

Portable Analytical Instrument market is segmented by Product (Spectrometers, Gas and TOC analyzers, Thermal analyzers, Others) End-user (Pharmaceutical and biotechnology companies, Food and beverage companies, Environmental testing organizations, Others) Technology (Spectroscopic analysis, Elemental analysis, Others)

Agilent Technologies Inc., Bio Rad Laboratories Inc., Bruker Corp., Danaher Corp., Eppendorf SE, F. Hoffmann La Roche Ltd., Hitachi Ltd., HORIBA Ltd., JASCO International Co. Ltd., JEOL Ltd., Metrohm AG, METTLER TOLEDO, PerkinElmer US LLC, Rigaku Corp., Rudolph Research Analytical, Shimadzu Corp., Spectris plc, Teledyne Technologies Inc., Thermo Fisher Scientific Inc., Waters Corp. are a few of the key vendors in the Portable Analytical Instrument market.

Asia will register the highest growth rate of 33.8% among the other regions. Therefore, the Portable Analytical Instrument market in Asia is expected to garner significant business opportunities for the vendors during the forecast period.

China, India, Japan, South Korea, Thailand, Indonesia, US, Canada, Mexico, Germany, UK, France, Italy, The Netherlands, Spain, Brazil, Argentina, Colombia, Saudi Arabia, UAE, South Africa, Israel, Turkey

  • Pervasive technological advancements and instrument miniaturization is the driving factor this market.

The Portable Analytical Instrument market vendors should focus on grabbing business opportunities from the Product segment as it accounted for the largest market share in the base year.