PPR Pipe Market Analysis, Size, and Forecast 2026-2030: APAC (China, Japan, and India), North America (US, Canada, and Mexico), Europe (Germany, UK, and France), Middle East and Africa (Saudi Arabia, UAE, and South Africa), South America (Brazil and Argentina), and Rest of World (ROW)

PPR Pipe Market Analysis, Size, and Forecast 2026-2030:
APAC (China, Japan, and India), North America (US, Canada, and Mexico), Europe (Germany, UK, and France), Middle East and Africa (Saudi Arabia, UAE, and South Africa), South America (Brazil and Argentina), and Rest of World (ROW)

Published: Mar 2026 292 Pages SKU: IRTNTR76860

Market Overview at a Glance

$456.2 Mn
Market Opportunity
4.7%
CAGR 2025 - 2030
43.8%
APAC Growth
$930.7 Mn
HCW PPR pipes segment 2024

PPR Pipe Market Size 2026-2030

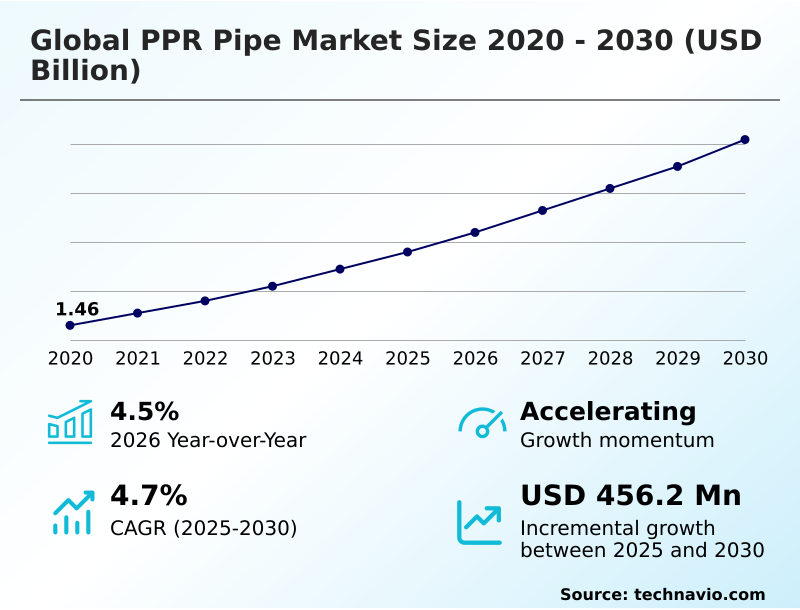
The ppr pipe market size is valued to increase by USD 456.2 million, at a CAGR of 4.7% from 2025 to 2030. Growth in construction and infrastructure will drive the ppr pipe market.

Major Market Trends & Insights

  • APAC dominated the market and accounted for a 43.8% growth during the forecast period.
  • By Type - HCW PPR pipes segment was valued at USD 930.7 million in 2024
  • By Application - Commercial segment accounted for the largest market revenue share in 2024

Market Size & Forecast

  • Market Opportunities: USD 752.9 million
  • Market Future Opportunities: USD 456.2 million
  • CAGR from 2025 to 2030 : 4.7%

Market Summary

  • The ppr pipe market is shaped by a transition toward advanced thermoplastic solutions in industrial and residential sectors, driven by superior material properties. Key advantages include exceptional corrosion resistance, high-temperature resistance, and the reliability of heat fusion welding, which creates a leak-proof joint. This makes ppr pipe ideal for potable water systems and complex hvac applications.
  • A critical business scenario involves the modernization of aging urban water infrastructure. Municipalities are replacing corroded metallic pipes with polymer-based systems to improve water quality and reduce maintenance costs, leveraging PPR's scaling resistance and 50+ year service life. This shift is supported by green building certifications that mandate the use of non-toxic material and energy-efficient components.
  • Innovations like fiberglass-reinforced pipes and multilayer composite pipes are expanding applications into high-pressure industrial fluid transport, where chemical inertness is crucial. The market's trajectory is toward intelligent fluid handling systems, integrating smart plumbing technologies to enhance operational efficiency and resource management.
  • This evolution is driven by the need for durable piping infrastructure that aligns with modern sustainability and performance standards, ensuring long-term value in a competitive construction landscape.

What will be the Size of the PPR Pipe Market during the forecast period?

Get Key Insights on Market Forecast (PDF) Request Free Sample

How is the PPR Pipe Market Segmented?

The ppr pipe industry research report provides comprehensive data (region-wise segment analysis), with forecasts and estimates in "USD million" for the period 2026-2030, as well as historical data from 2020-2024 for the following segments.

  • Type
    • HCW PPR pipes
    • Composite PPR pipes
  • Application
    • Commercial
    • Residential
    • Industrial
    • Agriculture
  • End-user
    • Construction and contracting firms
    • Plumbing and HVAC specialists
    • Industrial facilities
  • Geography
    • APAC
      • China
      • Japan
      • India
    • North America
      • US
      • Canada
      • Mexico
    • Europe
      • Germany
      • UK
      • France
    • Middle East and Africa
      • Saudi Arabia
      • UAE
      • South Africa
    • South America
      • Brazil
      • Argentina
    • Rest of World (ROW)

By Type Insights

The hcw ppr pipes segment is estimated to witness significant growth during the forecast period.

The global ppr pipe market is segmented by type, including HCW PPR pipes, which are pivotal for modern pressurized plumbing and hot water applications.

This segment is defined by its exceptional thermal stability and high-temperature resistance, making it a superior thermoplastic piping solution. The material's inherent impact strength prevents cracking under stress.

A key differentiator is the use of heat fusion welding, which creates a monolithic, leak-proof joint, a critical feature for both potable water systems and domestic hot water systems.

Adherence to green building certifications is driving adoption, as these pipes are a non-toxic material. In high-rise residential projects, advanced sound-insulated pipe variants offer enhanced occupant comfort, improving acoustic performance by up to 25% compared to conventional systems.

This focus on performance and sustainability underpins the demand for these durable piping infrastructure components.

Request Free Sample

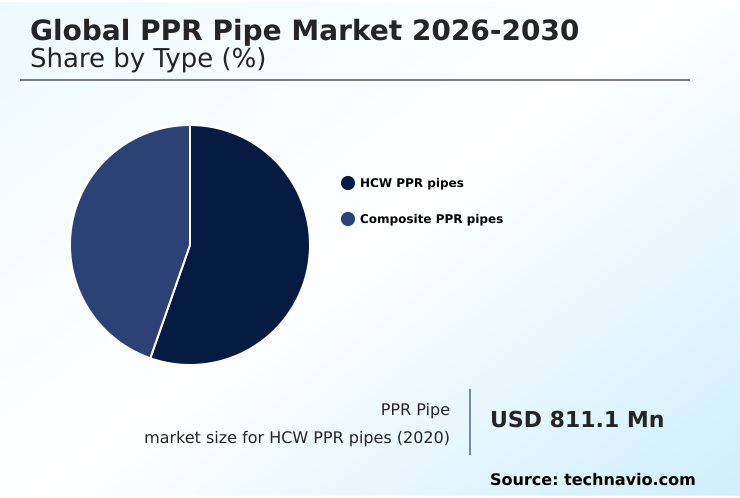
The HCW PPR pipes segment was valued at USD 930.7 million in 2024 and showed a gradual increase during the forecast period.

Request Free Sample

Regional Analysis

APAC is estimated to contribute 43.8% to the growth of the global market during the forecast period.Technavio’s analysts have elaborately explained the regional trends and drivers that shape the market during the forecast period.

See How PPR Pipe Market Demand is Rising in APAC Request Free Sample

The market's geographic landscape is led by APAC, which accounts for 43.8% of the incremental growth, driven by massive urban water projects and demand for durable piping infrastructure.

In this region, the adoption of antimicrobial ppr piping in new healthcare facilities has seen a significant uptake.

North America is characterized by stringent green building certifications, promoting the use of pre-insulated ppr systems to enhance energy efficiency in hvac applications, contributing to 26.72% of growth.

In Europe, the focus is on plumbing network modernization and district heating projects, where the low linear thermal expansion of composite ppr pipes is a key advantage.

The Middle East leverages the material's high-temperature resistance for large-scale municipal water grid expansions, addressing extreme climate challenges and driving demand for advanced fluid transport solutions.

Market Dynamics

Our researchers analyzed the data with 2025 as the base year, along with the key drivers, trends, and challenges. A holistic analysis of drivers will help companies refine their marketing strategies to gain a competitive advantage.

  • Strategic decision-making in the ppr pipe market requires a nuanced understanding of specific use cases. For instance, the debate over ppr vs cpvc in residential plumbing often centers on jointing technology and long-term durability, where PPR's fusion welding offers distinct advantages.
  • The cost benefits of ppr pipe installation become apparent when considering reduced labor time and the elimination of solvents and glues. In sustainable energy applications, the use of ppr pipe for geothermal heating systems is growing due to its thermal efficiency and resistance to corrosion.
  • For more demanding structural needs, the advantages of fiberglass-reinforced ppr pipes include higher pressure ratings and reduced sagging. Industrially, ppr pipe for compressed air applications is preferred because its smooth interior prevents pressure loss and contamination. The low thermal expansion coefficient of composite ppr makes it ideal for long, straight runs in commercial buildings.
  • When using ppr for industrial chemical transport, material compatibility must be verified, but its inertness is a key benefit. It is also a leading choice for ppr pipe in radiant floor heating. The superior longevity of ppr pipes in hot water applications surpasses many alternatives. Proper installation techniques for large-diameter ppr are critical for municipal projects.
  • Meanwhile, ppr pipe for food grade applications meets strict hygiene standards. Firms analyzing the environmental impact of ppr pipe production find its lifecycle footprint is lower than that of metallic pipes by over 20%.
  • Other key considerations include ppr pipe resistance to uv degradation for outdoor use, how to ensure leak-proof ppr joints, and detailed analysis of ppr pipe use in high-rise building applications. The choice between comparing ppr and pex for plumbing often depends on project-specific requirements like flexibility versus rigidity, highlighting the importance of evaluating the maintenance requirements for ppr piping systems.

What are the key market drivers leading to the rise in the adoption of PPR Pipe Industry?

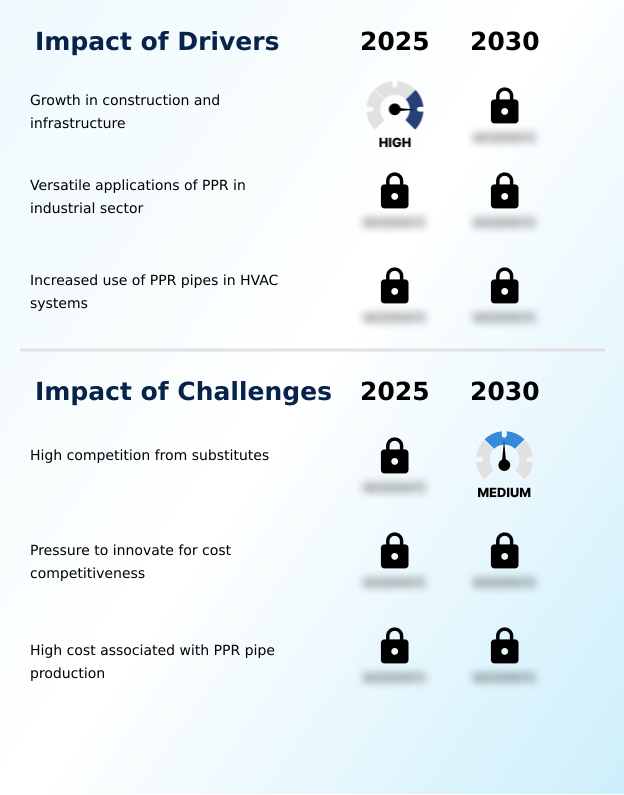
  • The primary driver for market growth is the sustained expansion of construction and infrastructure development projects globally.

  • Market growth is strongly driven by expanding construction and the versatile use of PPR in the industrial sector. The material's ability to handle high temperatures and pressures makes it ideal for condensate return lines and other industrial process piping.
  • In HVAC, the push for energy efficiency has spurred a 25% year-over-year increase in the use of PPR for chilled water systems due to its superior insulation properties.
  • Government-led water distribution upgrades and infrastructure modernization programs are accelerating the shift from metal to polymer pipes to enhance long-term hydrostatic strength and reduce leakage. This transition has proven to lower maintenance costs by over 40% in municipal applications.
  • The demand for reliable fluid transport solutions across residential, commercial, and industrial segments ensures a robust and expanding market.

What are the market trends shaping the PPR Pipe Industry?

  • The market is increasingly influenced by renovation and replacement activities in aging infrastructure. This trend boosts demand for durable and efficient piping solutions.

  • A defining market trend is the rising demand for lightweight construction materials that accelerate project timelines and reduce labor costs. The adoption of pre-fabricated construction modules has driven a 30% increase in the specification of polymer-based systems, where PPR's ease of handling is a key advantage.
  • Renovation and replacement of aging infrastructure, particularly in urban centers, are boosting the need for plumbing network modernization. This trend favors materials with proven scaling resistance and a long service life. Furthermore, the growing emphasis on sustainable construction materials has led to the widespread adoption of eco-friendly building materials in projects seeking green certifications.
  • The pipe extrusion process is also evolving to incorporate more recycled content, aligning with circular economy principles and improving the market's environmental credentials.

What challenges does the PPR Pipe Industry face during its growth?

  • Significant market growth is constrained by intense competition from substitute piping materials with varied performance and cost advantages.

  • A significant challenge is the intense competition from substitute materials like CPVC and PEX, which are well-entrenched in certain regional markets. This pressure forces manufacturers to innovate and manage fluctuating polymer resin prices to remain cost-competitive.
  • The high capital investment required for advanced extrusion equipment and the ongoing costs of pressure rating verification to meet international standards pose barriers for smaller players. Moreover, pipe material degradation concerns with lower-quality alternatives can impact the overall market reputation.
  • The industry must address the high initial cost associated with premium composite pipes, which can be up to 20% higher than standard variants, by effectively communicating long-term value propositions related to durability and reduced operational expenditure, especially in specialized industrial applications.

Exclusive Technavio Analysis on Customer Landscape

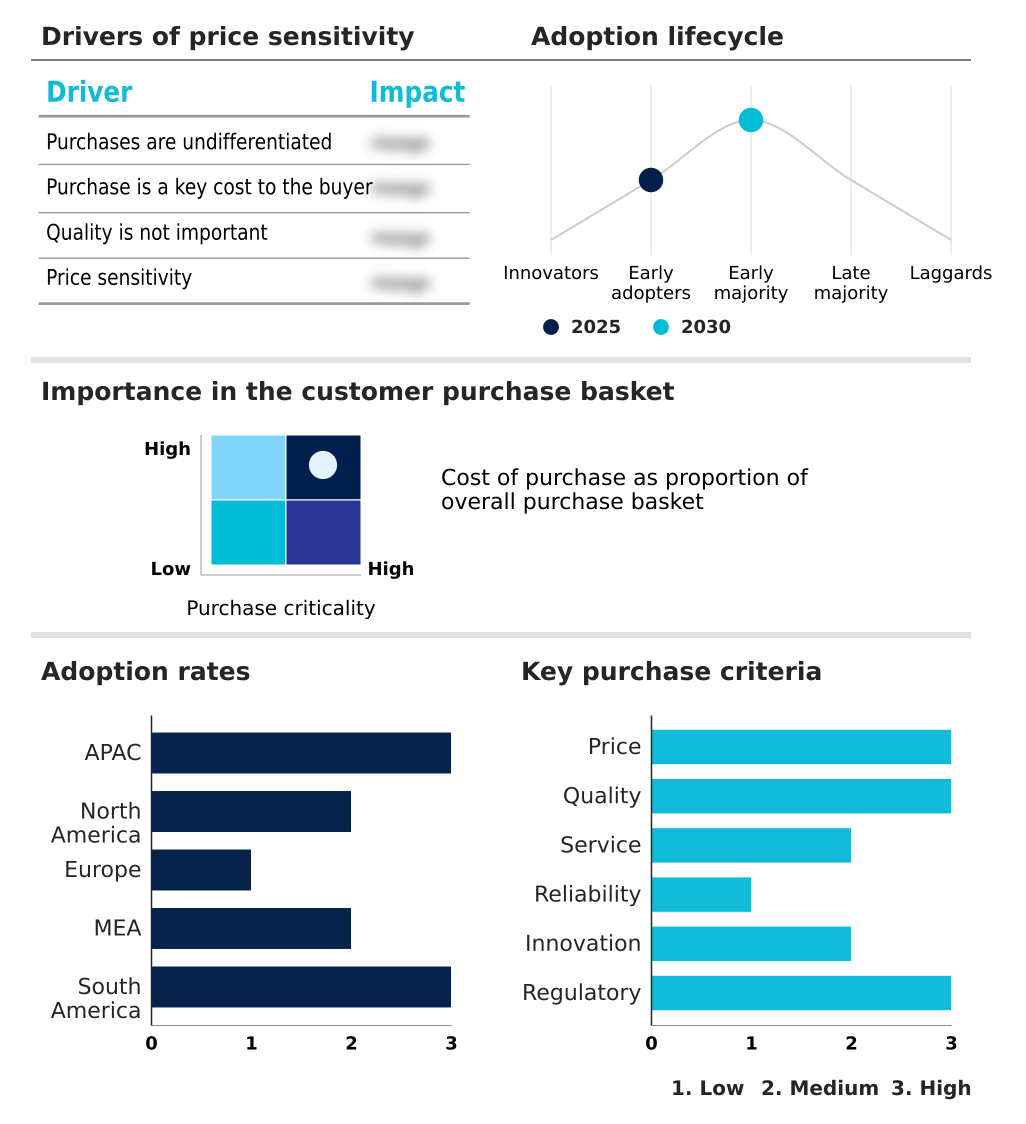
The ppr pipe market forecasting report includes the adoption lifecycle of the market, covering from the innovator’s stage to the laggard’s stage. It focuses on adoption rates in different regions based on penetration. Furthermore, the ppr pipe market report also includes key purchase criteria and drivers of price sensitivity to help companies evaluate and develop their market growth analysis strategies.

Customer Landscape of PPR Pipe Industry

Competitive Landscape

Companies are implementing various strategies, such as strategic alliances, ppr pipe market forecast, partnerships, mergers and acquisitions, geographical expansion, and product/service launches, to enhance their presence in the industry.

APL Apollo Tubes Ltd. - Offerings include specialized PPR plumbing pipes and complete systems engineered for reliable performance in residential hot and cold water applications.

The industry research and growth report includes detailed analyses of the competitive landscape of the market and information about key companies, including:

  • APL Apollo Tubes Ltd.
  • Euroaqua Plumtek Pvt. Ltd.
  • Formul Plastik AS
  • Georg Fischer Ltd.
  • KPT Piping System
  • Kunststoff Pipes LLP
  • Ningbo Sunplast Pipe Co. Ltd.
  • Northeast Polypipes LLP
  • Polyraj Pipes LLP
  • Rietti Group Srl
  • RIIFO Group Co. Ltd.
  • Rockwell Industries Ltd.
  • Savoir Faire Manufacturing Co.
  • Shree Harikrishna Group
  • Tianjin Pipe Industry Co. Ltd.
  • Tommur Industry Co. Ltd.
  • Vasen
  • Vectus Industries Ltd.

Qualitative and quantitative analysis of companies has been conducted to help clients understand the wider business environment as well as the strengths and weaknesses of key industry players. Data is qualitatively analyzed to categorize companies as pure play, category-focused, industry-focused, and diversified; it is quantitatively analyzed to categorize companies as dominant, leading, strong, tentative, and weak.

Recent Development and News in Ppr pipe market

  • In March, 2025, Euroaqua Plumtek Pvt. Ltd. introduced a new generation of high-heat-stabilized HCW PPR pipes, utilizing advanced molecular structuring to enhance long-term hydrostatic strength at elevated temperatures.
  • In January, 2025, Georg Fischer Ltd. integrated the Uponor brand to offer advanced building flow solutions, leading to the introduction of pre-insulated plastic piping systems designed to enhance thermal energy efficiency.
  • In February, 2025, APL Apollo Tubes Ltd. responded to India's expanded 'Nal Se Jal' initiative by increasing production capacity for high-durability polypropylene random copolymer solutions to meet rising demand for rural piped water projects.
  • In May, 2025, RIIFO Group Co. Ltd. launched a mass-flow series of polypropylene random copolymer pipes featuring a patented swallow-tailed structure to eliminate leakage risks from thermal expansion in metal and plastic components.

Dive into Technavio’s robust research methodology, blending expert interviews, extensive data synthesis, and validated models for unparalleled PPR Pipe Market insights. See full methodology.

Market Scope
Page number 292
Base year 2025
Historic period 2020-2024
Forecast period 2026-2030
Growth momentum & CAGR Accelerate at a CAGR of 4.7%
Market growth 2026-2030 USD 456.2 million
Market structure Fragmented
YoY growth 2025-2026(%) 4.5%
Key countries China, Japan, India, South Korea, Australia, Indonesia, US, Canada, Mexico, Germany, UK, France, Italy, Spain, The Netherlands, Saudi Arabia, UAE, South Africa, Israel, Turkey, Brazil, Argentina and Chile
Competitive landscape Leading Companies, Market Positioning of Companies, Competitive Strategies, and Industry Risks

Request Free Sample

Research Analyst Overview

  • The ppr pipe market is evolving from a commodity to a specialized thermoplastic piping solution, driven by innovations that enhance structural integrity and performance. Boardroom decisions are increasingly influenced by the total cost of ownership, where PPR's corrosion resistance and minimal maintenance offer significant long-term savings.
  • The adoption of heat fusion welding creates a leak-proof joint, a critical factor in mitigating risk in high-value commercial and industrial settings, reducing potential water damage liabilities by over 60% compared to mechanically joined systems. The material's inherent thermal stability and high-temperature resistance make it essential for energy-efficient hvac applications and potable water systems.
  • As regulations tighten, features like non-toxic material composition and chemical inertness become key differentiators. Innovations such as multilayer composite pipes and fiberglass-reinforced pipes address challenges like linear thermal expansion, expanding use cases.
  • The market's direction is toward integrated fluid handling systems that leverage PPR's low thermal conductivity and smooth inner surface for optimal efficiency, supported by rigorous pressure rating verification and a focus on sustainability.

What are the Key Data Covered in this PPR Pipe Market Research and Growth Report?

  • What is the expected growth of the PPR Pipe Market between 2026 and 2030?

    • USD 456.2 million, at a CAGR of 4.7%

  • What segmentation does the market report cover?

    • The report is segmented by Type (HCW PPR pipes, and Composite PPR pipes), Application (Commercial, Residential, Industrial, and Agriculture), End-user (Construction and contracting firms, Plumbing and HVAC specialists, and Industrial facilities) and Geography (APAC, North America, Europe, Middle East and Africa, South America)

  • Which regions are analyzed in the report?

    • APAC, North America, Europe, Middle East and Africa and South America

  • What are the key growth drivers and market challenges?

    • Growth in construction and infrastructure, High competition from substitutes

  • Who are the major players in the PPR Pipe Market?

    • APL Apollo Tubes Ltd., Euroaqua Plumtek Pvt. Ltd., Formul Plastik AS, Georg Fischer Ltd., KPT Piping System, Kunststoff Pipes LLP, Ningbo Sunplast Pipe Co. Ltd., Northeast Polypipes LLP, Polyraj Pipes LLP, Rietti Group Srl, RIIFO Group Co. Ltd., Rockwell Industries Ltd., Savoir Faire Manufacturing Co., Shree Harikrishna Group, Tianjin Pipe Industry Co. Ltd., Tommur Industry Co. Ltd., Vasen and Vectus Industries Ltd.

Market Research Insights

  • The market is propelled by a convergence of demand for sustainable construction materials and the modernization of infrastructure. In the push for energy efficiency, the adoption of PPR in chilled water systems and district heating projects has reduced thermal loss by up to 15% compared to uninsulated metal pipes.
  • The expansion of high-tech manufacturing facilities and pharmaceutical cooling systems creates demand for high-purity piping, where PPR's inertness is critical. Government-backed urban water projects, particularly in emerging economies, are replacing legacy systems, contributing to a 40% increase in the specification of large-diameter ppr pipes for municipal water grid upgrades. This shift improves long-term reliability and lowers operational costs.
  • The use of pre-fabricated construction modules further accelerates adoption, as PPR's lightweight nature and predictable jointing simplify off-site assembly, cutting installation times significantly.

We can help! Our analysts can customize this ppr pipe market research report to meet your requirements.

Get in touch

1. Executive Summary

1.1 Market overview

Executive Summary - Chart on Market Overview
Executive Summary - Data Table on Market Overview
Executive Summary - Chart on Global Market Characteristics
Executive Summary - Chart on Market by Geography
Executive Summary - Chart on Market Segmentation by Type
Executive Summary - Chart on Market Segmentation by Application
Executive Summary - Chart on Market Segmentation by End-user
Executive Summary - Chart on Incremental Growth
Executive Summary - Data Table on Incremental Growth
Executive Summary - Chart on Company Market Positioning

2. Technavio Analysis

2.1 Analysis of price sensitivity, lifecycle, customer purchase basket, adoption rates, and purchase criteria

2.2 Criticality of inputs and Factors of differentiation

Chart on Overview on criticality of inputs and factors of differentiation

2.3 Factors of disruption

Chart on Overview on factors of disruption

2.4 Impact of drivers and challenges

Chart on Impact of drivers and challenges in 2025 and 2030

3. Market Landscape

3.1 Market ecosystem

Chart on Parent Market
Data Table on - Parent Market

3.2 Market characteristics

Chart on Market characteristics analysis

3.3 Value chain analysis

Chart on Value chain analysis

4. Market Sizing

4.1 Market definition

Data Table on Offerings of companies included in the market definition

4.2 Market segment analysis

Market segments

4.3 Market size 2025

4.4 Market outlook: Forecast for 2025-2030

Chart on Global - Market size and forecast 2025-2030 ($ million)
Data Table on Global - Market size and forecast 2025-2030 ($ million)
Chart on Global Market: Year-over-year growth 2025-2030 (%)
Data Table on Global Market: Year-over-year growth 2025-2030 (%)

5. Historic Market Size

5.1 Global PPR Pipe Market 2020 - 2024

Historic Market Size - Data Table on Global PPR Pipe Market 2020 - 2024 ($ million)

5.2 Type segment analysis 2020 - 2024

Historic Market Size - Type Segment 2020 - 2024 ($ million)

5.3 Application segment analysis 2020 - 2024

Historic Market Size - Application Segment 2020 - 2024 ($ million)

5.4 End-user segment analysis 2020 - 2024

Historic Market Size - End-user Segment 2020 - 2024 ($ million)

5.5 Geography segment analysis 2020 - 2024

Historic Market Size - Geography Segment 2020 - 2024 ($ million)

5.6 Country segment analysis 2020 - 2024

Historic Market Size - Country Segment 2020 - 2024 ($ million)

6. Qualitative Analysis

6.1 The Impact of AI on Global PPR Pipe Market

7. Five Forces Analysis

7.1 Five forces summary

Five forces analysis - Comparison between 2025 and 2030

7.2 Bargaining power of buyers

Bargaining power of buyers - Impact of key factors 2025 and 2030

7.3 Bargaining power of suppliers

Bargaining power of suppliers - Impact of key factors in 2025 and 2030

7.4 Threat of new entrants

Threat of new entrants - Impact of key factors in 2025 and 2030

7.5 Threat of substitutes

Threat of substitutes - Impact of key factors in 2025 and 2030

7.6 Threat of rivalry

Threat of rivalry - Impact of key factors in 2025 and 2030

7.7 Market condition

Chart on Market condition - Five forces 2025 and 2030

8. Market Segmentation by Type

8.1 Market segments

Chart on Type - Market share 2025-2030 (%)
Data Table on Type - Market share 2025-2030 (%)

8.2 Comparison by Type

Chart on Comparison by Type
Data Table on Comparison by Type

8.3 HCW PPR pipes - Market size and forecast 2025-2030

Chart on HCW PPR pipes - Market size and forecast 2025-2030 ($ million)
Data Table on HCW PPR pipes - Market size and forecast 2025-2030 ($ million)
Chart on HCW PPR pipes - Year-over-year growth 2025-2030 (%)
Data Table on HCW PPR pipes - Year-over-year growth 2025-2030 (%)

8.4 Composite PPR pipes - Market size and forecast 2025-2030

Chart on Composite PPR pipes - Market size and forecast 2025-2030 ($ million)
Data Table on Composite PPR pipes - Market size and forecast 2025-2030 ($ million)
Chart on Composite PPR pipes - Year-over-year growth 2025-2030 (%)
Data Table on Composite PPR pipes - Year-over-year growth 2025-2030 (%)

8.5 Market opportunity by Type

Market opportunity by Type ($ million)
Data Table on Market opportunity by Type ($ million)

9. Market Segmentation by Application

9.1 Market segments

Chart on Application - Market share 2025-2030 (%)
Data Table on Application - Market share 2025-2030 (%)

9.2 Comparison by Application

Chart on Comparison by Application
Data Table on Comparison by Application

9.3 Commercial - Market size and forecast 2025-2030

Chart on Commercial - Market size and forecast 2025-2030 ($ million)
Data Table on Commercial - Market size and forecast 2025-2030 ($ million)
Chart on Commercial - Year-over-year growth 2025-2030 (%)
Data Table on Commercial - Year-over-year growth 2025-2030 (%)

9.4 Residential - Market size and forecast 2025-2030

Chart on Residential - Market size and forecast 2025-2030 ($ million)
Data Table on Residential - Market size and forecast 2025-2030 ($ million)
Chart on Residential - Year-over-year growth 2025-2030 (%)
Data Table on Residential - Year-over-year growth 2025-2030 (%)

9.5 Industrial - Market size and forecast 2025-2030

Chart on Industrial - Market size and forecast 2025-2030 ($ million)
Data Table on Industrial - Market size and forecast 2025-2030 ($ million)
Chart on Industrial - Year-over-year growth 2025-2030 (%)
Data Table on Industrial - Year-over-year growth 2025-2030 (%)

9.6 Agriculture - Market size and forecast 2025-2030

Chart on Agriculture - Market size and forecast 2025-2030 ($ million)
Data Table on Agriculture - Market size and forecast 2025-2030 ($ million)
Chart on Agriculture - Year-over-year growth 2025-2030 (%)
Data Table on Agriculture - Year-over-year growth 2025-2030 (%)

9.7 Market opportunity by Application

Market opportunity by Application ($ million)
Data Table on Market opportunity by Application ($ million)

10. Market Segmentation by End-user

10.1 Market segments

Chart on End-user - Market share 2025-2030 (%)
Data Table on End-user - Market share 2025-2030 (%)

10.2 Comparison by End-user

Chart on Comparison by End-user
Data Table on Comparison by End-user

10.3 Construction and contracting firms - Market size and forecast 2025-2030

Chart on Construction and contracting firms - Market size and forecast 2025-2030 ($ million)
Data Table on Construction and contracting firms - Market size and forecast 2025-2030 ($ million)
Chart on Construction and contracting firms - Year-over-year growth 2025-2030 (%)
Data Table on Construction and contracting firms - Year-over-year growth 2025-2030 (%)

10.4 Plumbing and HVAC specialists - Market size and forecast 2025-2030

Chart on Plumbing and HVAC specialists - Market size and forecast 2025-2030 ($ million)
Data Table on Plumbing and HVAC specialists - Market size and forecast 2025-2030 ($ million)
Chart on Plumbing and HVAC specialists - Year-over-year growth 2025-2030 (%)
Data Table on Plumbing and HVAC specialists - Year-over-year growth 2025-2030 (%)

10.5 Industrial facilities - Market size and forecast 2025-2030

Chart on Industrial facilities - Market size and forecast 2025-2030 ($ million)
Data Table on Industrial facilities - Market size and forecast 2025-2030 ($ million)
Chart on Industrial facilities - Year-over-year growth 2025-2030 (%)
Data Table on Industrial facilities - Year-over-year growth 2025-2030 (%)

10.6 Market opportunity by End-user

Market opportunity by End-user ($ million)
Data Table on Market opportunity by End-user ($ million)

11. Customer Landscape

11.1 Customer landscape overview

Analysis of price sensitivity, lifecycle, customer purchase basket, adoption rates, and purchase criteria

12. Geographic Landscape

12.1 Geographic segmentation

Chart on Market share by geography 2025-2030 (%)
Data Table on Market share by geography 2025-2030 (%)

12.2 Geographic comparison

Chart on Geographic comparison
Data Table on Geographic comparison

12.3 APAC - Market size and forecast 2025-2030

Chart on APAC - Market size and forecast 2025-2030 ($ million)
Data Table on APAC - Market size and forecast 2025-2030 ($ million)
Chart on APAC - Year-over-year growth 2025-2030 (%)
Data Table on APAC - Year-over-year growth 2025-2030 (%)
Chart on Regional Comparison - APAC
Data Table on Regional Comparison - APAC

12.3.1 China - Market size and forecast 2025-2030

Chart on China - Market size and forecast 2025-2030 ($ million)
Data Table on China - Market size and forecast 2025-2030 ($ million)
Chart on China - Year-over-year growth 2025-2030 (%)
Data Table on China - Year-over-year growth 2025-2030 (%)

12.3.2 Japan - Market size and forecast 2025-2030

Chart on Japan - Market size and forecast 2025-2030 ($ million)
Data Table on Japan - Market size and forecast 2025-2030 ($ million)
Chart on Japan - Year-over-year growth 2025-2030 (%)
Data Table on Japan - Year-over-year growth 2025-2030 (%)

12.3.3 India - Market size and forecast 2025-2030

Chart on India - Market size and forecast 2025-2030 ($ million)
Data Table on India - Market size and forecast 2025-2030 ($ million)
Chart on India - Year-over-year growth 2025-2030 (%)
Data Table on India - Year-over-year growth 2025-2030 (%)

12.3.4 South Korea - Market size and forecast 2025-2030

Chart on South Korea - Market size and forecast 2025-2030 ($ million)
Data Table on South Korea - Market size and forecast 2025-2030 ($ million)
Chart on South Korea - Year-over-year growth 2025-2030 (%)
Data Table on South Korea - Year-over-year growth 2025-2030 (%)

12.3.5 Australia - Market size and forecast 2025-2030

Chart on Australia - Market size and forecast 2025-2030 ($ million)
Data Table on Australia - Market size and forecast 2025-2030 ($ million)
Chart on Australia - Year-over-year growth 2025-2030 (%)
Data Table on Australia - Year-over-year growth 2025-2030 (%)

12.3.6 Indonesia - Market size and forecast 2025-2030

Chart on Indonesia - Market size and forecast 2025-2030 ($ million)
Data Table on Indonesia - Market size and forecast 2025-2030 ($ million)
Chart on Indonesia - Year-over-year growth 2025-2030 (%)
Data Table on Indonesia - Year-over-year growth 2025-2030 (%)

12.4 North America - Market size and forecast 2025-2030

Chart on North America - Market size and forecast 2025-2030 ($ million)
Data Table on North America - Market size and forecast 2025-2030 ($ million)
Chart on North America - Year-over-year growth 2025-2030 (%)
Data Table on North America - Year-over-year growth 2025-2030 (%)
Chart on Regional Comparison - North America
Data Table on Regional Comparison - North America

12.4.1 US - Market size and forecast 2025-2030

Chart on US - Market size and forecast 2025-2030 ($ million)
Data Table on US - Market size and forecast 2025-2030 ($ million)
Chart on US - Year-over-year growth 2025-2030 (%)
Data Table on US - Year-over-year growth 2025-2030 (%)

12.4.2 Canada - Market size and forecast 2025-2030

Chart on Canada - Market size and forecast 2025-2030 ($ million)
Data Table on Canada - Market size and forecast 2025-2030 ($ million)
Chart on Canada - Year-over-year growth 2025-2030 (%)
Data Table on Canada - Year-over-year growth 2025-2030 (%)

12.4.3 Mexico - Market size and forecast 2025-2030

Chart on Mexico - Market size and forecast 2025-2030 ($ million)
Data Table on Mexico - Market size and forecast 2025-2030 ($ million)
Chart on Mexico - Year-over-year growth 2025-2030 (%)
Data Table on Mexico - Year-over-year growth 2025-2030 (%)

12.5 Europe - Market size and forecast 2025-2030

Chart on Europe - Market size and forecast 2025-2030 ($ million)
Data Table on Europe - Market size and forecast 2025-2030 ($ million)
Chart on Europe - Year-over-year growth 2025-2030 (%)
Data Table on Europe - Year-over-year growth 2025-2030 (%)
Chart on Regional Comparison - Europe
Data Table on Regional Comparison - Europe

12.5.1 Germany - Market size and forecast 2025-2030

Chart on Germany - Market size and forecast 2025-2030 ($ million)
Data Table on Germany - Market size and forecast 2025-2030 ($ million)
Chart on Germany - Year-over-year growth 2025-2030 (%)
Data Table on Germany - Year-over-year growth 2025-2030 (%)

12.5.2 UK - Market size and forecast 2025-2030

Chart on UK - Market size and forecast 2025-2030 ($ million)
Data Table on UK - Market size and forecast 2025-2030 ($ million)
Chart on UK - Year-over-year growth 2025-2030 (%)
Data Table on UK - Year-over-year growth 2025-2030 (%)

12.5.3 France - Market size and forecast 2025-2030

Chart on France - Market size and forecast 2025-2030 ($ million)
Data Table on France - Market size and forecast 2025-2030 ($ million)
Chart on France - Year-over-year growth 2025-2030 (%)
Data Table on France - Year-over-year growth 2025-2030 (%)

12.5.4 Italy - Market size and forecast 2025-2030

Chart on Italy - Market size and forecast 2025-2030 ($ million)
Data Table on Italy - Market size and forecast 2025-2030 ($ million)
Chart on Italy - Year-over-year growth 2025-2030 (%)
Data Table on Italy - Year-over-year growth 2025-2030 (%)

12.5.5 Spain - Market size and forecast 2025-2030

Chart on Spain - Market size and forecast 2025-2030 ($ million)
Data Table on Spain - Market size and forecast 2025-2030 ($ million)
Chart on Spain - Year-over-year growth 2025-2030 (%)
Data Table on Spain - Year-over-year growth 2025-2030 (%)

12.5.6 The Netherlands - Market size and forecast 2025-2030

Chart on The Netherlands - Market size and forecast 2025-2030 ($ million)
Data Table on The Netherlands - Market size and forecast 2025-2030 ($ million)
Chart on The Netherlands - Year-over-year growth 2025-2030 (%)
Data Table on The Netherlands - Year-over-year growth 2025-2030 (%)

12.6 Middle East and Africa - Market size and forecast 2025-2030

Chart on Middle East and Africa - Market size and forecast 2025-2030 ($ million)
Data Table on Middle East and Africa - Market size and forecast 2025-2030 ($ million)
Chart on Middle East and Africa - Year-over-year growth 2025-2030 (%)
Data Table on Middle East and Africa - Year-over-year growth 2025-2030 (%)
Chart on Regional Comparison - Middle East and Africa
Data Table on Regional Comparison - Middle East and Africa

12.6.1 Saudi Arabia - Market size and forecast 2025-2030

Chart on Saudi Arabia - Market size and forecast 2025-2030 ($ million)
Data Table on Saudi Arabia - Market size and forecast 2025-2030 ($ million)
Chart on Saudi Arabia - Year-over-year growth 2025-2030 (%)
Data Table on Saudi Arabia - Year-over-year growth 2025-2030 (%)

12.6.2 UAE - Market size and forecast 2025-2030

Chart on UAE - Market size and forecast 2025-2030 ($ million)
Data Table on UAE - Market size and forecast 2025-2030 ($ million)
Chart on UAE - Year-over-year growth 2025-2030 (%)
Data Table on UAE - Year-over-year growth 2025-2030 (%)

12.6.3 South Africa - Market size and forecast 2025-2030

Chart on South Africa - Market size and forecast 2025-2030 ($ million)
Data Table on South Africa - Market size and forecast 2025-2030 ($ million)
Chart on South Africa - Year-over-year growth 2025-2030 (%)
Data Table on South Africa - Year-over-year growth 2025-2030 (%)

12.6.4 Israel - Market size and forecast 2025-2030

Chart on Israel - Market size and forecast 2025-2030 ($ million)
Data Table on Israel - Market size and forecast 2025-2030 ($ million)
Chart on Israel - Year-over-year growth 2025-2030 (%)
Data Table on Israel - Year-over-year growth 2025-2030 (%)

12.6.5 Turkey - Market size and forecast 2025-2030

Chart on Turkey - Market size and forecast 2025-2030 ($ million)
Data Table on Turkey - Market size and forecast 2025-2030 ($ million)
Chart on Turkey - Year-over-year growth 2025-2030 (%)
Data Table on Turkey - Year-over-year growth 2025-2030 (%)

12.7 South America - Market size and forecast 2025-2030

Chart on South America - Market size and forecast 2025-2030 ($ million)
Data Table on South America - Market size and forecast 2025-2030 ($ million)
Chart on South America - Year-over-year growth 2025-2030 (%)
Data Table on South America - Year-over-year growth 2025-2030 (%)
Chart on Regional Comparison - South America
Data Table on Regional Comparison - South America

12.7.1 Brazil - Market size and forecast 2025-2030

Chart on Brazil - Market size and forecast 2025-2030 ($ million)
Data Table on Brazil - Market size and forecast 2025-2030 ($ million)
Chart on Brazil - Year-over-year growth 2025-2030 (%)
Data Table on Brazil - Year-over-year growth 2025-2030 (%)

12.7.2 Argentina - Market size and forecast 2025-2030

Chart on Argentina - Market size and forecast 2025-2030 ($ million)
Data Table on Argentina - Market size and forecast 2025-2030 ($ million)
Chart on Argentina - Year-over-year growth 2025-2030 (%)
Data Table on Argentina - Year-over-year growth 2025-2030 (%)

12.7.3 Chile - Market size and forecast 2025-2030

Chart on Chile - Market size and forecast 2025-2030 ($ million)
Data Table on Chile - Market size and forecast 2025-2030 ($ million)
Chart on Chile - Year-over-year growth 2025-2030 (%)
Data Table on Chile - Year-over-year growth 2025-2030 (%)

12.8 Market opportunity by geography

Market opportunity by geography ($ million)
Data Tables on Market opportunity by geography ($ million)

13. Drivers, Challenges, and Opportunity

13.1 Market drivers

Growth in construction and infrastructure
Versatile applications of PPR in industrial sector
Increased use of PPR pipes in HVAC systems

13.2 Market challenges

High competition from substitutes
Pressure to innovate for cost competitiveness
High cost associated with PPR pipe production

13.3 Impact of drivers and challenges

Impact of drivers and challenges in 2025 and 2030

13.4 Market opportunities

Renovation and replacement boosting PPR pipe market growth
Growing demand for environmentally friendly materials for construction
High demand for lightweight construction materials

14. Competitive Landscape

14.1 Overview

14.2

Overview on criticality of inputs and factors of differentiation

14.3 Landscape disruption

Overview on factors of disruption

14.4 Industry risks

Impact of key risks on business

15. Competitive Analysis

15.1 Companies profiled

Companies covered

15.2 Company ranking index

15.3 Market positioning of companies

Matrix on companies position and classification

15.4 APL Apollo Tubes Ltd.

APL Apollo Tubes Ltd. - Overview
APL Apollo Tubes Ltd. - Business segments
APL Apollo Tubes Ltd. - Key offerings
APL Apollo Tubes Ltd. - Segment focus
SWOT

15.5 Euroaqua Plumtek Pvt. Ltd.

Euroaqua Plumtek Pvt. Ltd. - Overview
Euroaqua Plumtek Pvt. Ltd. - Product / Service
Euroaqua Plumtek Pvt. Ltd. - Key offerings
SWOT

15.6 Formul Plastik AS

Formul Plastik AS - Overview
Formul Plastik AS - Product / Service
Formul Plastik AS - Key offerings
SWOT

15.7 Georg Fischer Ltd.

Georg Fischer Ltd. - Overview
Georg Fischer Ltd. - Business segments
Georg Fischer Ltd. - Key offerings
Georg Fischer Ltd. - Segment focus
SWOT

15.8 KPT Piping System

KPT Piping System - Overview
KPT Piping System - Product / Service
KPT Piping System - Key offerings
SWOT

15.9 Kunststoff Pipes LLP

Kunststoff Pipes LLP - Overview
Kunststoff Pipes LLP - Product / Service
Kunststoff Pipes LLP - Key offerings
SWOT

15.10 Ningbo Sunplast Pipe Co. Ltd.

Ningbo Sunplast Pipe Co. Ltd. - Overview
Ningbo Sunplast Pipe Co. Ltd. - Product / Service
Ningbo Sunplast Pipe Co. Ltd. - Key offerings
SWOT

15.11 Polyraj Pipes LLP

Polyraj Pipes LLP - Overview
Polyraj Pipes LLP - Product / Service
Polyraj Pipes LLP - Key offerings
SWOT

15.12 Rietti Group Srl

Rietti Group Srl - Overview
Rietti Group Srl - Product / Service
Rietti Group Srl - Key offerings
SWOT

15.13 RIIFO Group Co. Ltd.

RIIFO Group Co. Ltd. - Overview
RIIFO Group Co. Ltd. - Product / Service
RIIFO Group Co. Ltd. - Key offerings
SWOT

15.14 Savoir Faire Manufacturing Co.

Savoir Faire Manufacturing Co. - Overview
Savoir Faire Manufacturing Co. - Product / Service
Savoir Faire Manufacturing Co. - Key offerings
SWOT

15.15 Shree Harikrishna Group

Shree Harikrishna Group - Overview
Shree Harikrishna Group - Product / Service
Shree Harikrishna Group - Key offerings
SWOT

15.16 Tianjin Pipe Industry Co. Ltd.

Tianjin Pipe Industry Co. Ltd. - Overview
Tianjin Pipe Industry Co. Ltd. - Product / Service
Tianjin Pipe Industry Co. Ltd. - Key offerings
SWOT

15.17 Tommur Industry Co. Ltd.

Tommur Industry Co. Ltd. - Overview
Tommur Industry Co. Ltd. - Product / Service
Tommur Industry Co. Ltd. - Key offerings
SWOT

15.18 Vectus Industries Ltd.

Vectus Industries Ltd. - Overview
Vectus Industries Ltd. - Product / Service
Vectus Industries Ltd. - Key offerings
SWOT

16. Appendix

16.1 Scope of the report

Market definition
Objectives
Notes and caveats

16.2 Inclusions and exclusions checklist

Inclusions checklist
Exclusions checklist

16.3 Currency conversion rates for US$

16.4 Research methodology

16.5 Data procurement

Information sources

16.6 Data validation

16.7 Validation techniques employed for market sizing

16.8 Data synthesis

16.9 360 degree market analysis

16.10 List of abbreviations

Research Methodology

Technavio presents a detailed picture of the market by way of study, synthesis, and summation of data from multiple sources. The analysts have presented the various facets of the market with a particular focus on identifying the key industry influencers. The data thus presented is comprehensive, reliable, and the result of extensive research, both primary and secondary.

INFORMATION SOURCES

Primary sources

  • Manufacturers and suppliers
  • Channel partners
  • Industry experts
  • Strategic decision makers

Secondary sources

  • Industry journals and periodicals
  • Government data
  • Financial reports of key industry players
  • Historical data
  • Press releases

DATA ANALYSIS

Data Synthesis

  • Collation of data
  • Estimation of key figures
  • Analysis of derived insights

Data Validation

  • Triangulation with data models
  • Reference against proprietary databases
  • Corroboration with industry experts

REPORT WRITING

Qualitative

  • Market drivers
  • Market challenges
  • Market trends
  • Five forces analysis

Quantitative

  • Market size and forecast
  • Market segmentation
  • Geographical insights
  • Competitive landscape

Interested in this report?

Get your sample now to see our research methodology and insights!

Download Now

Frequently Asked Questions

PPR Pipe market growth will increase by USD 456.2 million during 2026-2030.

The PPR Pipe market is expected to grow at a CAGR of 4.7% during 2026-2030.

PPR Pipe market is segmented by Type (HCW PPR pipes, Composite PPR pipes) Application (Commercial, Residential, Industrial, Agriculture) End-user (Construction and contracting firms, Plumbing and HVAC specialists, Industrial facilities)

APL Apollo Tubes Ltd., Euroaqua Plumtek Pvt. Ltd., Formul Plastik AS, Georg Fischer Ltd., KPT Piping System, Kunststoff Pipes LLP, Ningbo Sunplast Pipe Co. Ltd., Northeast Polypipes LLP, Polyraj Pipes LLP, Rietti Group Srl, RIIFO Group Co. Ltd., Rockwell Industries Ltd., Savoir Faire Manufacturing Co., Shree Harikrishna Group, Tianjin Pipe Industry Co. Ltd., Tommur Industry Co. Ltd., Vasen, Vectus Industries Ltd. are a few of the key vendors in the PPR Pipe market.

APAC will register the highest growth rate of 43.8% among the other regions. Therefore, the PPR Pipe market in APAC is expected to garner significant business opportunities for the vendors during the forecast period.

China, Japan, India, South Korea, Australia, Indonesia, US, Canada, Mexico, Germany, UK, France, Italy, Spain, The Netherlands, Saudi Arabia, UAE, South Africa, Israel, Turkey, Brazil, Argentina, Chile

  • Growth in construction and infrastructure is the driving factor this market.

The PPR Pipe market vendors should focus on grabbing business opportunities from the Type segment as it accounted for the largest market share in the base year.