
Predictive AI in Robotics Market Size 2025-2029
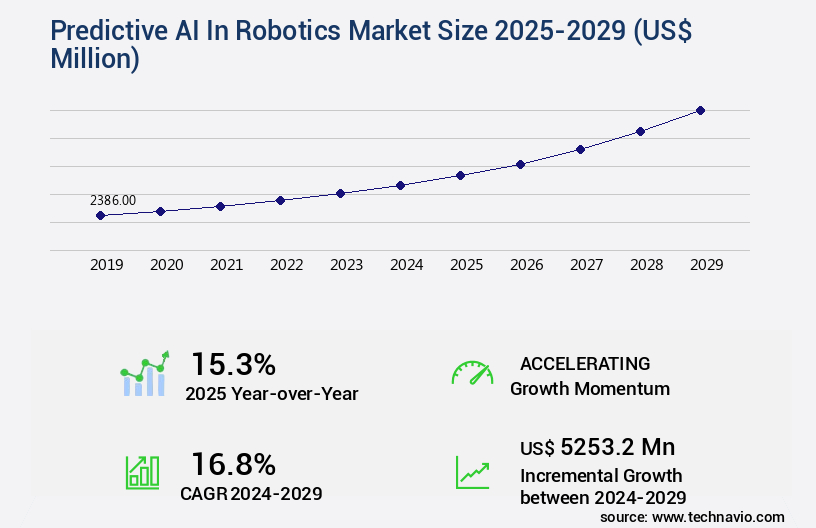
The predictive ai in robotics market size is valued to increase by USD 5.25 billion, at a CAGR of 16.8% from 2024 to 2029. Imperative of industry 4.0 and smart manufacturing for enhanced operational resiliency will drive the predictive ai in robotics market.
Market Insights
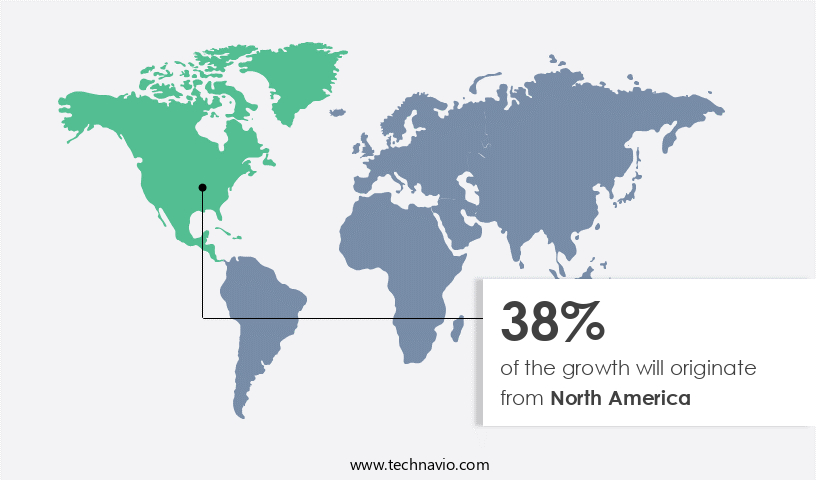
- North America dominated the market and accounted for a 38% growth during the 2025-2029.
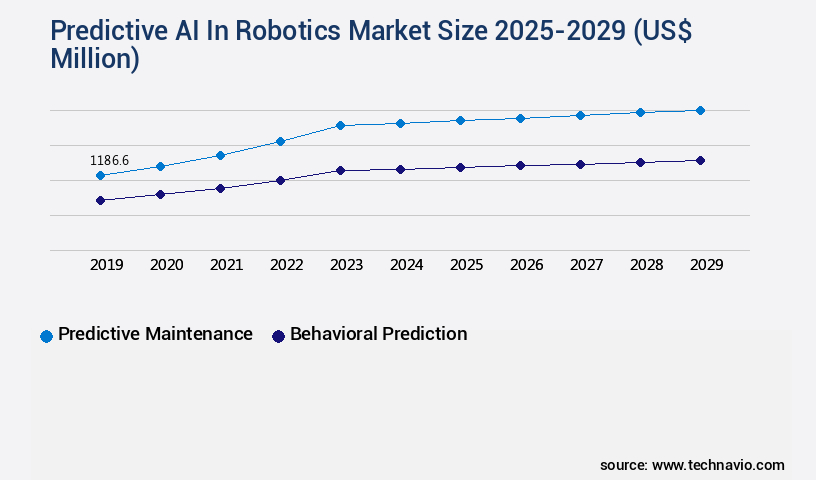
- By Type - Predictive maintenance segment was valued at USD 1.19 billion in 2023
- By Application - Industrial robots segment accounted for the largest market revenue share in 2023
Market Size & Forecast
- Market Opportunities: USD 307.06 million
- Market Future Opportunities 2024: USD 5253.20 million
- CAGR from 2024 to 2029 : 16.8%
Market Summary
- Predictive AI in robotics is revolutionizing manufacturing and production processes worldwide, enabling businesses to enhance operational resiliency and adapt to dynamic market conditions. The market's growth is driven by the imperative of Industry 4.0 and smart manufacturing, which prioritize automation, flexibility, and self-optimizing systems. Hyper-automation is a key trend in predictive AI robotics, integrating various technologies such as machine learning, deep learning, and computer vision to automate complex processes. This results in significant efficiency gains, with one study indicating an average productivity improvement of 30% in manufacturing operations using predictive maintenance. However, challenges persist, including data scarcity, quality, and security concerns.
- Ensuring the availability and accuracy of data is crucial for effective predictive AI implementation, as it forms the foundation for making informed decisions and optimizing processes. As businesses increasingly adopt predictive AI in robotics, they must address these challenges to fully realize the technology's potential. A real-world business scenario illustrates the benefits of predictive AI in robotics. In a global supply chain, predictive maintenance on robotic systems can prevent unplanned downtime, ensuring consistent production and on-time delivery. By analyzing historical data and identifying patterns, predictive AI can alert maintenance teams to potential issues before they escalate, minimizing disruptions and maximizing efficiency.
- In conclusion, predictive AI in robotics is transforming manufacturing and production processes, offering significant benefits in terms of operational resiliency and efficiency gains. Despite challenges related to data availability and quality, businesses are increasingly adopting this technology to optimize their operations and stay competitive in today's dynamic market.
What will be the size of the Predictive AI In Robotics Market during the forecast period?
Get Key Insights on Market Forecast (PDF) Request Free Sample
- Predictive AI in robotics is a continuously evolving market, with advancements in artificial intelligence (AI) technology driving significant improvements in robot performance and capabilities. One trend that is gaining traction is the integration of predictive analytics into robotics systems. By analyzing historical data and identifying patterns, predictive AI can help robots anticipate future events and adjust their behavior accordingly. For instance, in manufacturing settings, predictive AI can be used to optimize maintenance scheduling, reducing downtime and increasing productivity. According to a recent study, companies that implement predictive maintenance strategies save an average of 12% on maintenance costs.
- This data point underscores the business relevance of predictive AI in robotics, as it directly impacts budgeting and cost savings. Moreover, predictive AI can also enhance robot safety by anticipating potential hazards and taking preventative measures. For example, predictive algorithms can analyze sensor data to identify anomalies that may indicate a malfunction, allowing for early intervention and reducing the risk of accidents. As robotics systems become more complex and interconnected, predictive AI will play an increasingly important role in ensuring their smooth operation. From industrial automation to collaborative robots, predictive analytics will help improve efficiency, reduce costs, and enhance safety in various applications.
Unpacking the Predictive AI In Robotics Market Landscape
In the dynamic and innovative realm of robotics, Predictive Maintenance Models have emerged as a game-changer, leveraging Simultaneous Localization Mapping to optimize robot performance and prevent downtime. Human-Robot Collaboration is further enhanced through the integration of Natural Language Processing and Deep Learning Models, enabling seamless interaction between humans and robots. AI-Powered Control Systems, fortified with Safety Protocols, ensure reliable operation and adherence to regulatory standards. Model Training Datasets, fueled by Reinforcement Learning Algorithms, are crucial for refining robot skills, such as Robotic Manipulation and Motion Control. Cloud-Based Robotics Services, equipped with Fault Tolerance Systems and Data Acquisition Techniques, offer real-time processing capabilities and cost savings. Machine Learning Pipelines, Software Integration Tools, and Robotics Operating Systems facilitate seamless integration of advanced technologies like Computer Vision Systems, 3D Environment Modeling, and Object Recognition Algorithms. Performance Evaluation Metrics, including Real-Time Processing and Error Detection Mechanisms, ensure optimal efficiency and reliability. Autonomous Navigation Systems, bolstered by State Estimation Filters and Sensor Fusion Techniques, enable robots to navigate complex environments. Ultimately, these advancements contribute to the development of robust, intelligent robotic systems, paving the way for a future of enhanced productivity and operational excellence.
Key Market Drivers Fueling Growth
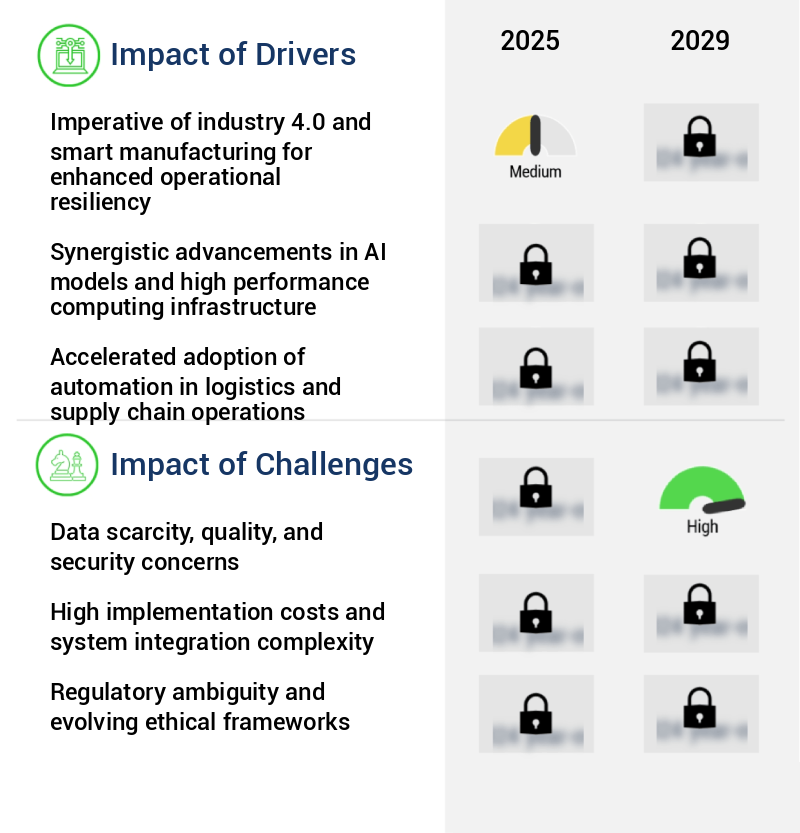
The imperative of Industry 4.0 and smart manufacturing for enhancing operational resiliency is a critical market driver. This trend is mandated by the need for increased efficiency, flexibility, and adaptability in modern manufacturing processes. By integrating advanced technologies such as the Internet of Things (IoT), artificial intelligence (AI), and machine learning (ML), manufacturers can optimize their production lines, reduce downtime, and improve overall performance. This shift towards Industry 4.0 and smart manufacturing is not just a trend, but a necessity for businesses aiming to remain competitive in today's dynamic market landscape.
- The market is a significant component of the Industry 4.0 revolution, transforming production environments from traditional, reactive systems to dynamic, interconnected, and intelligent ecosystems. Predictive AI serves as the cognitive engine for robotic systems, enabling them to optimize processes, anticipate failures, and enhance operational resilience. According to a recent study, predictive maintenance using AI in robotics can reduce unplanned downtime by up to 30%, translating to substantial cost savings for businesses. Furthermore, predictive AI in robotics can improve overall equipment efficiency by up to 20%, leading to increased productivity and improved product quality.
- The integration of predictive AI in robotics is a strategic response to the relentless pressure on businesses to minimize operational costs, enhance product quality, and maintain uptime in highly competitive global markets.
Prevailing Industry Trends & Opportunities
The upcoming market trend involves the proliferation of hyper-automation and self-optimizing robotic systems. These advanced technologies are poised to transform industries.
- The market signifies a transition towards advanced automation, where robots become integral components of self-optimizing systems. This shift integrates predictive artificial intelligence, machine learning, and digital twin technologies, enabling robots to anticipate operational requirements, adapt workflows, and perform tasks with minimal human intervention. Predictive AI algorithms analyze data from sensors, production logs, and environmental inputs to forecast future states, pinpoint potential bottlenecks, and optimize parameters like speed, trajectory, and resource usage.
- This leads to substantial improvements in operational efficiency, throughput, and resilience, significantly benefiting industries such as manufacturing and logistics.
Significant Market Challenges
The lack of adequate data, coupled with concerns over data quality and security, poses a significant challenge to the growth of the industry.
- The market is experiencing significant evolution, with applications spanning various sectors, including manufacturing, logistics, and healthcare. Predictive models in robotics rely on large volumes of high-quality, relevant, and properly labeled data to learn operational patterns and anticipate future events, such as machine failure or process deviations. However, the challenge lies in the data scarcity, as modern manufacturing and logistics environments are sensor-rich but often insight-poor. For instance, a robotic arm in a production line may generate vast amounts of data on normal performance but only a few data points for a specific type of motor failure.
- In logistics, predictive analytics is expected to save up to 15% on inventory costs and improve delivery times by up to 20%. These statistics underscore the potential business outcomes of implementing predictive AI in robotics.
In-Depth Market Segmentation: Predictive AI In Robotics Market
The predictive ai in robotics industry research report provides comprehensive data (region-wise segment analysis), with forecasts and estimates in "USD million" for the period 2025-2029, as well as historical data from 2019-2023 for the following segments.
- Type
- Predictive maintenance
- Behavioral prediction
- Others
- Application
- Industrial robots
- Service robots
- End-user
- Automotive
- Manufacturing
- Transportation and logistics
- Healthcare
- Others
- Geography
- North America
- US
- Canada
- Europe
- France
- Germany
- Italy
- UK
- APAC
- China
- Japan
- South Korea
- South America
- Brazil
- Rest of World (ROW)
- North America
By Type Insights
The predictive maintenance segment is estimated to witness significant growth during the forecast period.
Predictive maintenance models, fueled by advanced machine learning and deep learning algorithms, are revolutionizing the robotics industry by enabling proactive identification of equipment failures before they occur. These models analyze vast amounts of data from sensors monitoring robotic systems, including vibration, temperature, acoustic signatures, and electrical current. By employing sophisticated pattern recognition techniques and anomaly detection methods, these AI systems can forecast impending mechanical or electronic faults with remarkable accuracy. This shift from reactive maintenance to a data-driven strategy not only maximizes operational uptime but also reduces total cost of ownership and enhances workplace safety.
This burgeoning trend is further evidenced by the increasing adoption of AI-powered control systems, natural language processing, and cloud-based robotics services, among other advanced technologies. Simultaneous localization mapping, human-robot collaboration, and robotics simulation platforms are also integral components of this transformative landscape. Ultimately, the predictive maintenance sub-segment represents a foundational and rapidly maturing application of AI within the global robotics market.
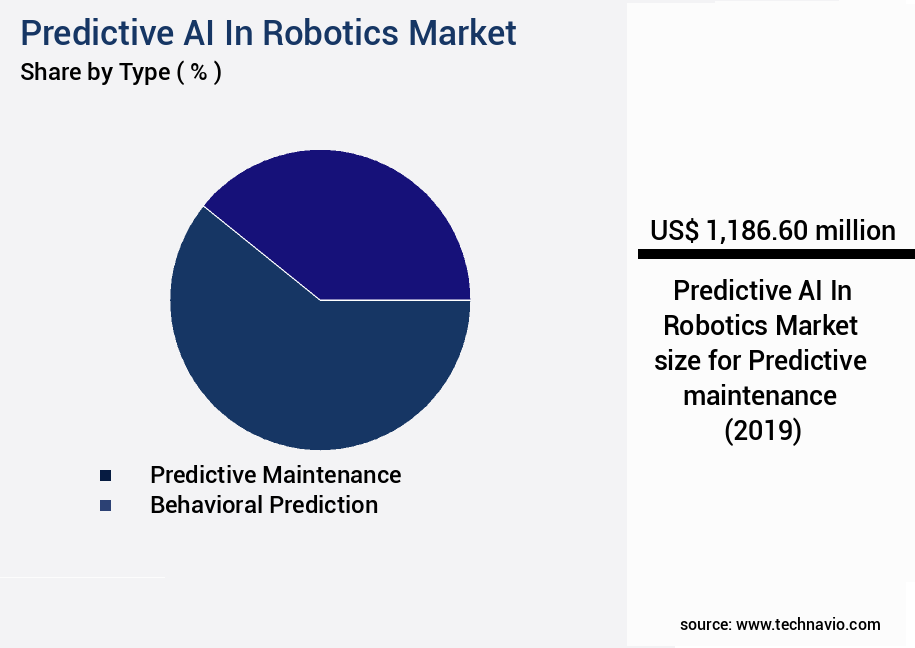
The Predictive maintenance segment was valued at USD 1.19 billion in 2019 and showed a gradual increase during the forecast period.
Regional Analysis
North America is estimated to contribute 38% to the growth of the global market during the forecast period.Technavio's analysts have elaborately explained the regional trends and drivers that shape the market during the forecast period.
See How Predictive AI In Robotics Market Demand is Rising in North America Request Free Sample
The market is currently spearheaded by North America, with the United States at the forefront. This region's dominance is attributed to substantial investments in research and development from both private and public sectors, a robust ecosystem of technology titans and startups, and a regulatory environment that balances innovation with ethical considerations. The US, as a global leader in AI research institutions, venture capital funding, and early adopting corporations, significantly contributes to the market's growth. According to recent reports, the North American market holds over 40% of the global market share.
Moreover, predictive AI in robotics is revolutionizing industries by enhancing operational efficiency, reducing costs, and ensuring regulatory compliance. For instance, predictive maintenance in manufacturing reduces downtime by up to 25%, while predictive quality control in food processing ensures consistent product quality and minimizes waste. These advancements underscore the immense potential of this market.
Customer Landscape of Predictive AI In Robotics Industry
Competitive Intelligence by Technavio Analysis: Leading Players in the Predictive AI In Robotics Market
Companies are implementing various strategies, such as strategic alliances, predictive ai in robotics market forecast, partnerships, mergers and acquisitions, geographical expansion, and product/service launches, to enhance their presence in the industry.
ABB Ltd. - This company pioneers advanced AI in robotics through Visual SLAM-enabled mobile robots and AI-powered cobots. These innovative technologies enable autonomous mapping, navigation, and adaptation to dynamic environments. Predictive capabilities elevate industrial automation and optimization.
The industry research and growth report includes detailed analyses of the competitive landscape of the market and information about key companies, including:
- ABB Ltd.
- Blue River Technology
- Boston Dynamics Inc.
- Covariant
- FANUC Corp.
- HANSON ROBOTICS Ltd.
- International Business Machines Corp.
- KUKA AG
- Locus Robotics Corp.
- Microsoft Corp.
- Neurala Inc.
- NVIDIA Corp.
- Rethink Robotics GmbH
- Robotiq Inc.
- Symbotic Inc.
- UiPath Inc.
- Universal Robots AS
- Yaskawa Electric Corp.
Qualitative and quantitative analysis of companies has been conducted to help clients understand the wider business environment as well as the strengths and weaknesses of key industry players. Data is qualitatively analyzed to categorize companies as pure play, category-focused, industry-focused, and diversified; it is quantitatively analyzed to categorize companies as dominant, leading, strong, tentative, and weak.
Recent Development and News in Predictive AI In Robotics Market
- In January 2025, leading robotics company, ABB Robotics, announced the launch of its new product, "ABB Ability Predictive Maintenance Solution for Robotics," which incorporates predictive AI to optimize robot performance and reduce downtime. This solution was showcased at the World Economic Forum in Davos, Switzerland (ABB Press Release, 2025).
- In March 2025, Fanuc Corporation and Microsoft collaborated to integrate Microsoft Azure IoT and Fanuc's robots, enabling predictive maintenance and real-time performance analysis through AI. This partnership aimed to improve manufacturing efficiency and productivity (Microsoft News Center, 2025).
- In May 2025, Softbank Robotics, a global leader in humanoid robotics, raised USD1.3 billion in a Series D funding round, led by Foxconn Technology Group. The investment will be used to expand the company's product line and enhance its predictive AI capabilities (Softbank Robotics Press Release, 2025).
- In August 2024, Bosch Rexroth, a leading industrial technology company, received regulatory approval for its predictive maintenance solution, "Industrial Internet of Things (IIoT) Predictive Maintenance," in the European Union. This approval marked a significant milestone in the company's expansion into the predictive AI robotics market (Bosch Rexroth Press Release, 2024).
Dive into Technavio's robust research methodology, blending expert interviews, extensive data synthesis, and validated models for unparalleled Predictive AI In Robotics Market insights. See full methodology.
|
Market Scope |
|
|
Report Coverage |
Details |
|
Page number |
241 |
|
Base year |
2024 |
|
Historic period |
2019-2023 |
|
Forecast period |
2025-2029 |
|
Growth momentum & CAGR |
Accelerate at a CAGR of 16.8% |
|
Market growth 2025-2029 |
USD 5253.2 million |
|
Market structure |
Fragmented |
|
YoY growth 2024-2025(%) |
15.3 |
|
Key countries |
US, Germany, China, Canada, Japan, UK, France, South Korea, Brazil, and Italy |
|
Competitive landscape |
Leading Companies, Market Positioning of Companies, Competitive Strategies, and Industry Risks |
Why Choose Technavio for Predictive AI In Robotics Market Insights?
"Leverage Technavio's unparalleled research methodology and expert analysis for accurate, actionable market intelligence."
The market is experiencing rapid growth as businesses worldwide seek to optimize their manufacturing and production processes. Predictive AI, a subset of artificial intelligence, uses data analysis and machine learning algorithms to identify patterns and make future predictions. In robotics, this technology enables machines to learn from past performance data and adjust operations accordingly, leading to increased efficiency and productivity. Predictive AI in robotics is transforming various industries, from automotive manufacturing to healthcare and logistics. For instance, in the automotive sector, predictive AI is used to optimize production lines by predicting maintenance needs and identifying potential issues before they cause downtime. In healthcare, predictive AI is used to analyze patient data and identify potential health risks, enabling early intervention and improved patient outcomes. The integration of predictive AI in robotics offers numerous benefits for businesses. By analyzing data from production processes, predictive AI can identify trends and anomalies, allowing for proactive problem-solving and supply chain optimization. Furthermore, predictive AI can help ensure regulatory compliance by identifying potential issues before they become non-compliant. Compared to traditional reactive maintenance, predictive maintenance using AI can reduce downtime by up to 30%. For instance, a manufacturing plant that experiences an average of 10 unscheduled downtime events per year could save over USD1 million in maintenance costs by implementing predictive AI in their robotics systems. In conclusion, the market is poised for significant growth as businesses seek to optimize their operations and gain a competitive edge. By analyzing data and making future predictions, predictive AI enables businesses to proactively address potential issues, improve efficiency, and enhance overall productivity. The integration of predictive AI in robotics offers a significant return on investment for businesses across various industries.
What are the Key Data Covered in this Predictive AI In Robotics Market Research and Growth Report?
-
What is the expected growth of the Predictive AI In Robotics Market between 2025 and 2029?
-
USD 5.25 billion, at a CAGR of 16.8%
-
-
What segmentation does the market report cover?
-
The report is segmented by Type (Predictive maintenance, Behavioral prediction, and Others), Application (Industrial robots and Service robots), End-user (Automotive, Manufacturing, Transportation and logistics, Healthcare, and Others), and Geography (North America, APAC, Europe, South America, and Middle East and Africa)
-
-
Which regions are analyzed in the report?
-
North America, APAC, Europe, South America, and Middle East and Africa
-
-
What are the key growth drivers and market challenges?
-
Imperative of industry 4.0 and smart manufacturing for enhanced operational resiliency, Data scarcity, quality, and security concerns
-
-
Who are the major players in the Predictive AI In Robotics Market?
-
ABB Ltd., Blue River Technology, Boston Dynamics Inc., Covariant, FANUC Corp., HANSON ROBOTICS Ltd., International Business Machines Corp., KUKA AG, Locus Robotics Corp., Microsoft Corp., Neurala Inc., NVIDIA Corp., Rethink Robotics GmbH, Robotiq Inc., Symbotic Inc., UiPath Inc., Universal Robots AS, and Yaskawa Electric Corp.
-
We can help! Our analysts can customize this predictive ai in robotics market research report to meet your requirements.
 RIA -
RIA - 
