Print Management Market Analysis, Size, and Forecast 2026-2030: North America (US, Canada, and Mexico), Europe (Germany, UK, and France), APAC (China, Japan, and India), Middle East and Africa (Saudi Arabia, UAE, and South Africa), South America (Brazil, Argentina, and Colombia), and Rest of World (ROW)

Print Management Market Analysis, Size, and Forecast 2026-2030:
North America (US, Canada, and Mexico), Europe (Germany, UK, and France), APAC (China, Japan, and India), Middle East and Africa (Saudi Arabia, UAE, and South Africa), South America (Brazil, Argentina, and Colombia), and Rest of World (ROW)

Published: May 2026 296 Pages SKU: IRTNTR81458

Market Overview at a Glance

$2.00 B
Market Opportunity
5.5%
CAGR 2025 - 2030
32.8%
APAC Growth
$4.69 B
Software segment 2024

Print Management Market Size 2026-2030

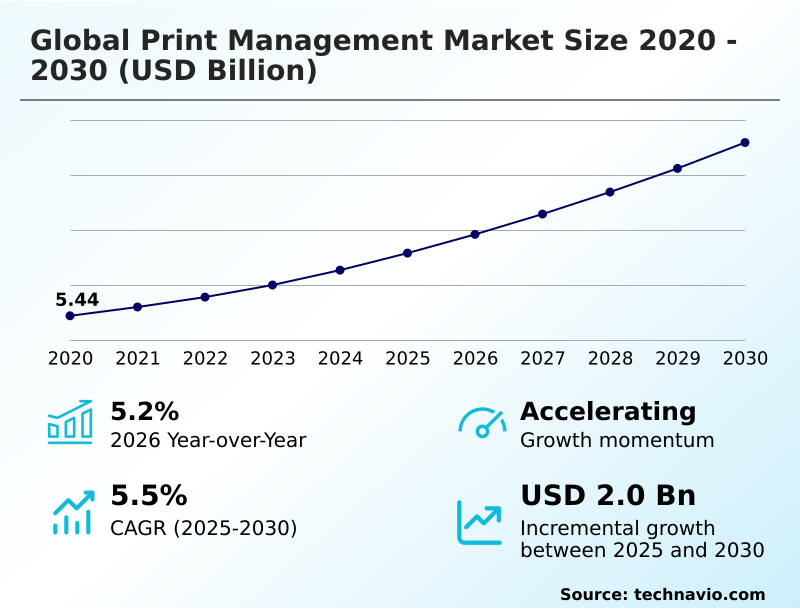
The print management market size is valued to increase by USD 2.00 billion, at a CAGR of 5.5% from 2025 to 2030. Escalating demand for cloud-based infrastructure across enterprises will drive the print management market.

Major Market Trends & Insights

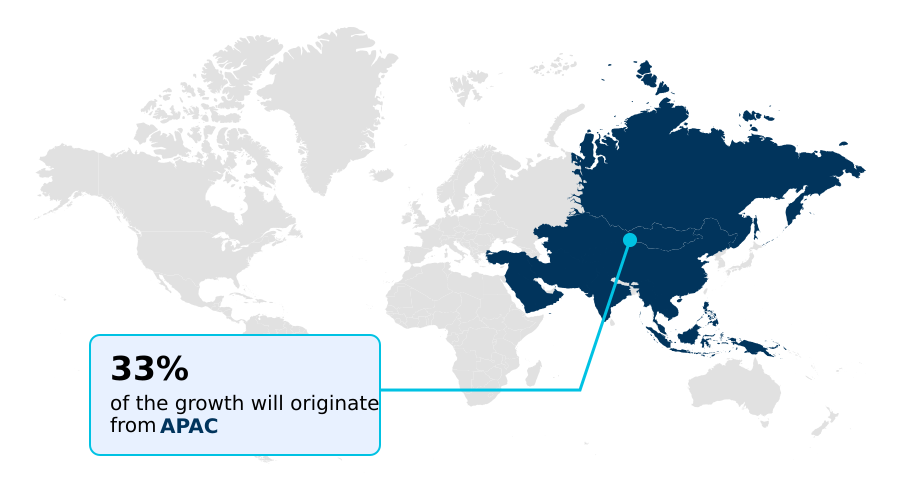
  • APAC dominated the market and accounted for a 32.8% growth during the forecast period.
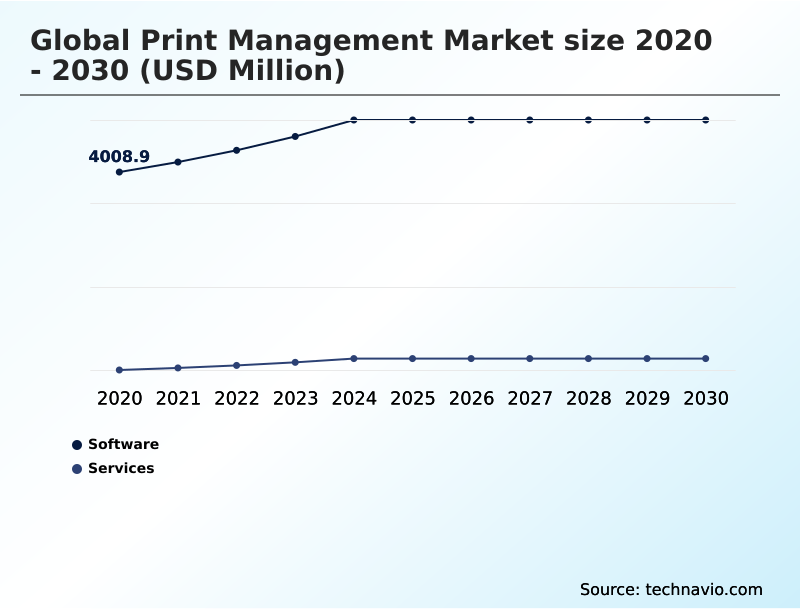
  • By Component - Software segment was valued at USD 4.69 billion in 2024
  • By Deployment - Cloud segment accounted for the largest market revenue share in 2024

Market Size & Forecast

  • Market Opportunities: USD 3.15 billion
  • Market Future Opportunities: USD 2.00 billion
  • CAGR from 2025 to 2030 : 5.5%

Market Summary

  • The print management market is undergoing robust evolution, driven by the persistent need for operational efficiency, document security, and sustainable business practices. As enterprises navigate the complexities of hybrid work models, the demand for centralized control over document output infrastructure has intensified. Organizations are moving from unmonitored printing environments toward highly structured, cloud-based print management solutions.
  • This transition allows for hardware consolidation, reduction in paper consumption, and enforcement of strict access controls, thereby mitigating data breach risks. A major catalyst for growth is the integration of advanced analytics and artificial intelligence within the software.
  • For instance, in a large healthcare network, predictive analytics can forecast maintenance for a fleet of multifunction devices, reducing downtime by over 30% and ensuring critical patient documents are always available. This shift from reactive to proactive management is vital. However, high implementation costs and resistance to change from personnel accustomed to legacy systems can impede adoption.
  • As security threats become more sophisticated, the implementation of zero trust network architectures within print environments will remain a critical focus for stakeholders.

What will be the Size of the Print Management Market during the forecast period?

Get Key Insights on Market Forecast (PDF) Request Free Sample

How is the Print Management Market Segmented?

The print management industry research report provides comprehensive data (region-wise segment analysis), with forecasts and estimates in "USD million" for the period 2026-2030, as well as historical data from 2020-2024 for the following segments.

  • Component
    • Software
    • Services
  • Deployment
    • Cloud
    • On-premises
  • End-user
    • Large enterprises
    • SMEs
  • Geography
    • North America
      • US
      • Canada
      • Mexico
    • Europe
      • Germany
      • UK
      • France
    • APAC
      • China
      • Japan
      • India
    • Middle East and Africa
      • Saudi Arabia
      • UAE
      • South Africa
    • South America
      • Brazil
      • Argentina
      • Colombia
    • Rest of World (ROW)

By Component Insights

The software segment is estimated to witness significant growth during the forecast period.

The software segment is the cornerstone of the print management market, enabling the digital transformation of document workflows. Modern platforms, often delivered via a software as a service model, provide centralized administration for complex technology infrastructure, significantly reducing administrative overhead.

Effective information handling is achieved through workflow automation and business process automation, which can improve operational efficiency by up to 35%. These solutions offer robust security features like end-to-end encryption, which are critical for organizations looking to secure their document lifecycles.

As businesses evolve, the software component remains pivotal, providing the intelligence and control necessary to optimize print environments and enforce security policies.

Request Free Sample

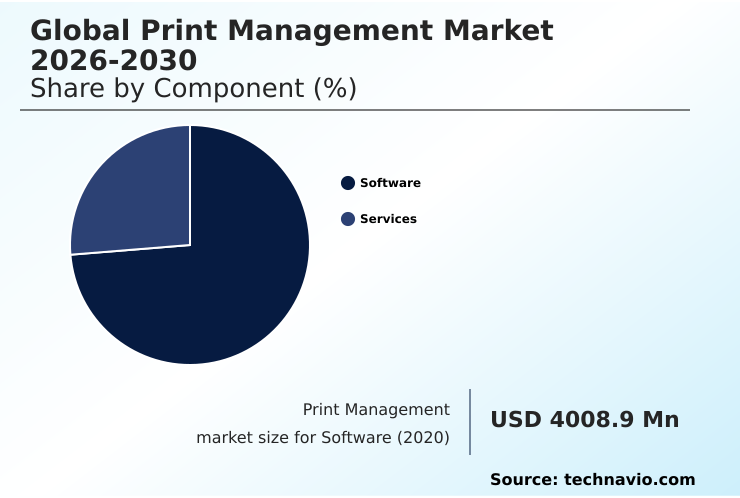
The Software segment was valued at USD 4.69 billion in 2024 and showed a gradual increase during the forecast period.

Request Free Sample

Regional Analysis

APAC is estimated to contribute 32.8% to the growth of the global market during the forecast period.Technavio’s analysts have elaborately explained the regional trends and drivers that shape the market during the forecast period.

See How Print Management Market Demand is Rising in APAC Request Free Sample

The market's geographic landscape is diverse, with North America leading in the adoption of mature technologies, contributing 24% of incremental growth.

In this region, there is a strong emphasis on zero trust network access and robust endpoint security for all connected devices. Europe focuses heavily on data privacy regulations, driving demand for secure release technology and biometric scanners to ensure compliance.

The APAC region, representing 33% of market growth, is rapidly adopting these solutions, especially in manufacturing and supply chain logistics, where electronic signatures and detailed audit trail generation are crucial.

Across all regions, better cost allocation and secure information handling remain universal goals for enterprises adopting modern print management solutions.

Market Dynamics

Our researchers analyzed the data with 2025 as the base year, along with the key drivers, trends, and challenges. A holistic analysis of drivers will help companies refine their marketing strategies to gain a competitive advantage.

  • In the evolving corporate landscape, organizations are increasingly adopting solutions from the Global Print Management Market 2026-2030 for hybrid work to address the needs of a distributed workforce. The core objective is to achieve seamless, secure, and efficient document handling regardless of employee location.
  • A key enabler is cloud print management for remote workforces, which eliminates the dependency on physical servers and provides a centralized platform for monitoring and control.
  • This transition is often coupled with the deployment of a serverless print infrastructure for cost reduction, which offers a more agile and scalable alternative to traditional on-premises systems, reducing infrastructure-related operational expenses by more than 30% compared to legacy setups. For industries handling sensitive information, such as finance and healthcare, enterprise output management software for compliance is non-negotiable.
  • These platforms provide detailed audit trails and enforce strict access controls. A critical feature within this framework is secure document release for data privacy, requiring user authentication at the device to prevent unauthorized access to confidential documents.
  • Ultimately, the goal is to leverage an automated workflow for business process optimization, integrating print and digital processes to reduce manual intervention, minimize errors, and accelerate core business functions.

What are the key market drivers leading to the rise in the adoption of Print Management Industry?

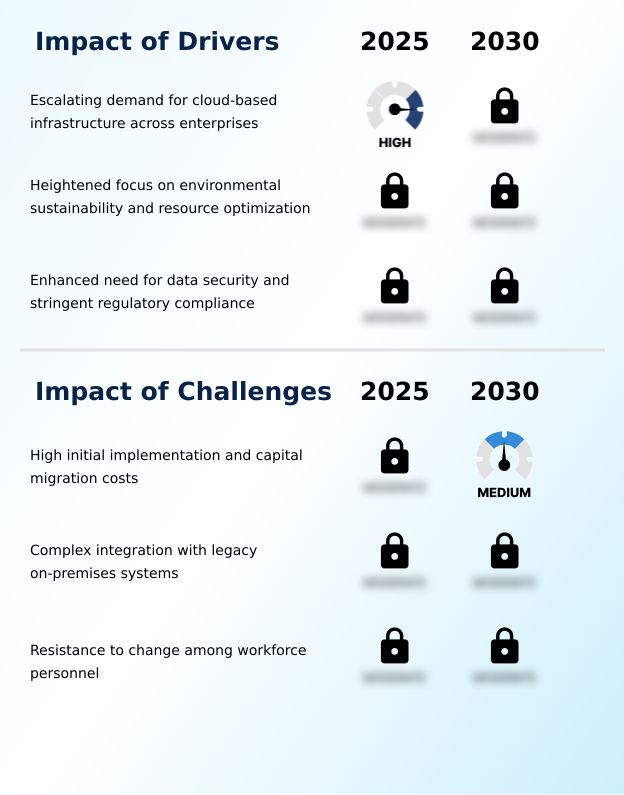
  • A primary market driver is the escalating demand for cloud-based infrastructure as enterprises seek to enhance operational efficiency and reduce capital expenditures.

  • The escalating migration to cloud-based infrastructure is a primary driver, enabling significant capital expenditure reduction and enhancing operational agility. Simultaneously, a heightened focus on environmental sustainability and resource optimization compels organizations to adopt solutions offering granular tracking of materials.
  • This aids in hardware consolidation, with some enterprises reducing their device fleet by 25%. The critical need for robust data security compliance and adherence to stringent regulatory compliance is propelling the adoption of advanced document security enforcement measures.
  • Systems featuring a rigorous user authentication protocol are now standard, ensuring that sensitive information is protected throughout its lifecycle.

What are the market trends shaping the Print Management Industry?

  • The integration of artificial intelligence and predictive analytics is emerging as a transformative trend, enabling proactive monitoring and optimization of print infrastructure.

  • Key trends are reshaping the market, led by the integration of predictive analytics for proactive maintenance, which reduces device downtime by over 30%. The adoption of managed print services is accelerating to support hybrid work environments, offering remote accessibility and enhanced security. These services are crucial for improving user adoption metrics as they simplify complex processes.
  • Advanced workflow automation, leveraging optical character recognition, is driving paperless initiatives by converting physical documents into searchable digital archiving formats. Furthermore, the demand for sophisticated mobile printing capabilities continues to grow, allowing employees to remain productive regardless of location, with organizations reporting a 15% increase in workforce agility.

What challenges does the Print Management Industry face during its growth?

  • A key challenge restraining market growth is the high initial implementation cost and financial burden associated with migrating to modern print management systems.

  • A significant challenge involves the complexity of legacy system integration, which can stall technology procurement and increase administrative overhead. Many organizations struggle to reconcile modern serverless peripheral administration with outdated infrastructure, where a lack of APIs can increase integration project timelines by over 50%. This complicates fleet management optimization and real-time device health monitoring.
  • Furthermore, concerns regarding data sovereignty and the control of print job routing can create resistance, while poor change management protocols often lead to low user adoption. Aligning new systems with long-standing corporate sustainability pledges without disrupting established workflows remains a delicate balancing act.

Exclusive Technavio Analysis on Customer Landscape

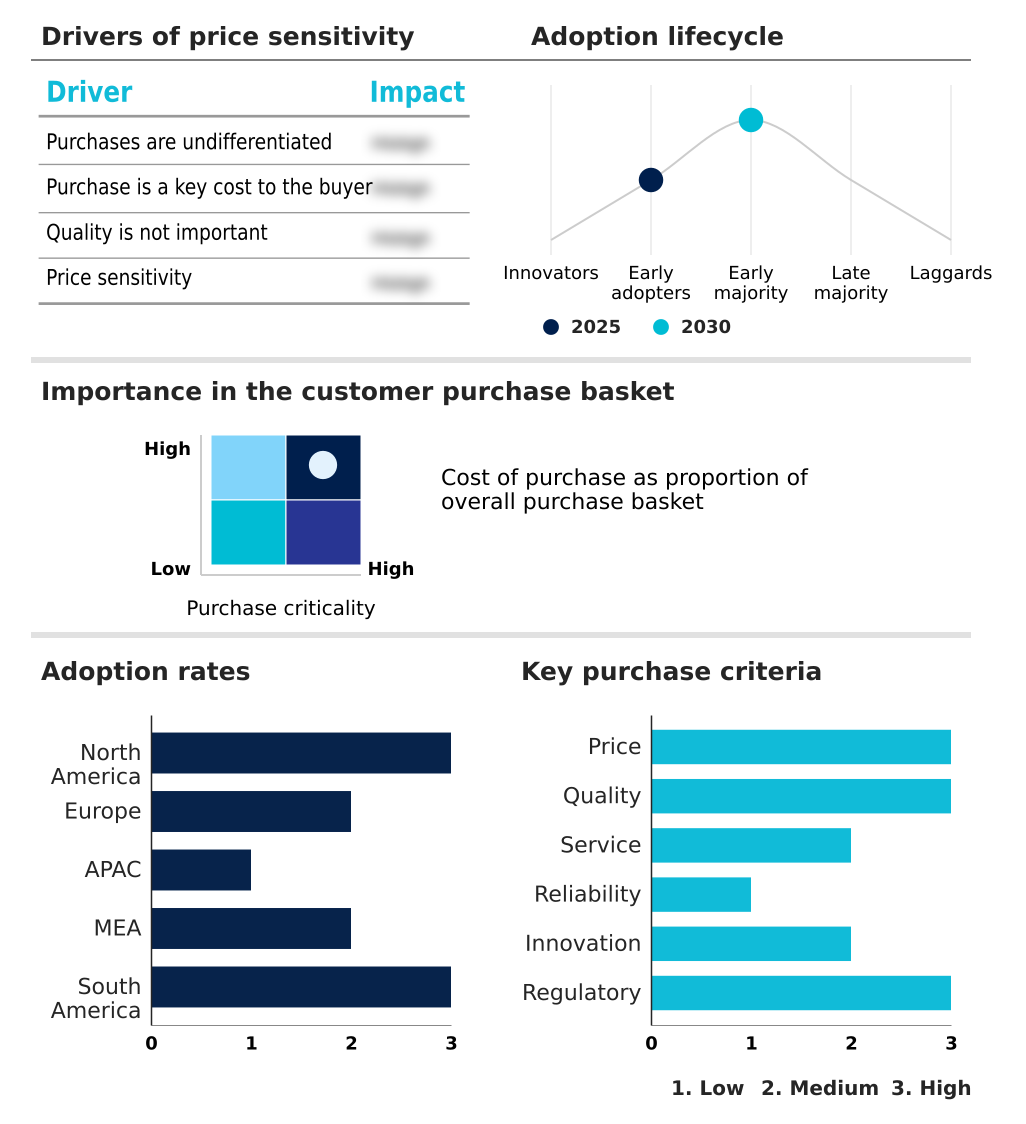
The print management market forecasting report includes the adoption lifecycle of the market, covering from the innovator’s stage to the laggard’s stage. It focuses on adoption rates in different regions based on penetration. Furthermore, the print management market report also includes key purchase criteria and drivers of price sensitivity to help companies evaluate and develop their market growth analysis strategies.

Customer Landscape of Print Management Industry

Competitive Landscape

Companies are implementing various strategies, such as strategic alliances, print management market forecast, partnerships, mergers and acquisitions, geographical expansion, and product/service launches, to enhance their presence in the industry.

Brother International Corp. - Provides secure, integrated print management solutions for enterprise fleet monitoring, user authentication, and automated document workflows.

The industry research and growth report includes detailed analyses of the competitive landscape of the market and information about key companies, including:

  • Brother International Corp.
  • Canon Inc.
  • ECI Software Solutions Inc.
  • HP Inc.
  • Konica Minolta Inc.
  • Kyocera Corp.
  • Levi Ray and Shoup Inc
  • Lexmark International Inc.
  • MyQ
  • NT-ware
  • PaperCut Software Pty Ltd
  • Pharos Systems International
  • Ricoh Co. Ltd.
  • Seiko Epson Corp.
  • ThinPrint GmbH
  • Toshiba Corp.
  • Tungsten Automation Corp.
  • Vasion
  • Xerox Holdings Corp.
  • Y Soft Corporation

Qualitative and quantitative analysis of companies has been conducted to help clients understand the wider business environment as well as the strengths and weaknesses of key industry players. Data is qualitatively analyzed to categorize companies as pure play, category-focused, industry-focused, and diversified; it is quantitatively analyzed to categorize companies as dominant, leading, strong, tentative, and weak.

Recent Development and News in Print management market

  • In August 2025, Microsoft introduced Universal Print Anywhere, also referred to as pull printing, for Microsoft 365 customers worldwide. This new feature enables users to submit print jobs from any device and securely release them at any compatible printer, enhancing flexibility and strengthening document security.
  • In July 2025, Kyocera Document Solutions announced an expansion of its partnership with Westcoast. The strengthened collaboration is aimed at enhancing the delivery of A4 print solutions through a more integrated distribution and service framework, enabling improved availability and end-to-end print management services.
  • In May 2025, the release of uniFLOW Online 2025.2 marked a significant step forward in the modernization of print management systems, delivering a range of enhancements designed to better support both end users and IT administrators.
  • In February 2025, Oracle Corporation introduced a comprehensive update to its enterprise resource planning architecture, prioritizing decentralized peripheral management across hybrid networks and validating the shift toward serverless peripheral administration.

Dive into Technavio’s robust research methodology, blending expert interviews, extensive data synthesis, and validated models for unparalleled Print Management Market insights. See full methodology.

Market Scope
Page number 296
Base year 2025
Historic period 2020-2024
Forecast period 2026-2030
Growth momentum & CAGR Accelerate at a CAGR of 5.5%
Market growth 2026-2030 USD 2004.1 million
Market structure Fragmented
YoY growth 2025-2026(%) 5.2%
Key countries US, Canada, Mexico, Germany, UK, France, Italy, Spain, The Netherlands, China, Japan, India, South Korea, Australia, Indonesia, Saudi Arabia, UAE, South Africa, Turkey, Israel, Brazil, Argentina and Colombia
Competitive landscape Leading Companies, Market Positioning of Companies, Competitive Strategies, and Industry Risks

Request Free Sample

Research Analyst Overview

  • From a research analyst's perspective, the market's trajectory is defined by a convergence of security and efficiency imperatives. The move toward cloud-based infrastructure is a fundamental redesign of enterprise document ecosystems, enabling serverless peripheral administration and advanced fleet management optimization. This digital transformation is underpinned by a focus on zero trust network access and rigorous endpoint security.
  • Core technologies such as secure release technology with user authentication protocol, including biometric scanners and electronic signatures, are becoming standard for document security enforcement. We see end-to-end encryption as table stakes. The integration of predictive analytics for device health monitoring and automated supply replenishment is driving down operational costs, with some firms achieving a 40% reduction in service calls.
  • For hybrid work environments, mobile printing capabilities are essential. The market is maturing from basic print job routing to intelligent workflow automation using optical character recognition, all managed through a centralized administration panel. However, issues of data sovereignty and hardware consolidation remain key boardroom topics.

What are the Key Data Covered in this Print Management Market Research and Growth Report?

  • What is the expected growth of the Print Management Market between 2026 and 2030?

    • USD 2.00 billion, at a CAGR of 5.5%

  • What segmentation does the market report cover?

    • The report is segmented by Component (Software, and Services), Deployment (Cloud, and On-premises), End-user (Large enterprises, and SMEs) and Geography (North America, Europe, APAC, Middle East and Africa, South America)

  • Which regions are analyzed in the report?

    • North America, Europe, APAC, Middle East and Africa and South America

  • What are the key growth drivers and market challenges?

    • Escalating demand for cloud-based infrastructure across enterprises, High initial implementation and capital migration costs

  • Who are the major players in the Print Management Market?

    • Brother International Corp., Canon Inc., ECI Software Solutions Inc., HP Inc., Konica Minolta Inc., Kyocera Corp., Levi Ray and Shoup Inc, Lexmark International Inc., MyQ, NT-ware, PaperCut Software Pty Ltd, Pharos Systems International, Ricoh Co. Ltd., Seiko Epson Corp., ThinPrint GmbH, Toshiba Corp., Tungsten Automation Corp., Vasion, Xerox Holdings Corp. and Y Soft Corporation

Market Research Insights

  • Market dynamics are shaped by the pursuit of operational efficiency and stringent regulatory compliance. The shift from capital expenditure reduction strategies to software as a service models improves cost allocation by up to 20%. To meet data privacy regulations and corporate sustainability pledges, organizations leverage solutions for environmental sustainability and resource optimization.
  • This supports better information handling and secure audit trail generation, vital for data security compliance. Technology procurement is now influenced by the ease of legacy system integration, as poor integration can increase administrative overhead. Proactive maintenance enhances supply chain logistics and reduces downtime.
  • Successful deployments hinge on strong change management protocols to drive user adoption metrics, with well-managed transitions showing a 40% higher success rate. The push for remote accessibility continues to redefine technology infrastructure.

We can help! Our analysts can customize this print management market research report to meet your requirements.

Get in touch

1. Executive Summary

1.1 Market overview

Executive Summary - Chart on Market Overview
Executive Summary - Data Table on Market Overview
Executive Summary - Chart on Global Market Characteristics
Executive Summary - Chart on Market by Geography
Executive Summary - Chart on Market Segmentation by Component
Executive Summary - Chart on Market Segmentation by Deployment
Executive Summary - Chart on Market Segmentation by End-user
Executive Summary - Chart on Incremental Growth
Executive Summary - Data Table on Incremental Growth
Executive Summary - Chart on Company Market Positioning

2. Technavio Analysis

2.1 Analysis of price sensitivity, lifecycle, customer purchase basket, adoption rates, and purchase criteria

2.2 Criticality of inputs and Factors of differentiation

Chart on Overview on criticality of inputs and factors of differentiation

2.3 Factors of disruption

Chart on Overview on factors of disruption

2.4 Impact of drivers and challenges

Chart on Impact of drivers and challenges in 2025 and 2030

3. Market Landscape

3.1 Market ecosystem

Chart on Parent Market
Data Table on - Parent Market

3.2 Market characteristics

Chart on Market characteristics analysis

3.3 Value chain analysis

Chart on Value chain analysis

4. Market Sizing

4.1 Market definition

Data Table on Offerings of companies included in the market definition

4.2 Market segment analysis

Market segments

4.3 Market size 2025

4.4 Market outlook: Forecast for 2025-2030

Chart on Global - Market size and forecast 2025-2030 ($ million)
Data Table on Global - Market size and forecast 2025-2030 ($ million)
Chart on Global Market: Year-over-year growth 2025-2030 (%)
Data Table on Global Market: Year-over-year growth 2025-2030 (%)

5. Historic Market Size

5.1 Global Print Management Market 2020 - 2024

Historic Market Size - Data Table on Global Print Management Market 2020 - 2024 ($ million)

5.2 Component segment analysis 2020 - 2024

Historic Market Size - Component Segment 2020 - 2024 ($ million)

5.3 Deployment segment analysis 2020 - 2024

Historic Market Size - Deployment Segment 2020 - 2024 ($ million)

5.4 End-user segment analysis 2020 - 2024

Historic Market Size - End-user Segment 2020 - 2024 ($ million)

5.5 Geography segment analysis 2020 - 2024

Historic Market Size - Geography Segment 2020 - 2024 ($ million)

5.6 Country segment analysis 2020 - 2024

Historic Market Size - Country Segment 2020 - 2024 ($ million)

6. Qualitative Analysis

6.1 Impact of AI on Global Print Management Market

6.2 Impact of Geopolitical Conflicts on Global Print Management Market

7. Five Forces Analysis

7.1 Five forces summary

Five forces analysis - Comparison between 2025 and 2030

7.2 Bargaining power of buyers

Bargaining power of buyers - Impact of key factors 2025 and 2030

7.3 Bargaining power of suppliers

Bargaining power of suppliers - Impact of key factors in 2025 and 2030

7.4 Threat of new entrants

Threat of new entrants - Impact of key factors in 2025 and 2030

7.5 Threat of substitutes

Threat of substitutes - Impact of key factors in 2025 and 2030

7.6 Threat of rivalry

Threat of rivalry - Impact of key factors in 2025 and 2030

7.7 Market condition

Chart on Market condition - Five forces 2025 and 2030

8. Market Segmentation by Component

8.1 Market segments

Chart on Component - Market share 2025-2030 (%)
Data Table on Component - Market share 2025-2030 (%)

8.2 Comparison by Component

Chart on Comparison by Component
Data Table on Comparison by Component

8.3 Software - Market size and forecast 2025-2030

Chart on Software - Market size and forecast 2025-2030 ($ million)
Data Table on Software - Market size and forecast 2025-2030 ($ million)
Chart on Software - Year-over-year growth 2025-2030 (%)
Data Table on Software - Year-over-year growth 2025-2030 (%)

8.4 Services - Market size and forecast 2025-2030

Chart on Services - Market size and forecast 2025-2030 ($ million)
Data Table on Services - Market size and forecast 2025-2030 ($ million)
Chart on Services - Year-over-year growth 2025-2030 (%)
Data Table on Services - Year-over-year growth 2025-2030 (%)

8.5 Market opportunity by Component

Market opportunity by Component ($ million)
Data Table on Market opportunity by Component ($ million)

9. Market Segmentation by Deployment

9.1 Market segments

Chart on Deployment - Market share 2025-2030 (%)
Data Table on Deployment - Market share 2025-2030 (%)

9.2 Comparison by Deployment

Chart on Comparison by Deployment
Data Table on Comparison by Deployment

9.3 Cloud - Market size and forecast 2025-2030

Chart on Cloud - Market size and forecast 2025-2030 ($ million)
Data Table on Cloud - Market size and forecast 2025-2030 ($ million)
Chart on Cloud - Year-over-year growth 2025-2030 (%)
Data Table on Cloud - Year-over-year growth 2025-2030 (%)

9.4 On-premises - Market size and forecast 2025-2030

Chart on On-premises - Market size and forecast 2025-2030 ($ million)
Data Table on On-premises - Market size and forecast 2025-2030 ($ million)
Chart on On-premises - Year-over-year growth 2025-2030 (%)
Data Table on On-premises - Year-over-year growth 2025-2030 (%)

9.5 Market opportunity by Deployment

Market opportunity by Deployment ($ million)
Data Table on Market opportunity by Deployment ($ million)

10. Market Segmentation by End-user

10.1 Market segments

Chart on End-user - Market share 2025-2030 (%)
Data Table on End-user - Market share 2025-2030 (%)

10.2 Comparison by End-user

Chart on Comparison by End-user
Data Table on Comparison by End-user

10.3 Large enterprises - Market size and forecast 2025-2030

Chart on Large enterprises - Market size and forecast 2025-2030 ($ million)
Data Table on Large enterprises - Market size and forecast 2025-2030 ($ million)
Chart on Large enterprises - Year-over-year growth 2025-2030 (%)
Data Table on Large enterprises - Year-over-year growth 2025-2030 (%)

10.4 SMEs - Market size and forecast 2025-2030

Chart on SMEs - Market size and forecast 2025-2030 ($ million)
Data Table on SMEs - Market size and forecast 2025-2030 ($ million)
Chart on SMEs - Year-over-year growth 2025-2030 (%)
Data Table on SMEs - Year-over-year growth 2025-2030 (%)

10.5 Market opportunity by End-user

Market opportunity by End-user ($ million)
Data Table on Market opportunity by End-user ($ million)

11. Customer Landscape

11.1 Customer landscape overview

Analysis of price sensitivity, lifecycle, customer purchase basket, adoption rates, and purchase criteria

12. Geographic Landscape

12.1 Geographic segmentation

Chart on Market share by geography 2025-2030 (%)
Data Table on Market share by geography 2025-2030 (%)

12.2 Geographic comparison

Chart on Geographic comparison
Data Table on Geographic comparison

12.3 North America - Market size and forecast 2025-2030

Chart on North America - Market size and forecast 2025-2030 ($ million)
Data Table on North America - Market size and forecast 2025-2030 ($ million)
Chart on North America - Year-over-year growth 2025-2030 (%)
Data Table on North America - Year-over-year growth 2025-2030 (%)
Chart on Regional Comparison - North America
Data Table on Regional Comparison - North America

12.3.1 US - Market size and forecast 2025-2030

Chart on US - Market size and forecast 2025-2030 ($ million)
Data Table on US - Market size and forecast 2025-2030 ($ million)
Chart on US - Year-over-year growth 2025-2030 (%)
Data Table on US - Year-over-year growth 2025-2030 (%)

12.3.2 Canada - Market size and forecast 2025-2030

Chart on Canada - Market size and forecast 2025-2030 ($ million)
Data Table on Canada - Market size and forecast 2025-2030 ($ million)
Chart on Canada - Year-over-year growth 2025-2030 (%)
Data Table on Canada - Year-over-year growth 2025-2030 (%)

12.3.3 Mexico - Market size and forecast 2025-2030

Chart on Mexico - Market size and forecast 2025-2030 ($ million)
Data Table on Mexico - Market size and forecast 2025-2030 ($ million)
Chart on Mexico - Year-over-year growth 2025-2030 (%)
Data Table on Mexico - Year-over-year growth 2025-2030 (%)

12.4 Europe - Market size and forecast 2025-2030

Chart on Europe - Market size and forecast 2025-2030 ($ million)
Data Table on Europe - Market size and forecast 2025-2030 ($ million)
Chart on Europe - Year-over-year growth 2025-2030 (%)
Data Table on Europe - Year-over-year growth 2025-2030 (%)
Chart on Regional Comparison - Europe
Data Table on Regional Comparison - Europe

12.4.1 Germany - Market size and forecast 2025-2030

Chart on Germany - Market size and forecast 2025-2030 ($ million)
Data Table on Germany - Market size and forecast 2025-2030 ($ million)
Chart on Germany - Year-over-year growth 2025-2030 (%)
Data Table on Germany - Year-over-year growth 2025-2030 (%)

12.4.2 UK - Market size and forecast 2025-2030

Chart on UK - Market size and forecast 2025-2030 ($ million)
Data Table on UK - Market size and forecast 2025-2030 ($ million)
Chart on UK - Year-over-year growth 2025-2030 (%)
Data Table on UK - Year-over-year growth 2025-2030 (%)

12.4.3 France - Market size and forecast 2025-2030

Chart on France - Market size and forecast 2025-2030 ($ million)
Data Table on France - Market size and forecast 2025-2030 ($ million)
Chart on France - Year-over-year growth 2025-2030 (%)
Data Table on France - Year-over-year growth 2025-2030 (%)

12.4.4 Italy - Market size and forecast 2025-2030

Chart on Italy - Market size and forecast 2025-2030 ($ million)
Data Table on Italy - Market size and forecast 2025-2030 ($ million)
Chart on Italy - Year-over-year growth 2025-2030 (%)
Data Table on Italy - Year-over-year growth 2025-2030 (%)

12.4.5 Spain - Market size and forecast 2025-2030

Chart on Spain - Market size and forecast 2025-2030 ($ million)
Data Table on Spain - Market size and forecast 2025-2030 ($ million)
Chart on Spain - Year-over-year growth 2025-2030 (%)
Data Table on Spain - Year-over-year growth 2025-2030 (%)

12.4.6 The Netherlands - Market size and forecast 2025-2030

Chart on The Netherlands - Market size and forecast 2025-2030 ($ million)
Data Table on The Netherlands - Market size and forecast 2025-2030 ($ million)
Chart on The Netherlands - Year-over-year growth 2025-2030 (%)
Data Table on The Netherlands - Year-over-year growth 2025-2030 (%)

12.5 APAC - Market size and forecast 2025-2030

Chart on APAC - Market size and forecast 2025-2030 ($ million)
Data Table on APAC - Market size and forecast 2025-2030 ($ million)
Chart on APAC - Year-over-year growth 2025-2030 (%)
Data Table on APAC - Year-over-year growth 2025-2030 (%)
Chart on Regional Comparison - APAC
Data Table on Regional Comparison - APAC

12.5.1 China - Market size and forecast 2025-2030

Chart on China - Market size and forecast 2025-2030 ($ million)
Data Table on China - Market size and forecast 2025-2030 ($ million)
Chart on China - Year-over-year growth 2025-2030 (%)
Data Table on China - Year-over-year growth 2025-2030 (%)

12.5.2 Japan - Market size and forecast 2025-2030

Chart on Japan - Market size and forecast 2025-2030 ($ million)
Data Table on Japan - Market size and forecast 2025-2030 ($ million)
Chart on Japan - Year-over-year growth 2025-2030 (%)
Data Table on Japan - Year-over-year growth 2025-2030 (%)

12.5.3 India - Market size and forecast 2025-2030

Chart on India - Market size and forecast 2025-2030 ($ million)
Data Table on India - Market size and forecast 2025-2030 ($ million)
Chart on India - Year-over-year growth 2025-2030 (%)
Data Table on India - Year-over-year growth 2025-2030 (%)

12.5.4 South Korea - Market size and forecast 2025-2030

Chart on South Korea - Market size and forecast 2025-2030 ($ million)
Data Table on South Korea - Market size and forecast 2025-2030 ($ million)
Chart on South Korea - Year-over-year growth 2025-2030 (%)
Data Table on South Korea - Year-over-year growth 2025-2030 (%)

12.5.5 Australia - Market size and forecast 2025-2030

Chart on Australia - Market size and forecast 2025-2030 ($ million)
Data Table on Australia - Market size and forecast 2025-2030 ($ million)
Chart on Australia - Year-over-year growth 2025-2030 (%)
Data Table on Australia - Year-over-year growth 2025-2030 (%)

12.5.6 Indonesia - Market size and forecast 2025-2030

Chart on Indonesia - Market size and forecast 2025-2030 ($ million)
Data Table on Indonesia - Market size and forecast 2025-2030 ($ million)
Chart on Indonesia - Year-over-year growth 2025-2030 (%)
Data Table on Indonesia - Year-over-year growth 2025-2030 (%)

12.6 Middle East and Africa - Market size and forecast 2025-2030

Chart on Middle East and Africa - Market size and forecast 2025-2030 ($ million)
Data Table on Middle East and Africa - Market size and forecast 2025-2030 ($ million)
Chart on Middle East and Africa - Year-over-year growth 2025-2030 (%)
Data Table on Middle East and Africa - Year-over-year growth 2025-2030 (%)
Chart on Regional Comparison - Middle East and Africa
Data Table on Regional Comparison - Middle East and Africa

12.6.1 Saudi Arabia - Market size and forecast 2025-2030

Chart on Saudi Arabia - Market size and forecast 2025-2030 ($ million)
Data Table on Saudi Arabia - Market size and forecast 2025-2030 ($ million)
Chart on Saudi Arabia - Year-over-year growth 2025-2030 (%)
Data Table on Saudi Arabia - Year-over-year growth 2025-2030 (%)

12.6.2 UAE - Market size and forecast 2025-2030

Chart on UAE - Market size and forecast 2025-2030 ($ million)
Data Table on UAE - Market size and forecast 2025-2030 ($ million)
Chart on UAE - Year-over-year growth 2025-2030 (%)
Data Table on UAE - Year-over-year growth 2025-2030 (%)

12.6.3 South Africa - Market size and forecast 2025-2030

Chart on South Africa - Market size and forecast 2025-2030 ($ million)
Data Table on South Africa - Market size and forecast 2025-2030 ($ million)
Chart on South Africa - Year-over-year growth 2025-2030 (%)
Data Table on South Africa - Year-over-year growth 2025-2030 (%)

12.6.4 Turkey - Market size and forecast 2025-2030

Chart on Turkey - Market size and forecast 2025-2030 ($ million)
Data Table on Turkey - Market size and forecast 2025-2030 ($ million)
Chart on Turkey - Year-over-year growth 2025-2030 (%)
Data Table on Turkey - Year-over-year growth 2025-2030 (%)

12.6.5 Israel - Market size and forecast 2025-2030

Chart on Israel - Market size and forecast 2025-2030 ($ million)
Data Table on Israel - Market size and forecast 2025-2030 ($ million)
Chart on Israel - Year-over-year growth 2025-2030 (%)
Data Table on Israel - Year-over-year growth 2025-2030 (%)

12.7 South America - Market size and forecast 2025-2030

Chart on South America - Market size and forecast 2025-2030 ($ million)
Data Table on South America - Market size and forecast 2025-2030 ($ million)
Chart on South America - Year-over-year growth 2025-2030 (%)
Data Table on South America - Year-over-year growth 2025-2030 (%)
Chart on Regional Comparison - South America
Data Table on Regional Comparison - South America

12.7.1 Brazil - Market size and forecast 2025-2030

Chart on Brazil - Market size and forecast 2025-2030 ($ million)
Data Table on Brazil - Market size and forecast 2025-2030 ($ million)
Chart on Brazil - Year-over-year growth 2025-2030 (%)
Data Table on Brazil - Year-over-year growth 2025-2030 (%)

12.7.2 Argentina - Market size and forecast 2025-2030

Chart on Argentina - Market size and forecast 2025-2030 ($ million)
Data Table on Argentina - Market size and forecast 2025-2030 ($ million)
Chart on Argentina - Year-over-year growth 2025-2030 (%)
Data Table on Argentina - Year-over-year growth 2025-2030 (%)

12.7.3 Colombia - Market size and forecast 2025-2030

Chart on Colombia - Market size and forecast 2025-2030 ($ million)
Data Table on Colombia - Market size and forecast 2025-2030 ($ million)
Chart on Colombia - Year-over-year growth 2025-2030 (%)
Data Table on Colombia - Year-over-year growth 2025-2030 (%)

12.8 Market opportunity by geography

Market opportunity by geography ($ million)
Data Tables on Market opportunity by geography ($ million)

13. Drivers, Challenges, and Opportunity

13.1 Market drivers

Escalating demand for cloud-based infrastructure across enterprises
Heightened focus on environmental sustainability and resource optimization
Enhanced need for data security and stringent regulatory compliance

13.2 Market challenges

High initial implementation and capital migration costs
Complex integration with legacy on-premises systems
Resistance to change among workforce personnel

13.3 Impact of drivers and challenges

Impact of drivers and challenges in 2025 and 2030

13.4 Market opportunities

Integration of artificial intelligence and predictive analytics
Adoption of managed print services for hybrid work environments
Implementation of advanced document workflow automation and digitization

14. Competitive Landscape

14.1 Overview

14.2

Overview on criticality of inputs and factors of differentiation

14.3 Landscape disruption

Overview on factors of disruption

14.4 Industry risks

Impact of key risks on business

15. Competitive Analysis

15.1 Companies profiled

Companies covered

15.2 Company ranking index

15.3 Market positioning of companies

Matrix on companies position and classification

15.4 Brother International Corp.

Brother International Corp. - Overview
Brother International Corp. - Product / Service
Brother International Corp. - Key offerings
SWOT

15.5 Canon Inc.

Canon Inc. - Overview
Canon Inc. - Business segments
Canon Inc. - Key offerings
Canon Inc. - Segment focus
SWOT

15.6 HP Inc.

HP Inc. - Overview
HP Inc. - Business segments
HP Inc. - Key news
HP Inc. - Key offerings
HP Inc. - Segment focus
SWOT

15.7 Konica Minolta Inc.

Konica Minolta Inc. - Overview
Konica Minolta Inc. - Business segments
Konica Minolta Inc. - Key offerings
Konica Minolta Inc. - Segment focus
SWOT

15.8 Kyocera Corp.

Kyocera Corp. - Overview
Kyocera Corp. - Business segments
Kyocera Corp. - Key offerings
Kyocera Corp. - Segment focus
SWOT

15.9 Levi Ray and Shoup Inc

Levi Ray and Shoup Inc - Overview
Levi Ray and Shoup Inc - Product / Service
Levi Ray and Shoup Inc - Key offerings
SWOT

15.10 Lexmark International Inc.

Lexmark International Inc. - Overview
Lexmark International Inc. - Product / Service
Lexmark International Inc. - Key offerings
SWOT

15.11 MyQ

MyQ - Overview
MyQ - Product / Service
MyQ - Key offerings
SWOT

15.12 PaperCut Software Pty Ltd

PaperCut Software Pty Ltd - Overview
PaperCut Software Pty Ltd - Product / Service
PaperCut Software Pty Ltd - Key offerings
SWOT

15.13 Pharos Systems International

Pharos Systems International - Overview
Pharos Systems International - Product / Service
Pharos Systems International - Key offerings
SWOT

15.14 Ricoh Co. Ltd.

Ricoh Co. Ltd. - Overview
Ricoh Co. Ltd. - Business segments
Ricoh Co. Ltd. - Key offerings
Ricoh Co. Ltd. - Segment focus
SWOT

15.15 Tungsten Automation Corp.

Tungsten Automation Corp. - Overview
Tungsten Automation Corp. - Product / Service
Tungsten Automation Corp. - Key offerings
SWOT

15.16 Vasion

Vasion - Overview
Vasion - Product / Service
Vasion - Key offerings
SWOT

15.17 Xerox Holdings Corp.

Xerox Holdings Corp. - Overview
Xerox Holdings Corp. - Business segments
Xerox Holdings Corp. - Key offerings
Xerox Holdings Corp. - Segment focus
SWOT

15.18 Y Soft Corporation

Y Soft Corporation - Overview
Y Soft Corporation - Product / Service
Y Soft Corporation - Key offerings
SWOT

16. Appendix

16.1 Scope of the report

Market definition
Objectives
Notes and caveats

16.2 Inclusions and exclusions checklist

Inclusions checklist
Exclusions checklist

16.3 Currency conversion rates for US$

16.4 Research methodology

16.5 Data procurement

Information sources

16.6 Data validation

16.7 Validation techniques employed for market sizing

16.8 Data synthesis

16.9 360 degree market analysis

16.10 List of abbreviations

Research Methodology

Technavio presents a detailed picture of the market by way of study, synthesis, and summation of data from multiple sources. The analysts have presented the various facets of the market with a particular focus on identifying the key industry influencers. The data thus presented is comprehensive, reliable, and the result of extensive research, both primary and secondary.

INFORMATION SOURCES

Primary sources

  • Manufacturers and suppliers
  • Channel partners
  • Industry experts
  • Strategic decision makers

Secondary sources

  • Industry journals and periodicals
  • Government data
  • Financial reports of key industry players
  • Historical data
  • Press releases

DATA ANALYSIS

Data Synthesis

  • Collation of data
  • Estimation of key figures
  • Analysis of derived insights

Data Validation

  • Triangulation with data models
  • Reference against proprietary databases
  • Corroboration with industry experts

REPORT WRITING

Qualitative

  • Market drivers
  • Market challenges
  • Market trends
  • Five forces analysis

Quantitative

  • Market size and forecast
  • Market segmentation
  • Geographical insights
  • Competitive landscape

Interested in this report?

Get your sample now to see our research methodology and insights!

Download Now

Frequently Asked Questions

Print Management market growth will increase by USD 2004.1 million during 2026-2030.

The Print Management market is expected to grow at a CAGR of 5.5% during 2026-2030.

Print Management market is segmented by Component (Software, Services) Deployment (Cloud, On-premises) End-user (Large enterprises, SMEs)

Brother International Corp., Canon Inc., ECI Software Solutions Inc., HP Inc., Konica Minolta Inc., Kyocera Corp., Levi Ray and Shoup Inc, Lexmark International Inc., MyQ, NT-ware, PaperCut Software Pty Ltd, Pharos Systems International, Ricoh Co. Ltd., Seiko Epson Corp., ThinPrint GmbH, Toshiba Corp., Tungsten Automation Corp., Vasion, Xerox Holdings Corp., Y Soft Corporation are a few of the key vendors in the Print Management market.

APAC will register the highest growth rate of 32.8% among the other regions. Therefore, the Print Management market in APAC is expected to garner significant business opportunities for the vendors during the forecast period.

US, Canada, Mexico, Germany, UK, France, Italy, Spain, The Netherlands, China, Japan, India, South Korea, Australia, Indonesia, Saudi Arabia, UAE, South Africa, Turkey, Israel, Brazil, Argentina, Colombia

  • Escalating demand for cloud-based infrastructure across enterprises is the driving factor this market.

The Print Management market vendors should focus on grabbing business opportunities from the Component segment as it accounted for the largest market share in the base year.
RIA - Research AI Assistant
Ask RIA