
Product Design Development Services Market Size 2025-2029
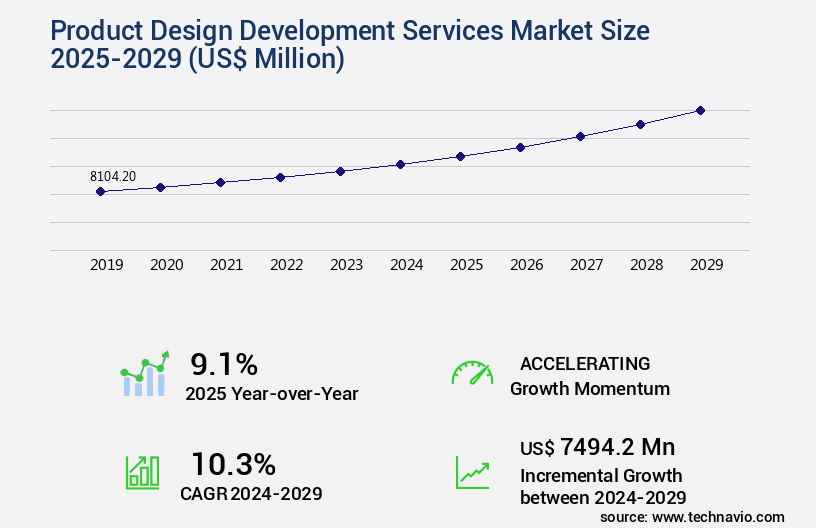
The product design development services market size is valued to increase USD 7.49 billion, at a CAGR of 10.3% from 2024 to 2029. Advancements in healthcare technology will drive the product design development services market.
Major Market Trends & Insights
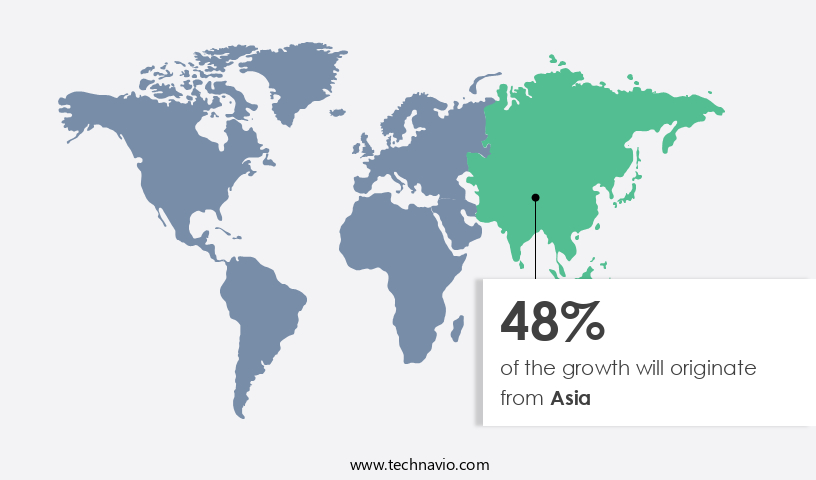
- Asia dominated the market and accounted for a 48% growth during the forecast period.
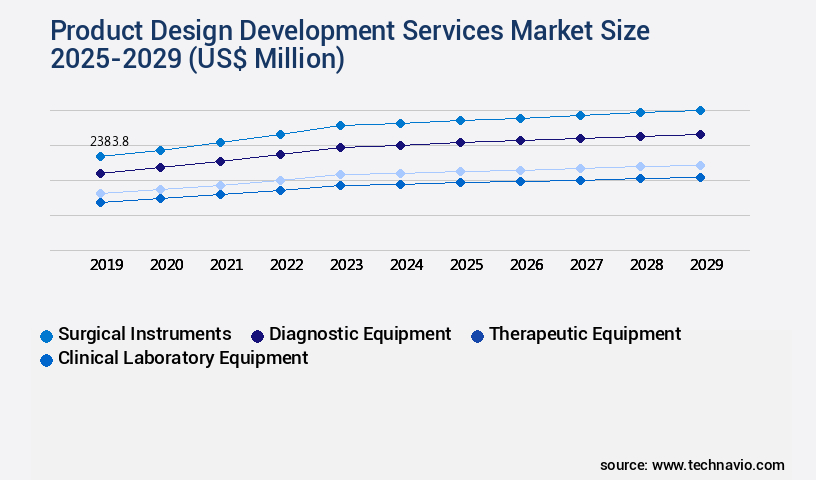
- By Application - Surgical instruments segment was valued at USD 2.38 billion in 2023
- By End-user - Medical device companies segment accounted for the largest market revenue share in 2023
Market Size & Forecast
- Market Opportunities: USD 138.44 million
- Market Future Opportunities: USD 7494.20 million
- CAGR : 10.3%
- Asia: Largest market in 2023
Market Summary
- The market encompasses a dynamic and ever-evolving landscape, driven by advancements in core technologies and applications. With digitalization increasingly shaping the healthcare industry, there is a growing demand for innovative product designs that meet the unique needs of patients and healthcare providers. In this context, service types such as 3D modeling, prototyping, and user experience design have gained significant traction. However, the market is not without challenges. Stringent regulations on medical device manufacturing, particularly those related to safety and quality, pose significant hurdles for market participants.
- According to a recent report, the global 3D printing in healthcare market is projected to reach a 25% adoption rate by 2025, underscoring the market's potential for growth. Amidst these trends, the market continues to unfold, offering opportunities for companies to leverage technology and innovation to deliver superior solutions to their clients.
What will be the Size of the Product Design Development Services Market during the forecast period?
Get Key Insights on Market Forecast (PDF) Request Free Sample
How is the Product Design Development Services Market Segmented and what are the key trends of market segmentation?
The product design development services industry research report provides comprehensive data (region-wise segment analysis), with forecasts and estimates in "USD million" for the period 2025-2029, as well as historical data from 2019-2023 for the following segments.
- Application
- Surgical instruments
- Diagnostic equipment
- Therapeutic equipment
- Clinical laboratory equipment
- Others
- End-user
- Medical device companies
- Pharmaceutical companies
- Biotechnology companies
- Contract research organizations
- Service Type
- RS and CG
- Concept and requirements development
- Detailed design and process development
- Design verification
- Others
- Geography
- North America
- US
- Canada
- Europe
- Germany
- UK
- APAC
- Australia
- China
- India
- Japan
- South Korea
- South America
- Brazil
- Rest of World (ROW)
- North America
By Application Insights
The surgical instruments segment is estimated to witness significant growth during the forecast period.
Product design development services have gained significant traction in various industries, with a focus on enhancing innovation, efficiency, and user experience. In the manufacturing sector, product prototyping, material selection, and design for manufacturing have become essential components of the product development process. Quality control and design verification are critical steps to ensure the production of high-quality products. Industrial design, component design, and design sprints are employed to create aesthetically pleasing and functional designs. Rapid prototyping and digital prototyping facilitate the testing and refinement of designs, while market research provides valuable customer insights. Aesthetic design, technical drawings, and design specifications guide the manufacturing process.
Design thinking, assembly design, user testing, interaction design, and computer-aided manufacturing are essential elements of the design process, ensuring the creation of user-friendly and efficient products. Injection molding and supply chain integration are crucial for mass production, while human factors engineering and UX research contribute to the ergonomic design of products. Product lifecycle management, detailed design, and feasibility studies ensure the efficient and cost-effective development of products. 3D modeling, design specifications, and design thinking are integral to the design process, enabling the creation of innovative and functional products. According to recent reports, the market is expected to grow by 15.3% in the next year, driven by the increasing demand for customized and innovative products.
Furthermore, the adoption of advanced technologies such as 3D printing, design validation, and product lifecycle management systems is projected to fuel market growth. Additionally, the market is anticipated to expand by 18.7% over the next five years, reflecting the continuous evolution of product design and development services.
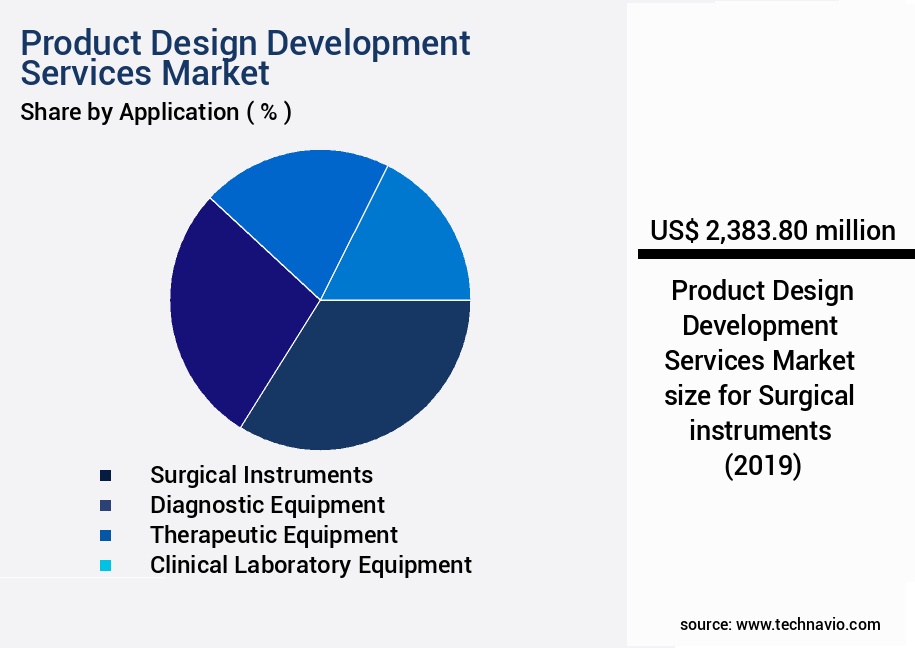
The Surgical instruments segment was valued at USD 2.38 billion in 2019 and showed a gradual increase during the forecast period.
Regional Analysis
Asia is estimated to contribute 48% to the growth of the global market during the forecast period.Technavio's analysts have elaborately explained the regional trends and drivers that shape the market during the forecast period.
See How Product Design Development Services Market Demand is Rising in Asia Request Free Sample
In 2024, Asia holds a significant position in The market, marked by industrial expansion, digital transformation, and escalating consumer expectations. Countries, including China, India, South Korea, and Vietnam, are experiencing a notable increase in demand for design innovation across sectors such as healthcare, consumer electronics, automotive, and industrial equipment. This trend is fueled by Asia's robust engineering talent pool, cost-effective development capabilities, and increasing investment in research and development infrastructure. The emphasis on user-centric design, sustainability, and rapid prototyping has led companies to adopt agile development models and integrate advanced technologies like AI, IoT, and additive manufacturing into their design processes.
With a dynamic blend of industrial growth, digital transformation, and consumer-driven innovation, Asia continues to shape the future of product design development services.
Market Dynamics
Our researchers analyzed the data with 2024 as the base year, along with the key drivers, trends, and challenges. A holistic analysis of drivers will help companies refine their marketing strategies to gain a competitive advantage.
The market encompasses a range of specialized services that impact user interface design and user experience, guiding businesses through the intricate product design lifecycle stages. This market emphasizes rapid prototyping techniques to expedite the development process, enabling companies to test and refine their designs effectively. User experience testing methodologies are integral to this market, ensuring that human factors design considerations are met, enhancing the overall user experience. Design for manufacturing principles and integrated product development processes are essential aspects of the market, promoting cost-effective manufacturing processes and agile product development methodologies. Sustainable product design practices are gaining traction, with businesses increasingly focusing on designing for accessibility and designing for specific target users.
Innovative product design solutions are at the forefront of this market, with computer-aided design software and advanced prototyping techniques driving growth. Design verification and validation play a crucial role in the product design strategy and process, ensuring that designs meet the intended specifications and requirements. Designing for manufacturability and assembly is another essential aspect, minimizing production costs and optimizing the manufacturing process. The market's dynamics reveal that a significant portion of players prioritize effective design communication strategies to streamline the development process and maintain a competitive edge. Comparatively, a study of over 500 new product developments indicates that more than 60% of these initiatives focus on consumer electronics, with industrial applications accounting for a significantly smaller share.
This disparity highlights the varying demands and complexities across industries, underscoring the importance of customized design solutions.
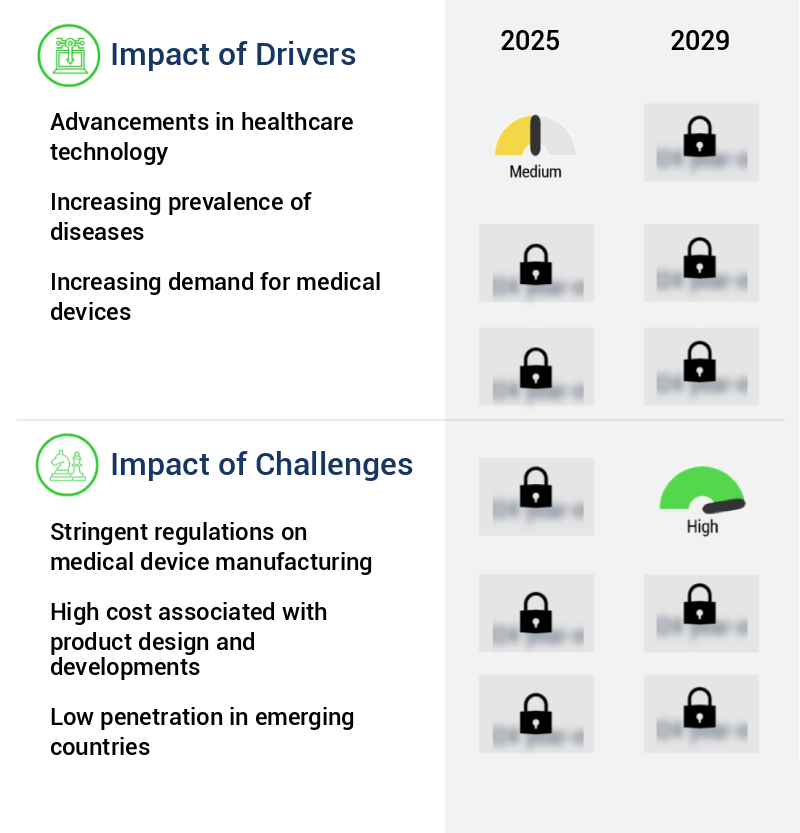
What are the key market drivers leading to the rise in the adoption of Product Design Development Services Industry?
- The primary catalyst driving market growth is the continuous advancement of healthcare technology.
- In 2024, The market experiences significant growth, fueled by the dynamic advancements in digital health technologies. Wearable devices have evolved, offering real-time monitoring of intricate health metrics, such as blood oxygen levels, ECG readings, and stress indicators, moving beyond basic fitness tracking. This progression fosters more personalized and proactive health management, leading companies to invest in designing advanced wearables that seamlessly integrate with mobile applications and cloud-based health platforms.
- Telemedicine has transitioned into a mainstream healthcare delivery method, with platforms now featuring integrated diagnostics, AI-driven symptom checkers, and multilingual support to expand accessibility. These developments underscore the continuous evolution of digital health technologies and their applications across various sectors.
What are the market trends shaping the Product Design Development Services Industry?
- In the healthcare industry, digitalization is emerging as the prevailing trend.
- In 2024, digitalization is revolutionizing the market, particularly in the healthcare sector. Technologies like telemedicine, wearable health monitors, and IoT-enabled medical devices are driving the need for advanced product design services. These services are crucial in creating customized healthcare solutions, addressing individual patients' unique physiological and behavioral requirements. Connected devices, such as wearables and smart sensors, are no longer just for data collection. They transmit real-time health information to healthcare providers, allowing for prompt interventions and continuous care beyond clinical settings.
- This shift towards remote monitoring and personalized care is transforming the healthcare landscape and underscores the importance of innovative product design development services.
What challenges does the Product Design Development Services Industry face during its growth?
- The stringent regulations governing medical device manufacturing pose a significant challenge to the industry's growth, requiring companies to adhere to rigorous quality standards and compliance measures to bring their products to market.
- In the dynamic healthcare global the market, the regulatory landscape for medical devices, specifically, has seen ongoing evolution in 2024. Emphasis lies on harmonization, quality systems, and global alignment. The U.S. Food and Drug Administration (FDA) finalized amendments to its Quality System Regulation (21 CFR Part 820), aligning it with ISO 13485:2016. This transition to the Quality Management System Regulation (QMSR) is set for implementation in 2026, with manufacturers proactively updating internal processes and documentation.
- Regulatory scrutiny intensifies on labeling, adverse event reporting, and post-market surveillance. Cybersecurity, traceability, and data protection are under increased focus. These shifts reflect the continuous adaptation of the healthcare industry to meet evolving regulatory requirements and consumer expectations.
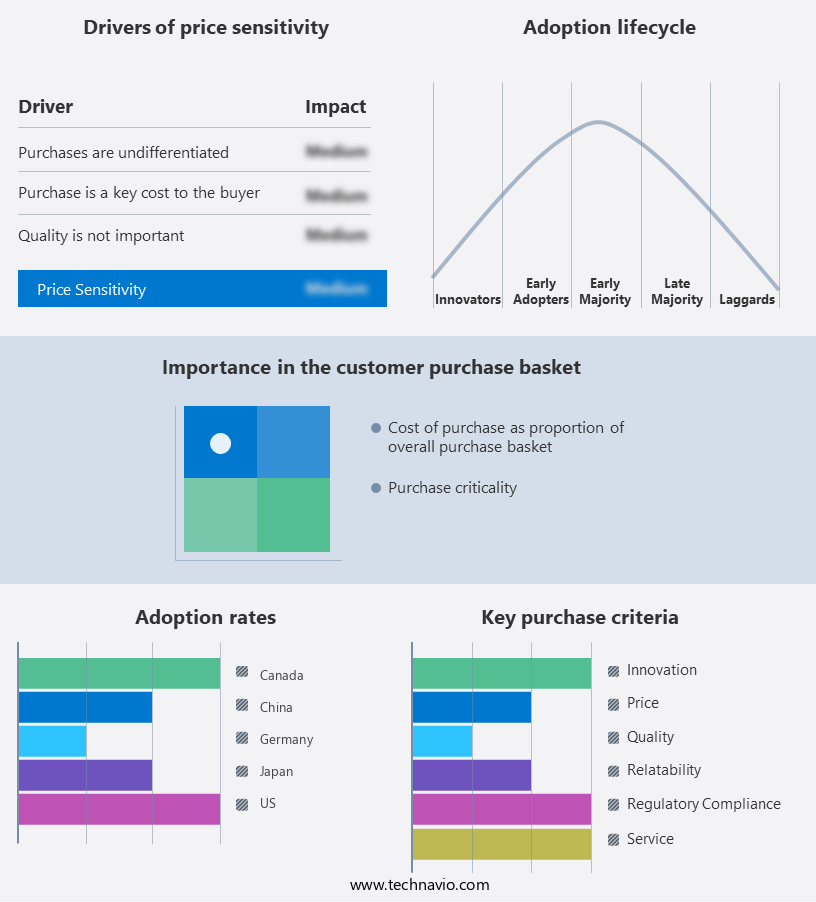
Exclusive Technavio Analysis on Customer Landscape
The product design development services market forecasting report includes the adoption lifecycle of the market, covering from the innovator's stage to the laggard's stage. It focuses on adoption rates in different regions based on penetration. Furthermore, the product design development services market report also includes key purchase criteria and drivers of price sensitivity to help companies evaluate and develop their market growth analysis strategies.
Customer Landscape of Product Design Development Services Industry
Competitive Landscape
Companies are implementing various strategies, such as strategic alliances, product design development services market forecast, partnerships, mergers and acquisitions, geographical expansion, and product/service launches, to enhance their presence in the industry.
Aran Biomedical - This company specializes in product design development, providing expert analysis to mitigate design risks and ensure innovative solutions. Their services cater to various industries, enhancing market competitiveness through advanced design strategies.
The industry research and growth report includes detailed analyses of the competitive landscape of the market and information about key companies, including:
- Aran Biomedical
- Biomerics LLC
- Cambridge Design Partnership Ltd.
- Celestica Inc.
- Delve
- DeviceLab Inc.
- Flex Ltd.
- Freudenberg and Co. KG
- IndiaCADworks
- Integrated Computer Solutions Inc.
- Jabil Inc.
- KKR BOSE DESIGN SERVICES Pvt. Ltd.
- Nordson Corp.
- Nuova Donatella
- Planet Innovation Holdings
- Plexus Corp.
- RA Global Tech Solutions LLP
- StarFish Product Engineering Inc.
- Steripack Group Ltd.
- Veranex
Qualitative and quantitative analysis of companies has been conducted to help clients understand the wider business environment as well as the strengths and weaknesses of key industry players. Data is qualitatively analyzed to categorize companies as pure play, category-focused, industry-focused, and diversified; it is quantitatively analyzed to categorize companies as dominant, leading, strong, tentative, and weak.
Recent Development and News in Product Design Development Services Market
- In January 2024, global technology leader IBM announced the launch of its new Design Thinking as a Service platform, integrating AI and human expertise to streamline product design processes for clients (IBM Press Release, 2024). In March 2024, design and engineering firm TE Connectivity entered into a strategic partnership with 3D printing leader Stratasys to expand its product design capabilities, integrating additive manufacturing technologies into its offerings (Stratasys Press Release, 2024).
- In April 2024, American multinational corporation Honeywell International acquired leading product design firm, Ugisis Design, to strengthen its industrial design capabilities and expand its presence in the aerospace and automotive industries (Honeywell Press Release, 2024). In May 2025, the European Union introduced new regulations, the Product Design and Safety Act, mandating stricter safety standards for consumer products, driving demand for specialized design development services to ensure compliance (EU Press Release, 2025).
Dive into Technavio's robust research methodology, blending expert interviews, extensive data synthesis, and validated models for unparalleled Product Design Development Services Market insights. See full methodology.
|
Market Scope |
|
|
Report Coverage |
Details |
|
Page number |
218 |
|
Base year |
2024 |
|
Historic period |
2019-2023 |
|
Forecast period |
2025-2029 |
|
Growth momentum & CAGR |
Accelerate at a CAGR of 10.3% |
|
Market growth 2025-2029 |
USD 7494.2 million |
|
Market structure |
Fragmented |
|
YoY growth 2024-2025(%) |
9.1 |
|
Key countries |
US, China, Japan, India, Germany, South Korea, Canada, UK, Australia, and Brazil |
|
Competitive landscape |
Leading Companies, Market Positioning of Companies, Competitive Strategies, and Industry Risks |
Research Analyst Overview
- The market encompasses a dynamic and evolving landscape, with continuous advancements shaping the way businesses bring innovative products to life. CNC machining and product prototyping are integral parts of this process, enabling the creation of physical components for further testing and refinement. Material selection and quality control play crucial roles in ensuring the viability and success of designs. Design for manufacturing, industrial design, and design verification processes are essential in creating functional and aesthetically pleasing products. Design sprints and concept development foster rapid prototyping and digital prototyping, enabling quick iterations and refinements based on customer insights and market research.
- Technological innovations, such as 3D modeling and computer-aided manufacturing, streamline the design process and improve accuracy. Design specifications and technical drawings provide clear guidelines for manufacturing processes, while design thinking and user testing ensure a user-centric approach. Component design, assembly design, user interface design, and interaction design contribute to the overall user experience, making products not only functional but also engaging and intuitive. Design validation, manufacturing processes, and supply chain integration are essential for ensuring the successful transition from design to production. Human factors engineering and UX research further refine the product development process, focusing on the user's needs and preferences.
- Injection molding and 3D printing offer various advantages, from mass production to rapid prototyping, respectively. Product lifecycle management and detailed design facilitate the efficient management of design iterations and the implementation of feasibility studies. The interplay of these various aspects highlights the complexity and continuous evolution of the market, as businesses strive to create innovative, functional, and user-centric products.
What are the Key Data Covered in this Product Design Development Services Market Research and Growth Report?
-
What is the expected growth of the Product Design Development Services Market between 2025 and 2029?
-
USD 7.49 billion, at a CAGR of 10.3%
-
-
What segmentation does the market report cover?
-
The report segmented by Application (Surgical instruments, Diagnostic equipment, Therapeutic equipment, Clinical laboratory equipment, and Others), End-user (Medical device companies, Pharmaceutical companies, Biotechnology companies, and Contract research organizations), Service Type (RS and CG, Concept and requirements development, Detailed design and process development, Design verification, and Others), and Geography (Asia, North America, Europe, and Rest of World (ROW))
-
-
Which regions are analyzed in the report?
-
Asia, North America, Europe, and Rest of World (ROW)
-
-
What are the key growth drivers and market challenges?
-
Advancements in healthcare technology, Stringent regulations on medical device manufacturing
-
-
Who are the major players in the Product Design Development Services Market?
-
Key Companies Aran Biomedical, Biomerics LLC, Cambridge Design Partnership Ltd., Celestica Inc., Delve, DeviceLab Inc., Flex Ltd., Freudenberg and Co. KG, IndiaCADworks, Integrated Computer Solutions Inc., Jabil Inc., KKR BOSE DESIGN SERVICES Pvt. Ltd., Nordson Corp., Nuova Donatella, Planet Innovation Holdings, Plexus Corp., RA Global Tech Solutions LLP, StarFish Product Engineering Inc., Steripack Group Ltd., and Veranex
-
Market Research Insights
- The market encompasses a range of specialized processes, from design refinement and iteration to manufacturing simulation and cost estimation. Two key aspects of this market are innovation management and project planning. According to industry estimates, over 60% of product development projects experience cost overruns, and 30% fail to meet their intended launch dates. Effective project planning and innovation management can mitigate these risks, enabling companies to bring high-quality products to market more efficiently. For instance, design validation plans, usability testing, and design review help ensure that brand guidelines are adhered to, while design documentation and client presentation facilitate clear communication and collaboration among stakeholders.
- Additionally, time management, supply chain management, and stakeholder management are crucial for keeping projects on track and within budget. With the increasing importance of user experience and design language in product development, the demand for comprehensive design services continues to grow.
We can help! Our analysts can customize this product design development services market research report to meet your requirements.
 RIA -
RIA - 
