
Singapore Real Estate Market Size 2025-2029
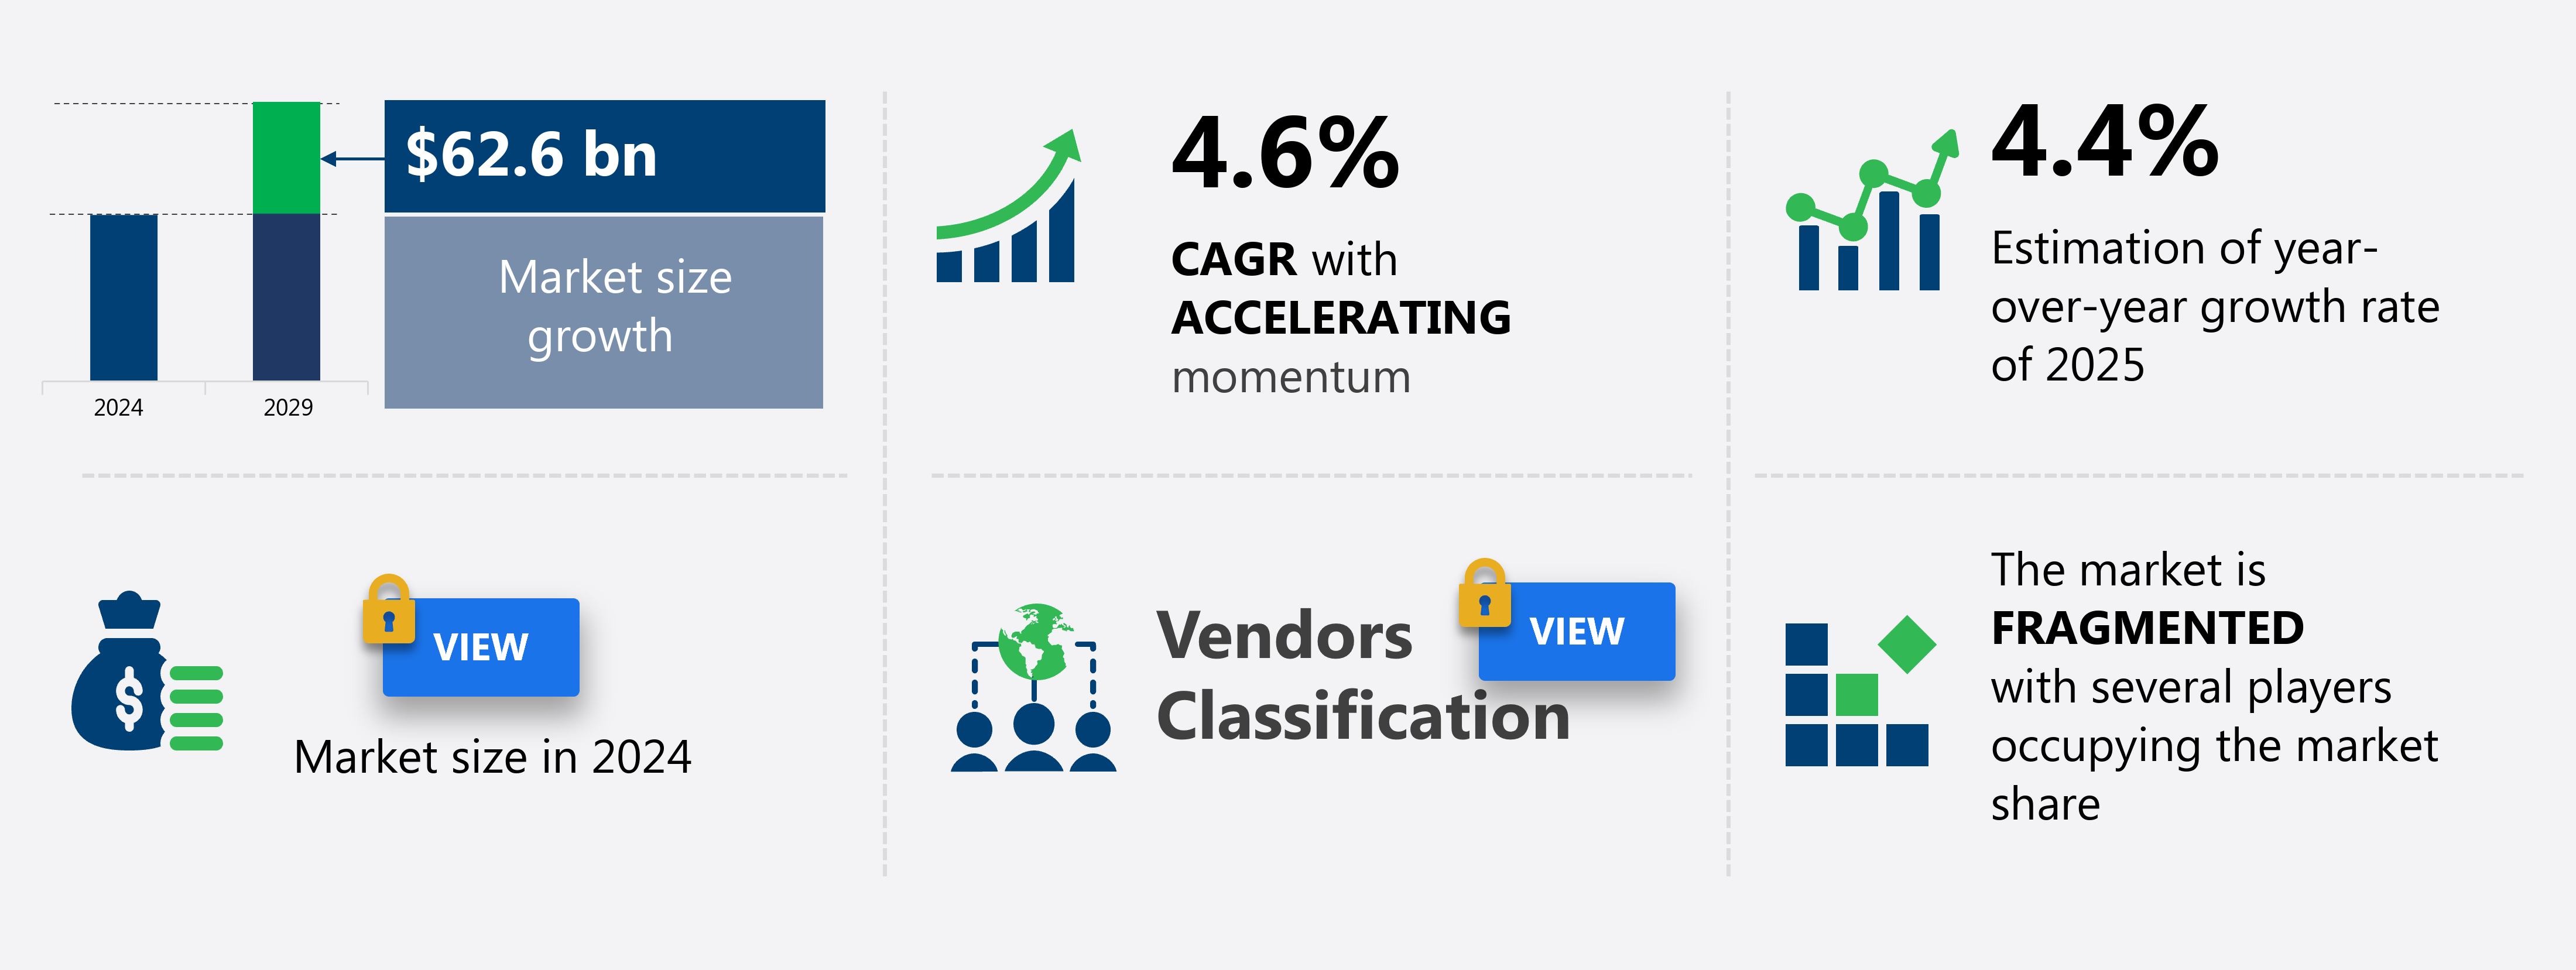
The singapore real estate market size is forecast to increase by USD 62.6 billion at a CAGR of 4.6% between 2024 and 2029.
- The market is witnessing significant growth, driven primarily by the burgeoning demand for industrial infrastructure. This trend is fueled by the country's status as a global business hub, attracting numerous multinational corporations seeking to establish a presence. Concurrently, marketing initiatives in the real estate industry are gaining momentum, with developers increasingly adopting innovative strategies to differentiate their offerings and cater to diverse customer segments. However, this market landscape is not without challenges. Regulatory uncertainty looms large, with ongoing debates surrounding potential changes to property cooling measures and land use regulations.
- These uncertainties could deter investors and developers, potentially hindering market growth. As such, navigating the complex regulatory environment and staying abreast of policy developments will be crucial for companies looking to capitalize on opportunities and mitigate risks in the Singapore Real Estate market.
What will be the size of the Singapore Real Estate Market during the forecast period?
Explore in-depth regional segment analysis with market size data - historical 2019-2023 and forecasts 2025-2029 - in the full report.
Request Free Sample
- The Singapore real estate market exhibits dynamic activity in various sectors. The sub-sale market experiences continuous fluctuations, influenced by property valuation models and market forecasting. Property law plays a crucial role in real estate financing and collective sales, including en bloc and strata title transactions. Property investment funds and real estate syndication provide financing options for freehold and leasehold properties.
- Real estate litigation arises from property disputes, necessitating ethical conduct in property management services. Proptech adoption streamlines property search engines and portfolio management, while property tax incentives stimulate investment. Rental management services and property insurance mitigate risks in the diverse real estate landscape. Property market trends encompass master plans, property crowdfunding, and real estate marketing strategies.
How is this market segmented?
The market research report provides comprehensive data (region-wise segment analysis), with forecasts and estimates in "USD billion" for the period 2025-2029, as well as historical data from 2019-2023 for the following segments.
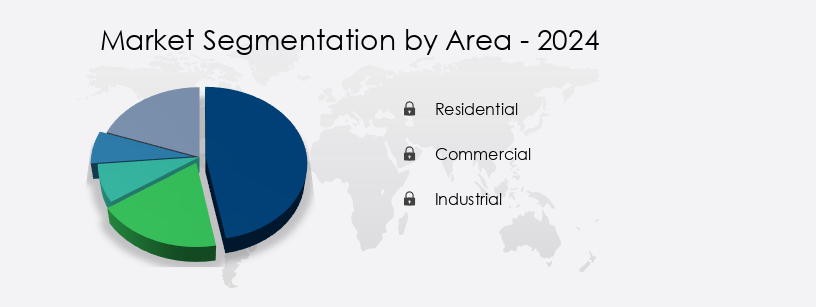
- Area
- Residential
- Commercial
- Industrial
- Mode Of Booking
- Sales
- Rental and lease
- Type
- Landed houses and villas
- Office space
- Apartments and condominiums
- Store space
- Others
- Price
- Mid-tier
- Entry-level
- Luxury
- Geography
- APAC
- Singapore
- APAC
By Area Insights
The residential segment is estimated to witness significant growth during the forecast period.
The Singapore real estate market encompasses various sectors, including residential, commercial, and industrial properties. The residential segment, comprised of apartments, condominiums, single-family homes, and other living arrangements, experiences significant demand due to population growth and the country's robust economy. Urban renewal projects and sustainable development initiatives contribute to the transformation of the property market. Commercial real estate, including office buildings and retail spaces, benefit from the thriving economy and increasing business activities. Property management companies employ technology, such as virtual and augmented reality, to enhance the property buying and selling experience. Real estate investment trusts and funds provide opportunities for investors seeking capital appreciation and rental income.
Property prices have been on an upward trend due to high demand and limited supply, with vacancy rates remaining relatively low. Property taxes, stamp duty, and government policies influence the market dynamics. Urban planning and infrastructure development are essential for economic growth and smart city initiatives. Real estate developers and proptech startups leverage technology, including artificial intelligence and big data, to streamline property transactions and enhance property management. The rental market, property valuation, and property development are shaped by various factors, including rental yield, housing affordability, and market sentiment. Land use planning and regulations play a crucial role in shaping the real estate landscape.
Capital appreciation and rental income continue to attract investors to the market, with mortgage rates influencing affordability. Smart home technologies and green building standards add value to both residential and commercial properties.
The Residential segment was valued at USD 100.30 billion in 2019 and showed a gradual increase during the forecast period.
Market Dynamics
Our researchers analyzed the data with 2024 as the base year, along with the key drivers, trends, and challenges. A holistic analysis of drivers will help companies refine their marketing strategies to gain a competitive advantage.
What are the Singapore Real Estate Market market drivers leading to the rise in adoption of the Industry?
- The surge in demand for industrial infrastructure is the primary catalyst fueling market growth in Singapore.
- The market is experiencing significant growth due to the increasing demand for industrial infrastructure. This demand encourages real estate investment in industrial properties, as part of portfolio diversification. Singapore's business environment is highly attractive, characterized by political stability, strong governance, and business-friendly policies. The government's support for foreign investment, innovation, and entrepreneurship further entices businesses to establish industrial facilities in the country. Singapore's advanced infrastructure, including world-class ports, airports, and transportation networks, ensures efficient logistics and connectivity, making it an ideal location for industrial activities. For instance, the Refundable Investment Credit (RIC) incentive, launched by the Singapore government in 2024, aims to encourage companies to engage in substantial and high-value economic activities within the country.
- Urban planning plays a crucial role in the real estate market, with property developers focusing on creating immersive and harmonious living and working spaces. Property technology (proptech) innovations, including artificial intelligence (AI) and proptech startups, are transforming the property market by streamlining property valuation, rental market management, and property market outlook analysis.
What are the Singapore Real Estate Market market trends shaping the Industry?
- The real estate industry is witnessing an upward trend towards enhanced marketing initiatives. This includes the implementation of innovative marketing strategies and technologies to attract and engage potential buyers and tenants.
- The market is characterized by rigorous land use planning, stringent property regulations, and continuous infrastructure development. The government's emphasis on creating smart cities and sustainable living spaces drives property development, attracting both local and foreign investors. Property taxes are levied on owners based on the annual value of their properties, encouraging efficient use and capital appreciation. Technological innovations, such as blockchain technology, are increasingly adopted for secure and transparent real estate transactions. Big data analysis is used to monitor vacancy rates and market trends, providing valuable insights for property investors and developers. HDB flats and executive condominiums are popular housing options for locals, while property auctions offer opportunities for acquiring properties at competitive prices.
- Singapore's economic growth and stable political climate create a favorable environment for real estate investments. Companies in the market employ integrated marketing communication strategies to reach potential buyers, utilizing various channels like newspapers, magazines, social media, TV advertisements, and interactive websites. With a high internet penetration rate of 96%, Singaporeans are tech-savvy and increasingly rely on the internet for their real estate needs. In conclusion, the market remains a dynamic and attractive investment destination, driven by strategic planning, technological innovation, and a robust regulatory framework.
How does Singapore Real Estate Market market faces challenges face during its growth?
- The real estate industry faces significant growth challenges due to regulatory uncertainty, which introduces a level of instability and ambiguity that can deter investment and hinder industry expansion.
- In Singapore's real estate market, smart home technologies and green building standards are increasingly becoming essential features for property developments. Real estate agents play a crucial role in facilitating transactions, providing market insights, and implementing government policies. The government implements measures such as additional buyers stamp duties (ABSD), loan-to-value (LTV) limits, and sellers stamp duties (SSD) to maintain housing affordability and prevent asset bubbles. These policies, while effective in controlling speculation, can impact investor demand and transaction volumes, leading to slower market growth. Real estate funds and property investment strategies continue to be popular, with rental yield being a significant consideration.
- Rental price trends and mortgage rates also influence investment decisions. The adoption of green building standards is a growing trend, as investors and tenants seek sustainable and energy-efficient properties. The regulatory environment in Singapore remains stable, providing a favorable backdrop for real estate development and investment. However, the implementation of government policies can add costs, time, and uncertainty to projects, necessitating careful planning and strategic decision-making.
Exclusive Singapore Real Estate Market Customer Landscape
The market forecasting report includes the adoption lifecycle of the market, covering from the innovator’s stage to the laggard’s stage. It focuses on adoption rates in different regions based on penetration. Furthermore, the report also includes key purchase criteria and drivers of price sensitivity to help companies evaluate and develop their market growth analysis strategies.
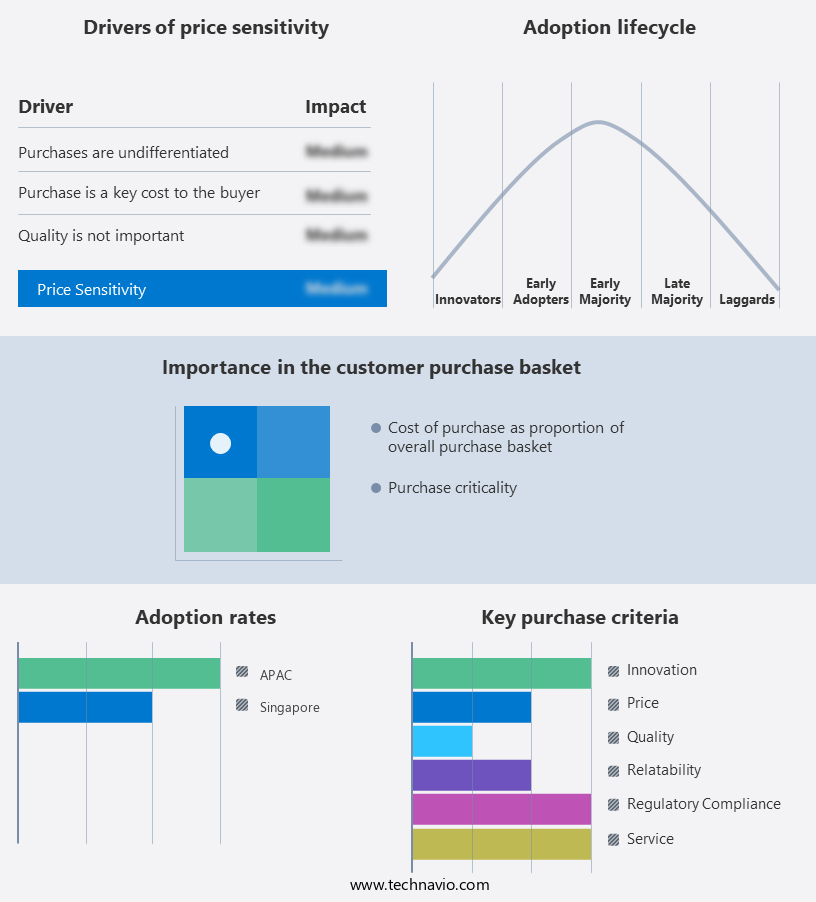
Customer Landscape
Key Companies & Market Insights
Companies are implementing various strategies, such as strategic alliances, market forecast partnerships, mergers and acquisitions, geographical expansion, and product/service launches, to enhance their presence in the market.
The market research and growth report includes detailed analyses of the competitive landscape of the market and information about key companies, including:
- C and H Properties Pte Ltd.
- CapitaLand Ltd.
- CBRE Group Inc.
- Century 21 Real Estate LLC
- City Developments Ltd
- EL Development Pte Ltd
- ERA Franchise Systems LLC
- Far East Organization
- Frasers Property Ltd.
- Genting Singapore Ltd.
- GLP Pte Ltd.
- GuocoLand Ltd.
- Huttons International Pte Ltd.
- OrangeTee and Tie Pte Ltd.
- Pinnacle Estate Agency Pte. Ltd.
- PropNex Ltd.
- Propseller Pte. Ltd.
- SNREALESTATE SG
- The Edge Property Pte Ltd
- UOL Group Ltd.
Qualitative and quantitative analysis of companies has been conducted to help clients understand the wider business environment as well as the strengths and weaknesses of key market players. Data is qualitatively analyzed to categorize companies as pure play, category-focused, industry-focused, and diversified; it is quantitatively analyzed to categorize companies as dominant, leading, strong, tentative, and weak.
Recent Development and News in Real Estate Market In Singapore
- In February 2023, the Urban Redevelopment Authority (URA) of Singapore launched the Housing and Development Board (HDB) BTO (Build-to-Order) flat sales exercise, offering over 4,000 new flats across various estates [1]. This initiative aimed to meet the growing demand for affordable housing in the city-state.
- In May 2024, CapitaLand, a leading real estate company in Asia, announced a strategic partnership with Ascendas-Singbridge, a wholly-owned subsidiary of CapitaLand Group, to co-create and manage a sustainable urban development in Tampines North [2]. This collaboration focuses on creating a smart, green, and connected community, further expanding CapitaLand's presence in the Singaporean real estate market.
- In August 2024, Keppel Land, a leading property company in Singapore, secured a SGD 1.3 billion (approximately USD 950 million) investment from a consortium led by Qatar Investment Authority for its new residential project, The Reef at King's Dock [3]. This significant investment underscores the confidence of international investors in the Singaporean real estate market.
- In December 2025, the Singapore government introduced the Voluntary Early Redemption Scheme (VERS) for leasehold HDB flats, allowing eligible homeowners to buy their flats at a discounted price before the lease expires [4]. This policy change aims to encourage long-term ownership and reduce the uncertainty surrounding leasehold properties in Singapore.
- [1] Urban Redevelopment Authority. (2023, February 13). New BTO sites and sales exercise in February 2023. Retrieved from Urban Redevelopment Authority: https://www.Ura.Gov.Sg/-/media/Mediaplayer-BTO-Feb-2023-Launch.Mp4
- [2] CapitaLand. (2024, May 1). CapitaLand and Ascendas-Singbridge to co-create and manage a sustainable urban development in Tampines North. Retrieved from CapitaLand: https://www.Capitaland.Com/group/en/media/press-releases/2024/Pages/CapitaLand-and-Ascendas-Singbridge-to-co-create-and-manage-a-sustainable-urban-development-in-Tampines-North.Aspx
- [3] Keppel Corporation. (2024, August 1). Keppel Land secures SGD 1.3 billion investment for The Reef at King's Dock. Retrieved from Keppel Corporation: https://www.Kepcorp.Com/-/media/Mediaplayer-Keppel-Land-secures-SGD-1-3-billion-investment-for-The-Reef-at-Kings-Dock.Mp4
- [4] Ministry of National Development. (2025, December 1). Voluntary Early Redemption Scheme for HDB Leasehold Flats. Retrieved from Ministry of National Development: https://www.Mnd.Gov.Sg/-/media/MND/Resources/Voluntary-Early-Redemption-Scheme-for-HDB-Leasehold-Flats.Pdf
Research Analyst Overview
The market continues to evolve, shaped by various market dynamics and sector-specific trends. Property market cycles influence commercial real estate, with office buildings and retail spaces experiencing fluctuating demand based on economic growth and population expansion. Property management adapts to these changes through innovative solutions, such as virtual reality (VR) and augmented reality (AR) technologies for property viewings. Sustainable development is a growing focus, with property developers integrating green building standards and urban renewal projects. Industrial properties benefit from infrastructure development and government policies, while residential properties, including HDB flats and private apartments, experience capital appreciation due to increasing demand and limited supply.
Real estate investors leverage data-driven insights from big data and proptech innovations to inform their property portfolios. Regulations and property taxes, such as stamp duty, influence investment strategies. Smart home technologies and smart cities are transforming the rental market, with executive condominiums and rental yield attracting tenants. Property valuation remains crucial, with property development and property price trends closely monitored. Urban planning and land use policies continue to shape the market, while real estate agents adapt to changing market sentiment and mortgage rates. The ongoing integration of blockchain technology and real estate regulations further influences the property market outlook.
Dive into Technavio’s robust research methodology, blending expert interviews, extensive data synthesis, and validated models for unparalleled Real Estate Market in Singapore insights. See full methodology.
|
Market Scope |
|
|
Report Coverage |
Details |
|
Page number |
177 |
|
Base year |
2024 |
|
Historic period |
2019-2023 |
|
Forecast period |
2025-2029 |
|
Growth momentum & CAGR |
Accelerate at a CAGR of 4.6% |
|
Market growth 2025-2029 |
USD 62.6 billion |
|
Market structure |
Fragmented |
|
YoY growth 2024-2025(%) |
4.4 |
|
Competitive landscape |
Leading Companies, Market Positioning of Companies, Competitive Strategies, and Industry Risks |
What are the Key Data Covered in this Market Research Report?
- CAGR of the market during the forecast period
- Detailed information on factors that will drive the market growth and forecasting between 2025 and 2029
- Precise estimation of the size of the market and its contribution of the market in focus to the parent market
- Accurate predictions about upcoming market growth and trends and changes in consumer behaviour
- Growth of the market across Singapore
- Thorough analysis of the market’s competitive landscape and detailed information about companies
- Comprehensive analysis of factors that will challenge the growth of market companies
We can help! Our analysts can customize this market research report to meet your requirements Get in touch
 RIA -
RIA - 
