Real-time AI Decisioning Platforms For Enterprise Operations Market Analysis, Size, and Forecast 2026-2030: North America (US, Canada, and Mexico), Europe (Germany, UK, and France), APAC (China, Japan, and India), Middle East and Africa (UAE, Saudi Arabia, and Israel), South America (Brazil, Argentina, and Colombia), and Rest of World (ROW)

Real-time AI Decisioning Platforms For Enterprise Operations Market Analysis, Size, and Forecast 2026-2030:
North America (US, Canada, and Mexico), Europe (Germany, UK, and France), APAC (China, Japan, and India), Middle East and Africa (UAE, Saudi Arabia, and Israel), South America (Brazil, Argentina, and Colombia), and Rest of World (ROW)

Published: Apr 2026 292 Pages SKU: IRTNTR81431

Market Overview at a Glance

$12.36 B
Market Opportunity
40%
CAGR 2025 - 2030
37.9%
North America Growth
$1.43 B
Solutions segment 2024

Real-time AI Decisioning Platforms For Enterprise Operations Market Size 2026-2030

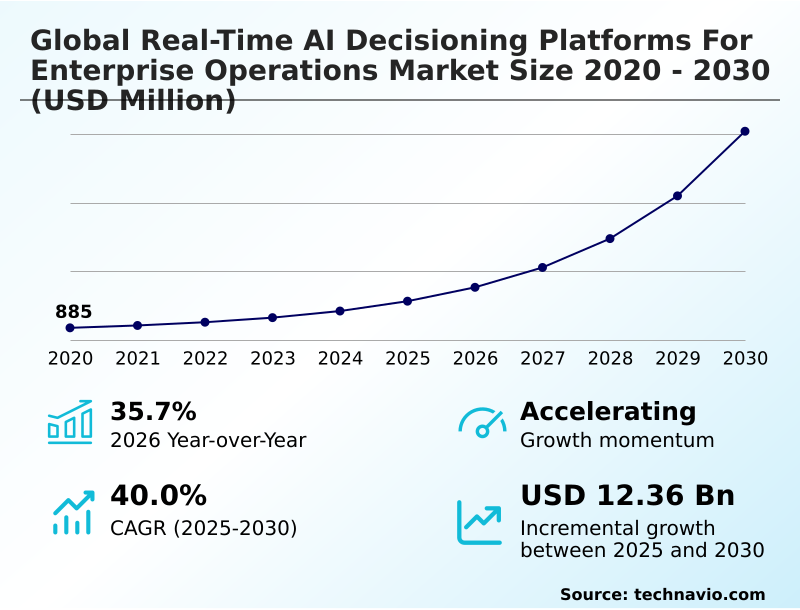
The real-time ai decisioning platforms for enterprise operations market size is valued to increase by USD 12.36 billion, at a CAGR of 40% from 2025 to 2030. Urgent necessity for supply chain resilience will drive the real-time ai decisioning platforms for enterprise operations market.

Major Market Trends & Insights

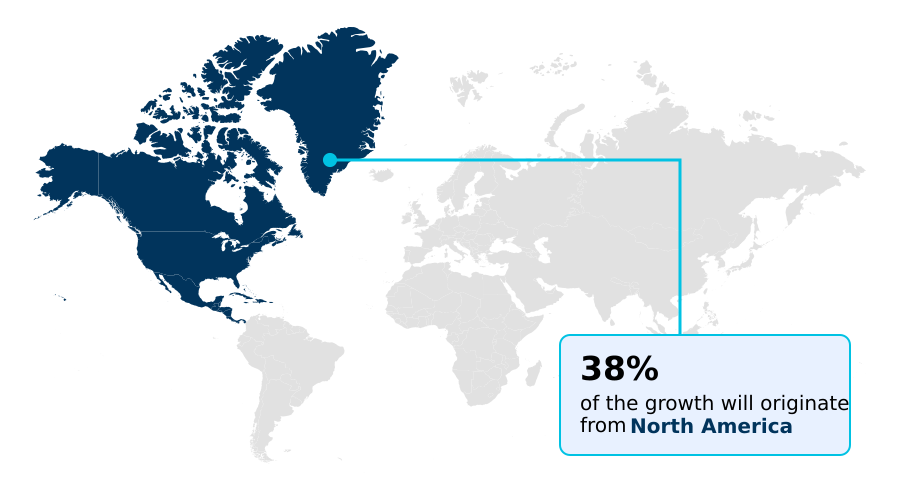
  • North America dominated the market and accounted for a 37.9% growth during the forecast period.
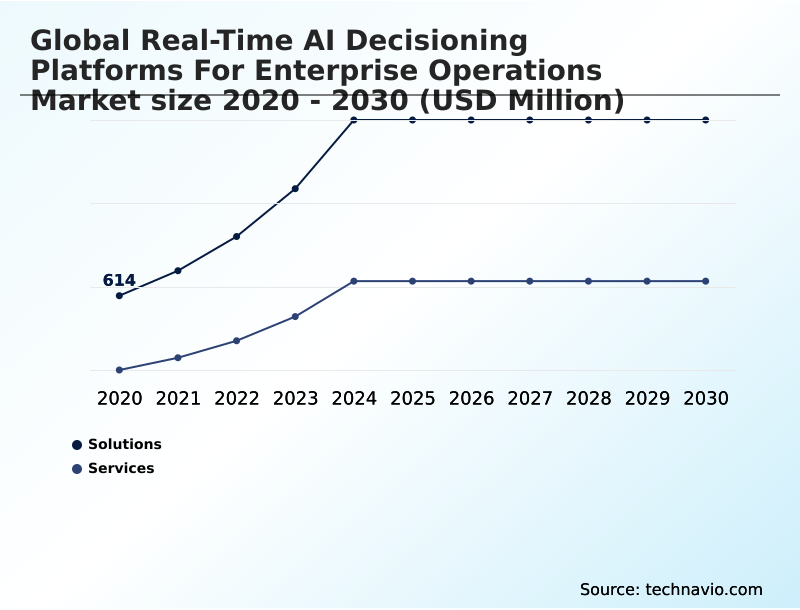
  • By Component - Solutions segment was valued at USD 1.43 billion in 2024
  • By End-user - Large enterprises segment accounted for the largest market revenue share in 2024

Market Size & Forecast

  • Market Opportunities: USD 14.30 billion
  • Market Future Opportunities: USD 12.36 billion
  • CAGR from 2025 to 2030 : 40%

Market Summary

  • The real-time AI decisioning platforms for enterprise operations market is rapidly evolving, driven by the need for proactive operational management and enhanced decision-making capabilities. These systems facilitate autonomous enterprise operations by processing high-velocity data streams to enable immediate actions, moving beyond traditional analytics.
  • A key trend is the integration of generative AI with deterministic decisioning, allowing for more nuanced and context-aware automation. For instance, in logistics, these platforms can autonomously reroute shipments based on real-time weather and traffic data, significantly improving efficiency. However, challenges such as infrastructure latency and the high computational costs of running complex models persist.
  • The push for AI ethics and governance also shapes development, with an increasing focus on creating transparent and auditable systems. The convergence of high-speed connectivity and advanced edge computing is expanding applications into new domains, from smart manufacturing to hyper-personalized retail, making these platforms a cornerstone of modern digital transformation.
  • The emphasis on AI-driven supply chain resilience is particularly strong, as organizations seek to mitigate disruptions in an unpredictable global landscape.

What will be the Size of the Real-time AI Decisioning Platforms For Enterprise Operations Market during the forecast period?

Get Key Insights on Market Forecast (PDF) Request Free Sample

How is the Real-time AI Decisioning Platforms For Enterprise Operations Market Segmented?

The real-time ai decisioning platforms for enterprise operations industry research report provides comprehensive data (region-wise segment analysis), with forecasts and estimates in "USD million" for the period 2026-2030, as well as historical data from 2020-2024 for the following segments.

  • Component
    • Solutions
    • Services
  • End-user
    • Large enterprises
    • SMEs
  • Deployment
    • Cloud-based
    • Hybrid
    • On-premises
  • Geography
    • North America
      • US
      • Canada
      • Mexico
    • Europe
      • Germany
      • UK
      • France
    • APAC
      • China
      • Japan
      • India
    • Middle East and Africa
      • UAE
      • Saudi Arabia
      • Israel
    • South America
      • Brazil
      • Argentina
      • Colombia
    • Rest of World (ROW)

By Component Insights

The solutions segment is estimated to witness significant growth during the forecast period.

The solutions segment is defined by software architectures providing an automated decision workflow and real-time business intelligence. These platforms leverage a streaming analytics engine for high-velocity data ingestion, enabling context-aware decision support through techniques like complex event processing.

This facilitates capabilities such as next-best-action recommendation and dynamic pricing algorithms. The core function is to translate streaming data analytics into immediate, executable business logic, with some solutions improving operational response times by up to 40%.

The adoption of no-code decision management interfaces is also expanding access to these powerful tools beyond specialized data science teams, driving data-driven operational excellence across the enterprise. These systems are pivotal for continuous model optimization and maintaining enterprise operational agility.

Request Free Sample

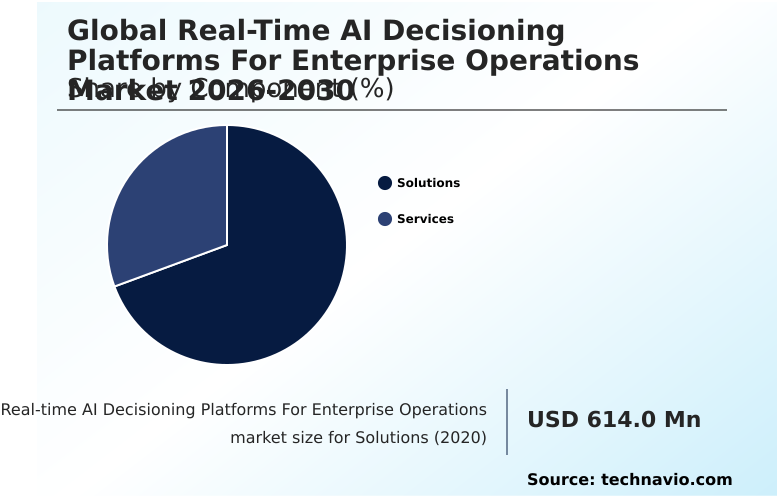
The Solutions segment was valued at USD 1.43 billion in 2024 and showed a gradual increase during the forecast period.

Request Free Sample

Regional Analysis

North America is estimated to contribute 37.9% to the growth of the global market during the forecast period.Technavio’s analysts have elaborately explained the regional trends and drivers that shape the market during the forecast period.

See How Real-time AI Decisioning Platforms For Enterprise Operations Market Demand is Rising in North America Request Free Sample

The geographic landscape is marked by varying adoption rates, with mature markets in North America and Europe leveraging high-performance computing infrastructure to achieve operational efficiency gains of over 30%.

In North America, the focus is on real-time risk assessment in finance and AI-driven logistics routing. Meanwhile, the APAC region is the fastest-growing, with investments in intelligent transportation systems and smart city projects driving demand.

Hybrid deployment models are gaining traction globally, allowing enterprises to balance performance with data residency requirements, which is a key consideration for enterprise operational agility.

The use of digital twin simulation for testing decisioning logic before deployment is also becoming standard practice, reducing implementation risks by up to 50%.

Market Dynamics

Our researchers analyzed the data with 2025 as the base year, along with the key drivers, trends, and challenges. A holistic analysis of drivers will help companies refine their marketing strategies to gain a competitive advantage.

  • The strategic implementation of real-time AI decisioning platforms for enterprise operations is reshaping core business functions. In the financial sector, real-time AI for fraud detection has become mission-critical, while the use of real-time decisioning in finance extends to algorithmic trading and risk management.
  • For manufacturers, autonomous decision systems for manufacturing and real-time AI for predictive maintenance are delivering unprecedented uptime, with some firms reporting improvements nearly double those of traditional methods. Concurrently, AI decisioning for supply chain and multi-agent AI systems for logistics are building more resilient and efficient global trade networks.
  • The customer-facing applications are equally transformative; hyper-personalization using real-time AI and AI-driven next-best-action engines are redefining the real-time AI for customer experience. The evolution is supported by a diverse technology stack, including low-latency AI decision platforms and edge computing for real-time AI.
  • The convergence of generative AI in decision automation and real-time analytics for operational intelligence is creating more sophisticated systems. To manage this complexity, robust AI decisioning platform security governance and automated AI decision workflow management are essential. Organizations are increasingly adopting cloud-native AI decisioning solutions while also navigating the complexities of integrating AI with legacy systems.
  • The emphasis on sustainable AI and green computing is also influencing platform design, while regulatory compliance with AI decisioning and the demand for explainable AI in decisioning platforms ensure that these powerful systems are deployed responsibly.

What are the key market drivers leading to the rise in the adoption of Real-time AI Decisioning Platforms For Enterprise Operations Industry?

  • The urgent necessity for enhanced supply chain resilience is a key driver for the market.

  • The market is propelled by the urgent need for AI-driven supply chain resilience and optimization, with implementations reducing logistical disruptions by up to 40%.
  • The demand for a sophisticated hyper-personalization engine is another major driver, as real-time customer engagement strategies have been shown to boost retention rates by 30%.
  • These capabilities are enabled by advancements in edge computing architecture, which facilitates the low-latency execution required for smart factory automation and other real-time applications.
  • The convergence of technologies has lowered the barrier to entry, allowing more organizations to achieve data-driven operational excellence.
  • The ability to deploy a robust fraud detection system and perform automated threat mitigation in real-time is also a critical factor driving adoption across financial and e-commerce sectors, reinforcing enterprise security postures.

What are the market trends shaping the Real-time AI Decisioning Platforms For Enterprise Operations Industry?

  • A key market trend is the shift toward multi-agentic AI orchestration. This approach moves beyond single-model decisioning to coordinate multiple autonomous agents for complex problem-solving.

  • A primary trend is the shift toward multi-agent orchestration, where an agentic AI framework coordinates multiple specialized bots to handle complex tasks, improving process efficiency by up to 35%. This is coupled with the rapid generative AI integration into deterministic workflows, enabling systems to interpret unstructured data and execute precise actions, which enhances decision accuracy by over 20%.
  • The rise of sustainable AI operations is also significant, with carbon-aware computing models optimizing workloads to reduce energy consumption. These advancements, often accessible through low-code AI platforms, are fostering intelligent process automation. This evolution toward more sophisticated and energy-efficient AI systems is enabling continuous model optimization and proactive operational management across industries.

What challenges does the Real-time AI Decisioning Platforms For Enterprise Operations Industry face during its growth?

  • Regulatory fragmentation and the complexities of data sovereignty compliance represent a key challenge affecting industry growth.

  • A significant challenge is navigating the fragmented landscape of data sovereignty compliance, which can increase compliance overhead by over 25%. This necessitates robust AI governance framework and real-time compliance monitoring capabilities. The technical hurdle of legacy system interoperability also persists, with integration projects often exceeding budgets by 40% and delaying the deployment of automated decision workflow systems.
  • Furthermore, organizations face difficulties in implementing effective AI ethics and governance protocols, leading to risks in deploying autonomous systems. While hybrid cloud AI models offer flexibility, ensuring transparent AI decisioning and consistent AI model retraining pipeline across distributed environments remains complex. The need for a cohesive strategy that addresses these technical and regulatory obstacles is critical for successful implementation.

Exclusive Technavio Analysis on Customer Landscape

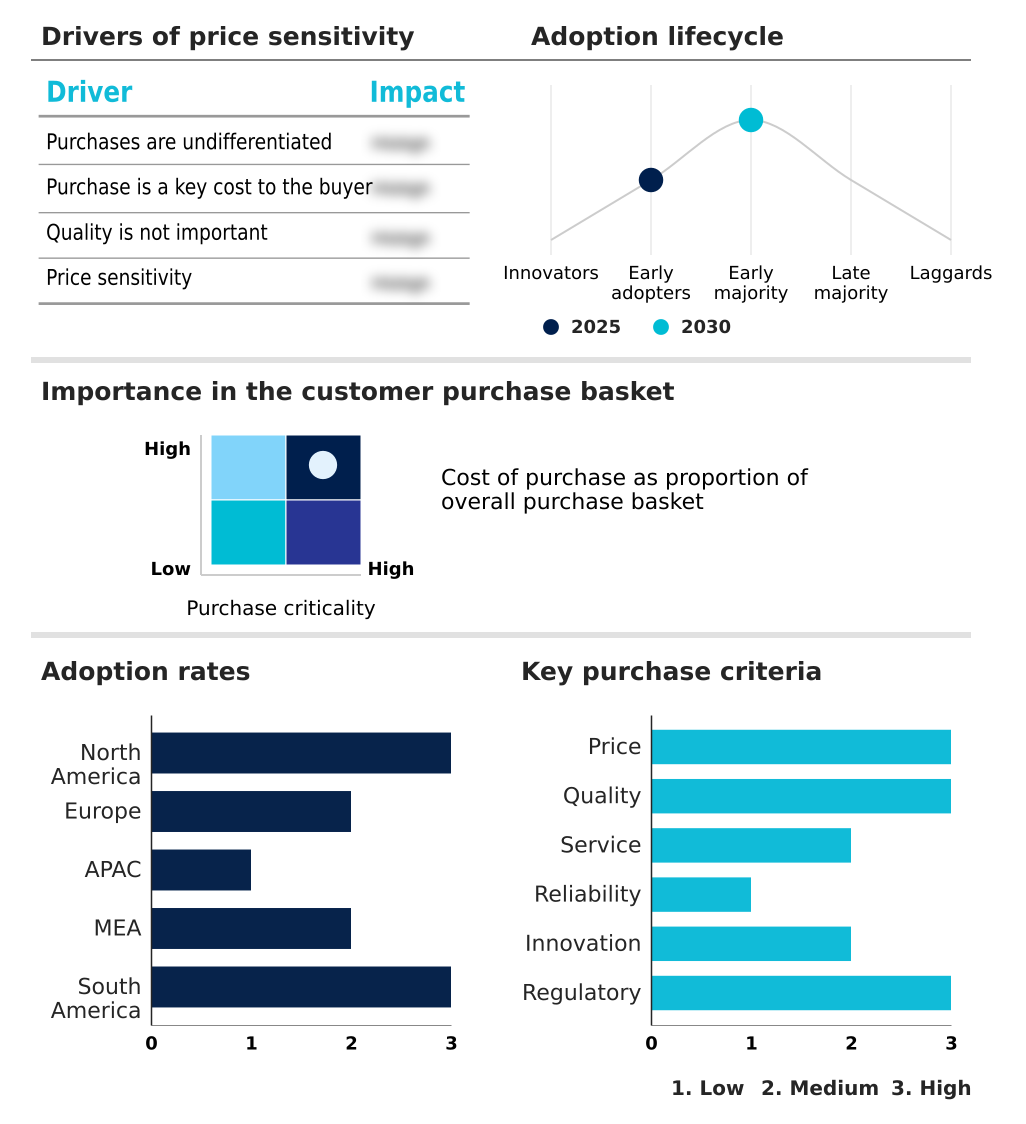
The real-time ai decisioning platforms for enterprise operations market forecasting report includes the adoption lifecycle of the market, covering from the innovator’s stage to the laggard’s stage. It focuses on adoption rates in different regions based on penetration. Furthermore, the real-time ai decisioning platforms for enterprise operations market report also includes key purchase criteria and drivers of price sensitivity to help companies evaluate and develop their market growth analysis strategies.

Customer Landscape of Real-time AI Decisioning Platforms For Enterprise Operations Industry

Competitive Landscape

Companies are implementing various strategies, such as strategic alliances, real-time ai decisioning platforms for enterprise operations market forecast, partnerships, mergers and acquisitions, geographical expansion, and product/service launches, to enhance their presence in the industry.

ACTICO GmbH - Offerings enable real-time data processing, predictive modeling, and automated operational decisions, streamlining complex enterprise workflows through advanced analytics frameworks.

The industry research and growth report includes detailed analyses of the competitive landscape of the market and information about key companies, including:

  • ACTICO GmbH
  • Aera Technology
  • Alteryx Inc.
  • Amazon Web Services Inc.
  • C3.ai Inc.
  • Databricks Inc.
  • DataRobot Inc.
  • Experian Plc
  • Fair Isaac Corp.
  • Google LLC
  • H2O.ai Inc.
  • IBM Corp.
  • InRule Technology Inc.
  • Microsoft Corp.
  • Oracle Corp.
  • Palantir Technologies Inc.
  • Pegasystems Inc.
  • Salesforce Inc.
  • SAP SE
  • SAS Institute Inc.
  • ServiceNow Inc.
  • Sparkling Logic
  • Teradata Corp.
  • TIBCO Software Inc.

Qualitative and quantitative analysis of companies has been conducted to help clients understand the wider business environment as well as the strengths and weaknesses of key industry players. Data is qualitatively analyzed to categorize companies as pure play, category-focused, industry-focused, and diversified; it is quantitatively analyzed to categorize companies as dominant, leading, strong, tentative, and weak.

Recent Development and News in Real-time ai decisioning platforms for enterprise operations market

  • In May 2025, the BMW Group implemented a real-time autonomous parts-orchestration system across its primary European assembly lines to manage the flow of components based on live transit telemetry, which has reduced factory idling time by twelve percent.
  • In April 2025, Dwyka Mining Services, in partnership with Blue Wireless and powered by SpaceX Starlink, expanded low-latency satellite connectivity for remote mining operations, enabling real-time monitoring and predictive maintenance.
  • In February 2025, Salesforce introduced its new agentic layer that allows for the synchronization of multiple autonomous decisioning agents across a single enterprise workflow, enabling the platform to resolve complex service requests.
  • In January 2025, IBM released a specialized framework that combines large language models with its established deterministic decisioning engines to automate the process of regulatory compliance monitoring for enterprises.

Dive into Technavio’s robust research methodology, blending expert interviews, extensive data synthesis, and validated models for unparalleled Real-time AI Decisioning Platforms For Enterprise Operations Market insights. See full methodology.

Market Scope
Page number 292
Base year 2025
Historic period 2020-2024
Forecast period 2026-2030
Growth momentum & CAGR Accelerate at a CAGR of 40%
Market growth 2026-2030 USD 12359.4 million
Market structure Fragmented
YoY growth 2025-2026(%) 35.7%
Key countries US, Canada, Mexico, Germany, UK, France, Spain, Italy, The Netherlands, China, Japan, India, South Korea, Australia, Indonesia, UAE, Saudi Arabia, Israel, South Africa, Turkey, Brazil, Argentina and Colombia
Competitive landscape Leading Companies, Market Positioning of Companies, Competitive Strategies, and Industry Risks

Request Free Sample

Research Analyst Overview

  • The market is undergoing a fundamental transformation toward autonomous decision-making, where platforms are expected to deliver not just insights but also automated actions. The integration of a streaming analytics engine for high-velocity data ingestion and complex event processing is now standard.
  • Advanced systems incorporate machine learning model deployment within a predictive analytics workflow, forming the backbone of any modern operational intelligence platform. We are seeing a definitive shift toward the agentic AI framework, which facilitates multi-agent orchestration and moves beyond the rigidity of a purely deterministic decision engine. This is complemented by generative AI integration for more nuanced responses.
  • A key differentiator is low-latency execution, crucial for applications like the hyper-personalization engine, real-time anomaly detection, and the fraud detection system. Leading platforms are also focused on supply chain optimization and automated resource allocation.
  • From a governance perspective, explainable AI (XAI) and human-in-the-loop oversight are critical for ensuring regulatory compliance automation and managing data sovereignty compliance, with platforms offering robust AI governance framework capabilities seeing 25% higher adoption in regulated industries.
  • Addressing legacy system interoperability remains a persistent challenge, but the demand for sustainable AI operations and carbon-aware computing is creating new avenues for innovation. Ultimately, success hinges on a robust high-performance computing infrastructure capable of supporting real-time telemetry analysis, predictive maintenance scheduling, customer sentiment analysis, AI-driven logistics routing, risk management automation, and dynamic pricing algorithms.

What are the Key Data Covered in this Real-time AI Decisioning Platforms For Enterprise Operations Market Research and Growth Report?

  • What is the expected growth of the Real-time AI Decisioning Platforms For Enterprise Operations Market between 2026 and 2030?

    • USD 12.36 billion, at a CAGR of 40%

  • What segmentation does the market report cover?

    • The report is segmented by Component (Solutions, and Services), End-user (Large enterprises, and SMEs), Deployment (Cloud-based, Hybrid, and On-premises) and Geography (North America, Europe, APAC, Middle East and Africa, South America)

  • Which regions are analyzed in the report?

    • North America, Europe, APAC, Middle East and Africa and South America

  • What are the key growth drivers and market challenges?

    • Urgent necessity for supply chain resilience, Regulatory fragmentation and data sovereignty compliance

  • Who are the major players in the Real-time AI Decisioning Platforms For Enterprise Operations Market?

    • ACTICO GmbH, Aera Technology, Alteryx Inc., Amazon Web Services Inc., C3.ai Inc., Databricks Inc., DataRobot Inc., Experian Plc, Fair Isaac Corp., Google LLC, H2O.ai Inc., IBM Corp., InRule Technology Inc., Microsoft Corp., Oracle Corp., Palantir Technologies Inc., Pegasystems Inc., Salesforce Inc., SAP SE, SAS Institute Inc., ServiceNow Inc., Sparkling Logic, Teradata Corp. and TIBCO Software Inc.

Market Research Insights

  • The market is characterized by a significant push toward enterprise operational agility, with adoption rates for AI-powered workflow optimization increasing by 40% in key sectors. Organizations leveraging real-time decision intelligence report an average 25% improvement in resource allocation efficiency. This dynamism is fueled by the accessibility of hybrid cloud AI models and low-code AI platforms, which democratize advanced analytical capabilities.
  • The focus on AI-driven supply chain resilience is paramount, as demonstrated by a 30% reduction in disruptions for companies that implement proactive operational management systems. Furthermore, the drive for enhanced real-time customer engagement is compelling businesses to adopt these technologies to maintain a competitive edge in an increasingly digital marketplace.

We can help! Our analysts can customize this real-time ai decisioning platforms for enterprise operations market research report to meet your requirements.

Get in touch

1. Executive Summary

1.1 Market overview

Executive Summary - Chart on Market Overview
Executive Summary - Data Table on Market Overview
Executive Summary - Chart on Global Market Characteristics
Executive Summary - Chart on Market by Geography
Executive Summary - Chart on Market Segmentation by Component
Executive Summary - Chart on Market Segmentation by End-user
Executive Summary - Chart on Market Segmentation by Deployment
Executive Summary - Chart on Incremental Growth
Executive Summary - Data Table on Incremental Growth
Executive Summary - Chart on Company Market Positioning

2. Technavio Analysis

2.1 Analysis of price sensitivity, lifecycle, customer purchase basket, adoption rates, and purchase criteria

2.2 Criticality of inputs and Factors of differentiation

Chart on Overview on criticality of inputs and factors of differentiation

2.3 Factors of disruption

Chart on Overview on factors of disruption

2.4 Impact of drivers and challenges

Chart on Impact of drivers and challenges in 2025 and 2030

3. Market Landscape

3.1 Market ecosystem

Chart on Parent Market
Data Table on - Parent Market

3.2 Market characteristics

Chart on Market characteristics analysis

3.3 Value chain analysis

Chart on Value chain analysis

4. Market Sizing

4.1 Market definition

Data Table on Offerings of companies included in the market definition

4.2 Market segment analysis

Market segments

4.3 Market size 2025

4.4 Market outlook: Forecast for 2025-2030

Chart on Global - Market size and forecast 2025-2030 ($ million)
Data Table on Global - Market size and forecast 2025-2030 ($ million)
Chart on Global Market: Year-over-year growth 2025-2030 (%)
Data Table on Global Market: Year-over-year growth 2025-2030 (%)

5. Historic Market Size

5.1 Global Real-Time AI Decisioning Platforms For Enterprise Operations Market 2020 - 2024

Historic Market Size - Data Table on Global Real-Time AI Decisioning Platforms For Enterprise Operations Market 2020 - 2024 ($ million)

5.2 Component segment analysis 2020 - 2024

Historic Market Size - Component Segment 2020 - 2024 ($ million)

5.3 End-user segment analysis 2020 - 2024

Historic Market Size - End-user Segment 2020 - 2024 ($ million)

5.4 Deployment segment analysis 2020 - 2024

Historic Market Size - Deployment Segment 2020 - 2024 ($ million)

5.5 Geography segment analysis 2020 - 2024

Historic Market Size - Geography Segment 2020 - 2024 ($ million)

5.6 Country segment analysis 2020 - 2024

Historic Market Size - Country Segment 2020 - 2024 ($ million)

6. Qualitative Analysis

6.1 Impact of geopolitical conflicts on global real-time AI decisioning platforms for enterprise operations market

7. Five Forces Analysis

7.1 Five forces summary

Five forces analysis - Comparison between 2025 and 2030

7.2 Bargaining power of buyers

Bargaining power of buyers - Impact of key factors 2025 and 2030

7.3 Bargaining power of suppliers

Bargaining power of suppliers - Impact of key factors in 2025 and 2030

7.4 Threat of new entrants

Threat of new entrants - Impact of key factors in 2025 and 2030

7.5 Threat of substitutes

Threat of substitutes - Impact of key factors in 2025 and 2030

7.6 Threat of rivalry

Threat of rivalry - Impact of key factors in 2025 and 2030

7.7 Market condition

Chart on Market condition - Five forces 2025 and 2030

8. Market Segmentation by Component

8.1 Market segments

Chart on Component - Market share 2025-2030 (%)
Data Table on Component - Market share 2025-2030 (%)

8.2 Comparison by Component

Chart on Comparison by Component
Data Table on Comparison by Component

8.3 Solutions - Market size and forecast 2025-2030

Chart on Solutions - Market size and forecast 2025-2030 ($ million)
Data Table on Solutions - Market size and forecast 2025-2030 ($ million)
Chart on Solutions - Year-over-year growth 2025-2030 (%)
Data Table on Solutions - Year-over-year growth 2025-2030 (%)

8.4 Services - Market size and forecast 2025-2030

Chart on Services - Market size and forecast 2025-2030 ($ million)
Data Table on Services - Market size and forecast 2025-2030 ($ million)
Chart on Services - Year-over-year growth 2025-2030 (%)
Data Table on Services - Year-over-year growth 2025-2030 (%)

8.5 Market opportunity by Component

Market opportunity by Component ($ million)
Data Table on Market opportunity by Component ($ million)

9. Market Segmentation by End-user

9.1 Market segments

Chart on End-user - Market share 2025-2030 (%)
Data Table on End-user - Market share 2025-2030 (%)

9.2 Comparison by End-user

Chart on Comparison by End-user
Data Table on Comparison by End-user

9.3 Large enterprises - Market size and forecast 2025-2030

Chart on Large enterprises - Market size and forecast 2025-2030 ($ million)
Data Table on Large enterprises - Market size and forecast 2025-2030 ($ million)
Chart on Large enterprises - Year-over-year growth 2025-2030 (%)
Data Table on Large enterprises - Year-over-year growth 2025-2030 (%)

9.4 SMEs - Market size and forecast 2025-2030

Chart on SMEs - Market size and forecast 2025-2030 ($ million)
Data Table on SMEs - Market size and forecast 2025-2030 ($ million)
Chart on SMEs - Year-over-year growth 2025-2030 (%)
Data Table on SMEs - Year-over-year growth 2025-2030 (%)

9.5 Market opportunity by End-user

Market opportunity by End-user ($ million)
Data Table on Market opportunity by End-user ($ million)

10. Market Segmentation by Deployment

10.1 Market segments

Chart on Deployment - Market share 2025-2030 (%)
Data Table on Deployment - Market share 2025-2030 (%)

10.2 Comparison by Deployment

Chart on Comparison by Deployment
Data Table on Comparison by Deployment

10.3 Cloud-based - Market size and forecast 2025-2030

Chart on Cloud-based - Market size and forecast 2025-2030 ($ million)
Data Table on Cloud-based - Market size and forecast 2025-2030 ($ million)
Chart on Cloud-based - Year-over-year growth 2025-2030 (%)
Data Table on Cloud-based - Year-over-year growth 2025-2030 (%)

10.4 Hybrid - Market size and forecast 2025-2030

Chart on Hybrid - Market size and forecast 2025-2030 ($ million)
Data Table on Hybrid - Market size and forecast 2025-2030 ($ million)
Chart on Hybrid - Year-over-year growth 2025-2030 (%)
Data Table on Hybrid - Year-over-year growth 2025-2030 (%)

10.5 On-premises - Market size and forecast 2025-2030

Chart on On-premises - Market size and forecast 2025-2030 ($ million)
Data Table on On-premises - Market size and forecast 2025-2030 ($ million)
Chart on On-premises - Year-over-year growth 2025-2030 (%)
Data Table on On-premises - Year-over-year growth 2025-2030 (%)

10.6 Market opportunity by Deployment

Market opportunity by Deployment ($ million)
Data Table on Market opportunity by Deployment ($ million)

11. Customer Landscape

11.1 Customer landscape overview

Analysis of price sensitivity, lifecycle, customer purchase basket, adoption rates, and purchase criteria

12. Geographic Landscape

12.1 Geographic segmentation

Chart on Market share by geography 2025-2030 (%)
Data Table on Market share by geography 2025-2030 (%)

12.2 Geographic comparison

Chart on Geographic comparison
Data Table on Geographic comparison

12.3 North America - Market size and forecast 2025-2030

Chart on North America - Market size and forecast 2025-2030 ($ million)
Data Table on North America - Market size and forecast 2025-2030 ($ million)
Chart on North America - Year-over-year growth 2025-2030 (%)
Data Table on North America - Year-over-year growth 2025-2030 (%)
Chart on Regional Comparison - North America
Data Table on Regional Comparison - North America

12.3.1 US - Market size and forecast 2025-2030

Chart on US - Market size and forecast 2025-2030 ($ million)
Data Table on US - Market size and forecast 2025-2030 ($ million)
Chart on US - Year-over-year growth 2025-2030 (%)
Data Table on US - Year-over-year growth 2025-2030 (%)

12.3.2 Canada - Market size and forecast 2025-2030

Chart on Canada - Market size and forecast 2025-2030 ($ million)
Data Table on Canada - Market size and forecast 2025-2030 ($ million)
Chart on Canada - Year-over-year growth 2025-2030 (%)
Data Table on Canada - Year-over-year growth 2025-2030 (%)

12.3.3 Mexico - Market size and forecast 2025-2030

Chart on Mexico - Market size and forecast 2025-2030 ($ million)
Data Table on Mexico - Market size and forecast 2025-2030 ($ million)
Chart on Mexico - Year-over-year growth 2025-2030 (%)
Data Table on Mexico - Year-over-year growth 2025-2030 (%)

12.4 Europe - Market size and forecast 2025-2030

Chart on Europe - Market size and forecast 2025-2030 ($ million)
Data Table on Europe - Market size and forecast 2025-2030 ($ million)
Chart on Europe - Year-over-year growth 2025-2030 (%)
Data Table on Europe - Year-over-year growth 2025-2030 (%)
Chart on Regional Comparison - Europe
Data Table on Regional Comparison - Europe

12.4.1 Germany - Market size and forecast 2025-2030

Chart on Germany - Market size and forecast 2025-2030 ($ million)
Data Table on Germany - Market size and forecast 2025-2030 ($ million)
Chart on Germany - Year-over-year growth 2025-2030 (%)
Data Table on Germany - Year-over-year growth 2025-2030 (%)

12.4.2 UK - Market size and forecast 2025-2030

Chart on UK - Market size and forecast 2025-2030 ($ million)
Data Table on UK - Market size and forecast 2025-2030 ($ million)
Chart on UK - Year-over-year growth 2025-2030 (%)
Data Table on UK - Year-over-year growth 2025-2030 (%)

12.4.3 France - Market size and forecast 2025-2030

Chart on France - Market size and forecast 2025-2030 ($ million)
Data Table on France - Market size and forecast 2025-2030 ($ million)
Chart on France - Year-over-year growth 2025-2030 (%)
Data Table on France - Year-over-year growth 2025-2030 (%)

12.4.4 Spain - Market size and forecast 2025-2030

Chart on Spain - Market size and forecast 2025-2030 ($ million)
Data Table on Spain - Market size and forecast 2025-2030 ($ million)
Chart on Spain - Year-over-year growth 2025-2030 (%)
Data Table on Spain - Year-over-year growth 2025-2030 (%)

12.4.5 Italy - Market size and forecast 2025-2030

Chart on Italy - Market size and forecast 2025-2030 ($ million)
Data Table on Italy - Market size and forecast 2025-2030 ($ million)
Chart on Italy - Year-over-year growth 2025-2030 (%)
Data Table on Italy - Year-over-year growth 2025-2030 (%)

12.4.6 The Netherlands - Market size and forecast 2025-2030

Chart on The Netherlands - Market size and forecast 2025-2030 ($ million)
Data Table on The Netherlands - Market size and forecast 2025-2030 ($ million)
Chart on The Netherlands - Year-over-year growth 2025-2030 (%)
Data Table on The Netherlands - Year-over-year growth 2025-2030 (%)

12.5 APAC - Market size and forecast 2025-2030

Chart on APAC - Market size and forecast 2025-2030 ($ million)
Data Table on APAC - Market size and forecast 2025-2030 ($ million)
Chart on APAC - Year-over-year growth 2025-2030 (%)
Data Table on APAC - Year-over-year growth 2025-2030 (%)
Chart on Regional Comparison - APAC
Data Table on Regional Comparison - APAC

12.5.1 China - Market size and forecast 2025-2030

Chart on China - Market size and forecast 2025-2030 ($ million)
Data Table on China - Market size and forecast 2025-2030 ($ million)
Chart on China - Year-over-year growth 2025-2030 (%)
Data Table on China - Year-over-year growth 2025-2030 (%)

12.5.2 Japan - Market size and forecast 2025-2030

Chart on Japan - Market size and forecast 2025-2030 ($ million)
Data Table on Japan - Market size and forecast 2025-2030 ($ million)
Chart on Japan - Year-over-year growth 2025-2030 (%)
Data Table on Japan - Year-over-year growth 2025-2030 (%)

12.5.3 India - Market size and forecast 2025-2030

Chart on India - Market size and forecast 2025-2030 ($ million)
Data Table on India - Market size and forecast 2025-2030 ($ million)
Chart on India - Year-over-year growth 2025-2030 (%)
Data Table on India - Year-over-year growth 2025-2030 (%)

12.5.4 South Korea - Market size and forecast 2025-2030

Chart on South Korea - Market size and forecast 2025-2030 ($ million)
Data Table on South Korea - Market size and forecast 2025-2030 ($ million)
Chart on South Korea - Year-over-year growth 2025-2030 (%)
Data Table on South Korea - Year-over-year growth 2025-2030 (%)

12.5.5 Australia - Market size and forecast 2025-2030

Chart on Australia - Market size and forecast 2025-2030 ($ million)
Data Table on Australia - Market size and forecast 2025-2030 ($ million)
Chart on Australia - Year-over-year growth 2025-2030 (%)
Data Table on Australia - Year-over-year growth 2025-2030 (%)

12.5.6 Indonesia - Market size and forecast 2025-2030

Chart on Indonesia - Market size and forecast 2025-2030 ($ million)
Data Table on Indonesia - Market size and forecast 2025-2030 ($ million)
Chart on Indonesia - Year-over-year growth 2025-2030 (%)
Data Table on Indonesia - Year-over-year growth 2025-2030 (%)

12.6 Middle East and Africa - Market size and forecast 2025-2030

Chart on Middle East and Africa - Market size and forecast 2025-2030 ($ million)
Data Table on Middle East and Africa - Market size and forecast 2025-2030 ($ million)
Chart on Middle East and Africa - Year-over-year growth 2025-2030 (%)
Data Table on Middle East and Africa - Year-over-year growth 2025-2030 (%)
Chart on Regional Comparison - Middle East and Africa
Data Table on Regional Comparison - Middle East and Africa

12.6.1 UAE - Market size and forecast 2025-2030

Chart on UAE - Market size and forecast 2025-2030 ($ million)
Data Table on UAE - Market size and forecast 2025-2030 ($ million)
Chart on UAE - Year-over-year growth 2025-2030 (%)
Data Table on UAE - Year-over-year growth 2025-2030 (%)

12.6.2 Saudi Arabia - Market size and forecast 2025-2030

Chart on Saudi Arabia - Market size and forecast 2025-2030 ($ million)
Data Table on Saudi Arabia - Market size and forecast 2025-2030 ($ million)
Chart on Saudi Arabia - Year-over-year growth 2025-2030 (%)
Data Table on Saudi Arabia - Year-over-year growth 2025-2030 (%)

12.6.3 Israel - Market size and forecast 2025-2030

Chart on Israel - Market size and forecast 2025-2030 ($ million)
Data Table on Israel - Market size and forecast 2025-2030 ($ million)
Chart on Israel - Year-over-year growth 2025-2030 (%)
Data Table on Israel - Year-over-year growth 2025-2030 (%)

12.6.4 South Africa - Market size and forecast 2025-2030

Chart on South Africa - Market size and forecast 2025-2030 ($ million)
Data Table on South Africa - Market size and forecast 2025-2030 ($ million)
Chart on South Africa - Year-over-year growth 2025-2030 (%)
Data Table on South Africa - Year-over-year growth 2025-2030 (%)

12.6.5 Turkey - Market size and forecast 2025-2030

Chart on Turkey - Market size and forecast 2025-2030 ($ million)
Data Table on Turkey - Market size and forecast 2025-2030 ($ million)
Chart on Turkey - Year-over-year growth 2025-2030 (%)
Data Table on Turkey - Year-over-year growth 2025-2030 (%)

12.7 South America - Market size and forecast 2025-2030

Chart on South America - Market size and forecast 2025-2030 ($ million)
Data Table on South America - Market size and forecast 2025-2030 ($ million)
Chart on South America - Year-over-year growth 2025-2030 (%)
Data Table on South America - Year-over-year growth 2025-2030 (%)
Chart on Regional Comparison - South America
Data Table on Regional Comparison - South America

12.7.1 Brazil - Market size and forecast 2025-2030

Chart on Brazil - Market size and forecast 2025-2030 ($ million)
Data Table on Brazil - Market size and forecast 2025-2030 ($ million)
Chart on Brazil - Year-over-year growth 2025-2030 (%)
Data Table on Brazil - Year-over-year growth 2025-2030 (%)

12.7.2 Argentina - Market size and forecast 2025-2030

Chart on Argentina - Market size and forecast 2025-2030 ($ million)
Data Table on Argentina - Market size and forecast 2025-2030 ($ million)
Chart on Argentina - Year-over-year growth 2025-2030 (%)
Data Table on Argentina - Year-over-year growth 2025-2030 (%)

12.7.3 Colombia - Market size and forecast 2025-2030

Chart on Colombia - Market size and forecast 2025-2030 ($ million)
Data Table on Colombia - Market size and forecast 2025-2030 ($ million)
Chart on Colombia - Year-over-year growth 2025-2030 (%)
Data Table on Colombia - Year-over-year growth 2025-2030 (%)

12.8 Market opportunity by geography

Market opportunity by geography ($ million)
Data Tables on Market opportunity by geography ($ million)

13. Drivers, Challenges, and Opportunity

13.1 Market drivers

Urgent necessity for supply chain resilience
Advancements in connectivity and edge computing speeds
Intense competition for hyper-personalized customer experiences

13.2 Market challenges

Regulatory fragmentation and data sovereignty compliance
Infrastructure latency and high computational costs
Interoperability with legacy enterprise systems

13.3 Impact of drivers and challenges

Impact of drivers and challenges in 2025 and 2030

13.4 Market opportunities

Shift toward multi-agentic AI orchestration
Integration of generative AI with deterministic decisioning
Emphasis on green and sustainable AI operations

14. Competitive Landscape

14.1 Overview

14.2

Overview on criticality of inputs and factors of differentiation

14.3 Landscape disruption

Overview on factors of disruption

14.4 Industry risks

Impact of key risks on business

15. Competitive Analysis

15.1 Companies profiled

Companies covered

15.2 Company ranking index

15.3 Market positioning of companies

Matrix on companies position and classification

15.4 Amazon Web Services Inc.

Amazon Web Services Inc. - Overview
Amazon Web Services Inc. - Product / Service
Amazon Web Services Inc. - Key offerings
SWOT

15.5 C3.ai Inc.

C3.ai Inc. - Overview
C3.ai Inc. - Product / Service
C3.ai Inc. - Key news
C3.ai Inc. - Key offerings
SWOT

15.6 Databricks Inc.

Databricks Inc. - Overview
Databricks Inc. - Product / Service
Databricks Inc. - Key offerings
SWOT

15.7 Fair Isaac Corp.

Fair Isaac Corp. - Overview
Fair Isaac Corp. - Business segments
Fair Isaac Corp. - Key news
Fair Isaac Corp. - Key offerings
Fair Isaac Corp. - Segment focus
SWOT

15.8 Google LLC

Google LLC - Overview
Google LLC - Product / Service
Google LLC - Key offerings
SWOT

15.9 H2O.ai Inc.

H2O.ai Inc. - Overview
H2O.ai Inc. - Product / Service
H2O.ai Inc. - Key offerings
SWOT

15.10 IBM Corp.

IBM Corp. - Overview
IBM Corp. - Business segments
IBM Corp. - Key news
IBM Corp. - Key offerings
IBM Corp. - Segment focus
SWOT

15.11 Microsoft Corp.

Microsoft Corp. - Overview
Microsoft Corp. - Business segments
Microsoft Corp. - Key news
Microsoft Corp. - Key offerings
Microsoft Corp. - Segment focus
SWOT

15.12 Oracle Corp.

Oracle Corp. - Overview
Oracle Corp. - Business segments
Oracle Corp. - Key news
Oracle Corp. - Key offerings
Oracle Corp. - Segment focus
SWOT

15.13 Palantir Technologies Inc.

Palantir Technologies Inc. - Overview
Palantir Technologies Inc. - Business segments
Palantir Technologies Inc. - Key offerings
Palantir Technologies Inc. - Segment focus
SWOT

15.14 Pegasystems Inc.

Pegasystems Inc. - Overview
Pegasystems Inc. - Business segments
Pegasystems Inc. - Key offerings
Pegasystems Inc. - Segment focus
SWOT

15.15 Salesforce Inc.

Salesforce Inc. - Overview
Salesforce Inc. - Business segments
Salesforce Inc. - Key news
Salesforce Inc. - Key offerings
Salesforce Inc. - Segment focus
SWOT

15.16 SAP SE

SAP SE - Overview
SAP SE - Business segments
SAP SE - Key news
SAP SE - Key offerings
SAP SE - Segment focus
SWOT

15.17 SAS Institute Inc.

SAS Institute Inc. - Overview
SAS Institute Inc. - Product / Service
SAS Institute Inc. - Key offerings
SWOT

15.18 ServiceNow Inc.

ServiceNow Inc. - Overview
ServiceNow Inc. - Product / Service
ServiceNow Inc. - Key news
ServiceNow Inc. - Key offerings
SWOT

16. Appendix

16.1 Scope of the report

Market definition
Objectives
Notes and caveats

16.2 Inclusions and exclusions checklist

Inclusions checklist
Exclusions checklist

16.3 Currency conversion rates for US$

16.4 Research methodology

16.5 Data procurement

Information sources

16.6 Data validation

16.7 Validation techniques employed for market sizing

16.8 Data synthesis

16.9 360 degree market analysis

16.10 List of abbreviations

Research Methodology

Technavio presents a detailed picture of the market by way of study, synthesis, and summation of data from multiple sources. The analysts have presented the various facets of the market with a particular focus on identifying the key industry influencers. The data thus presented is comprehensive, reliable, and the result of extensive research, both primary and secondary.

INFORMATION SOURCES

Primary sources

  • Manufacturers and suppliers
  • Channel partners
  • Industry experts
  • Strategic decision makers

Secondary sources

  • Industry journals and periodicals
  • Government data
  • Financial reports of key industry players
  • Historical data
  • Press releases

DATA ANALYSIS

Data Synthesis

  • Collation of data
  • Estimation of key figures
  • Analysis of derived insights

Data Validation

  • Triangulation with data models
  • Reference against proprietary databases
  • Corroboration with industry experts

REPORT WRITING

Qualitative

  • Market drivers
  • Market challenges
  • Market trends
  • Five forces analysis

Quantitative

  • Market size and forecast
  • Market segmentation
  • Geographical insights
  • Competitive landscape

Interested in this report?

Get your sample now to see our research methodology and insights!

Download Now

Frequently Asked Questions

Real-time AI Decisioning Platforms For Enterprise Operations market growth will increase by USD 12359.4 million during 2026-2030.

The Real-time AI Decisioning Platforms For Enterprise Operations market is expected to grow at a CAGR of 40% during 2026-2030.

Real-time AI Decisioning Platforms For Enterprise Operations market is segmented by Component (Solutions, Services) End-user (Large enterprises, SMEs) Deployment (Cloud-based, Hybrid, On-premises)

ACTICO GmbH, Aera Technology, Alteryx Inc., Amazon Web Services Inc., C3.ai Inc., Databricks Inc., DataRobot Inc., Experian Plc, Fair Isaac Corp., Google LLC, H2O.ai Inc., IBM Corp., InRule Technology Inc., Microsoft Corp., Oracle Corp., Palantir Technologies Inc., Pegasystems Inc., Salesforce Inc., SAP SE, SAS Institute Inc., ServiceNow Inc., Sparkling Logic, Teradata Corp., TIBCO Software Inc. are a few of the key vendors in the Real-time AI Decisioning Platforms For Enterprise Operations market.

North America will register the highest growth rate of 37.9% among the other regions. Therefore, the Real-time AI Decisioning Platforms For Enterprise Operations market in North America is expected to garner significant business opportunities for the vendors during the forecast period.

US, Canada, Mexico, Germany, UK, France, Spain, Italy, The Netherlands, China, Japan, India, South Korea, Australia, Indonesia, UAE, Saudi Arabia, Israel, South Africa, Turkey, Brazil, Argentina, Colombia

  • Urgent necessity for supply chain resilience is the driving factor this market.

The Real-time AI Decisioning Platforms For Enterprise Operations market vendors should focus on grabbing business opportunities from the Component segment as it accounted for the largest market share in the base year.
RIA - Research AI Assistant
Ask RIA