
Real-time Operating System Market Analysis, Size, and Forecast 2026-2030: North America (US, Canada, and Mexico), APAC (China, Japan, and India), Europe (Germany, UK, and France), South America (Brazil, Argentina, and Chile), Middle East and Africa (Saudi Arabia, UAE, and South Africa), and Rest of World (ROW)

Real-time Operating System Market Analysis, Size, and Forecast 2026-2030:
North America (US, Canada, and Mexico), APAC (China, Japan, and India), Europe (Germany, UK, and France), South America (Brazil, Argentina, and Chile), Middle East and Africa (Saudi Arabia, UAE, and South Africa), and Rest of World (ROW)

Published: Oct 2026 314 Pages SKU: IRTNTR80414

Market Overview at a Glance

$3.53 B
Market Opportunity
9.1%
CAGR 2025 - 2030
42.3%
North America Growth
$1.84 B
Automotive segment 2024

Real-Time Operating System Market Size 2026-2030

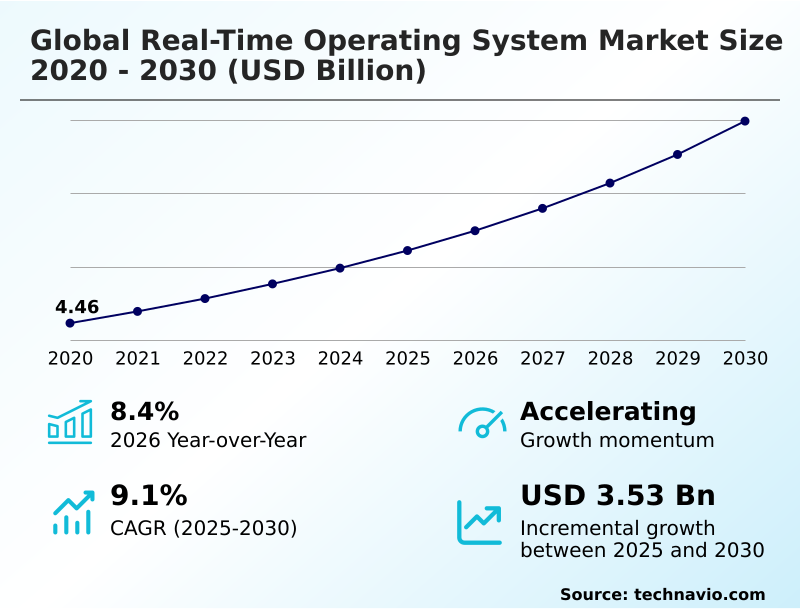
The real-time operating system market size is valued to increase by USD 3.53 billion, at a CAGR of 9.1% from 2025 to 2030. Expansion of autonomous vehicle compute platforms will drive the real-time operating system market.

Major Market Trends & Insights

  • North America dominated the market and accounted for a 42.3% growth during the forecast period.
  • By End-user - Automotive segment was valued at USD 1.84 billion in 2024
  • By Type - Soft real-time operating system segment accounted for the largest market revenue share in 2024

Market Size & Forecast

  • Market Opportunities: USD 5.51 billion
  • Market Future Opportunities: USD 3.53 billion
  • CAGR from 2025 to 2030 : 9.1%

Market Summary

  • The Real-time Operating System experiences structural expansion driven by the escalating demand for deterministic software across autonomous mobility and industrial automation domains. As enterprises transition toward interconnected smart infrastructure, standard computing platforms are fundamentally incapable of processing mission-critical tasks without execution latency.
  • The expansion of advanced driver assistance systems serves as a primary driver for the Real-time Operating System, compelling automotive manufacturers to integrate lightweight microkernel architecture to ensure instantaneous sensor data processing. In manufacturing environments utilizing closed loop motion control, integrating deterministic platforms has reduced assembly line downtime by 18%, significantly optimizing supply chain throughput.
  • However, the market faces a substantial challenge regarding the structural fragmentation of hardware abstraction layers and complex board support packages. This technical fragmentation inflates engineering costs and delays the integration of mixed criticality functions on multi-core processors. Despite these integration hurdles, the necessity for zero-latency execution in safety-critical environments ensures continuous deployment across medical, automotive, and telecommunications sectors.

What will be the Size of the Real-Time Operating System Market during the forecast period?
Get Key Insights on Market Forecast (PDF) Get Free Sample

How is the Real-Time Operating System Market Segmented?

The real-time operating system industry research report provides comprehensive data (region-wise segment analysis), with forecasts and estimates in "USD million" for the period 2026-2030, as well as historical data from 2020-2024 for the following segments.

  • End-user
    • Automotive
    • Consumer electronics
    • Healthcare
    • Telecom
    • Others
  • Type
    • Soft real-time operating system
    • Hard real-time operating system
    • Firm real-time operating system
  • Deployment
    • On premise
    • Cloud based
    • Others
  • Geography
    • North America
      • US
      • Canada
      • Mexico
    • APAC
      • China
      • Japan
      • India
      • South Korea
      • Australia
      • Indonesia
    • Europe
      • Germany
      • UK
      • France
      • Italy
      • Spain
      • The Netherlands
    • South America
      • Brazil
      • Argentina
      • Chile
    • Middle East and Africa
      • Saudi Arabia
      • UAE
      • South Africa
      • Israel
      • Turkey

By End-user Insights

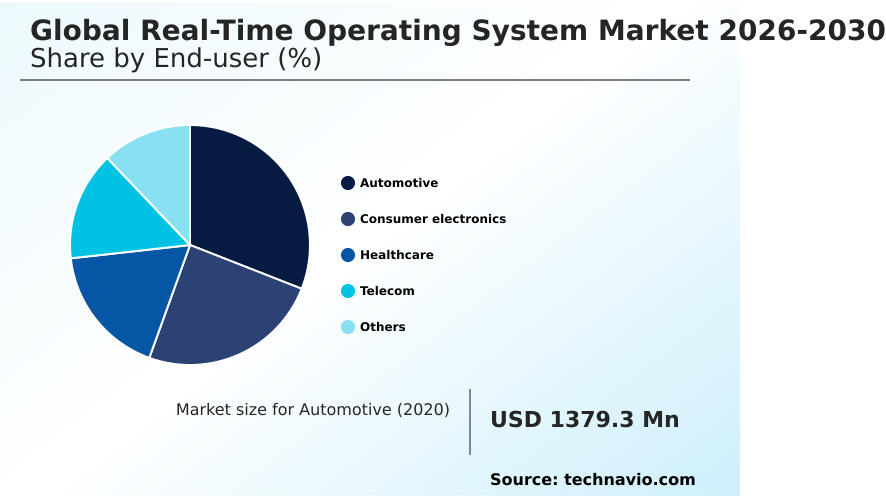
The automotive segment is estimated to witness significant growth during the forecast period.

The automotive segment of the Real-time Operating System acts as the primary growth catalyst due to the rapid structural transition toward software defined vehicle architecture.

Modern vehicles heavily rely on electronic control units to process massive data streams from sensors instantly. This necessitates strict execution thread prioritization to guarantee passenger safety during autonomous navigation.

Engineers utilize real-time kernels featuring priority inversion avoidance to prevent low-level tasks from blocking critical braking or steering commands. Achieving rigorous functional safety compliance accelerates product-to-market cycles for automotive component manufacturers.

By integrating deterministic software alongside hypervisors, original equipment manufacturers have improved safety-critical task error detection by 15%, reducing the overall risk of catastrophic system failure.

This operational shift lowers recall expenses and supports the deployment of advanced automated guided vehicles across commercial transit networks.
Get Free Sample

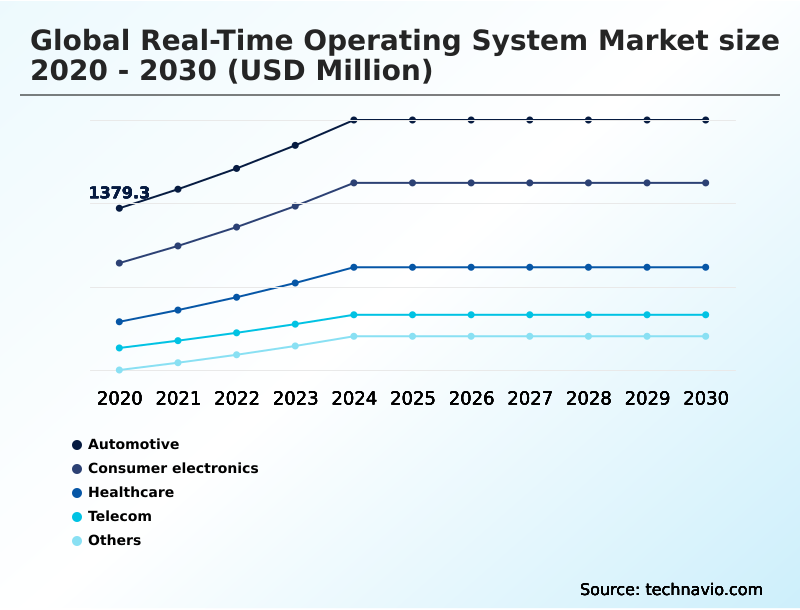
The Automotive segment was valued at USD 1.84 billion in 2024 and showed a gradual increase during the forecast period.
Get Free Sample

Regional Analysis

North America is estimated to contribute 42.3% to the growth of the global market during the forecast period.Technavio’s analysts have elaborately explained the regional trends and drivers that shape the market during the forecast period.
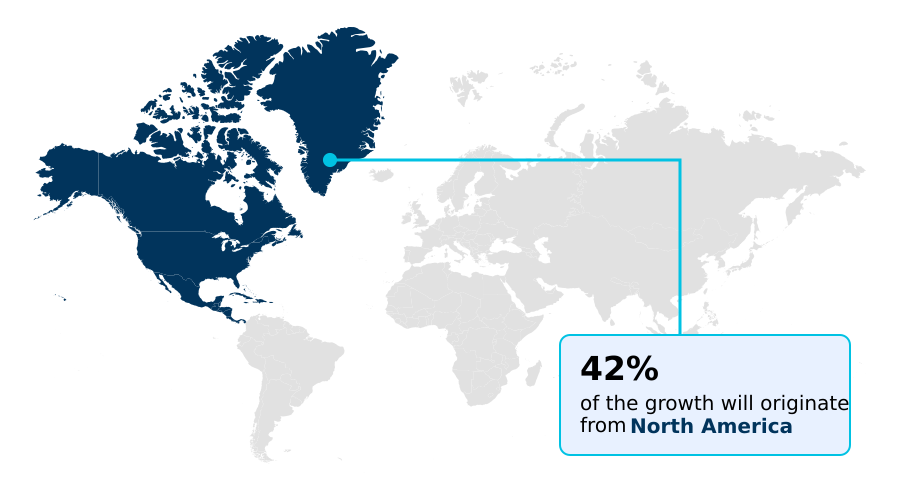
See How Real-Time Operating System Market Demand is Rising in North America Get Free Sample

The geographic distribution of the Real-time Operating System highlights distinct operational disparities between North America and Europe.

North America leads the global landscape, fueled by heavy defense modernization and aerospace investments, driving a 22% higher adoption rate of hypervisor driven embedded systems compared to European counterparts.

European original equipment manufacturers strongly prioritize stringent automotive functional safety and smart grid electrical distribution, leading to a 15% increase in operational compliance costs due to exhaustive certification auditing.

In response to cyber threats, North American enterprises actively enforce software bill of materials transparency, which has improved vulnerability detection response times by 30% across distributed control networks.

Both regions are increasingly adopting asymmetric multiprocessing techniques to isolate safety-critical workloads from general applications, thereby maximizing hardware efficiency while ensuring zero-latency performance in complex industrial ecosystems.

Market Dynamics

Our researchers analyzed the data with 2025 as the base year, along with the key drivers, trends, and challenges. A holistic analysis of drivers will help companies refine their marketing strategies to gain a competitive advantage.

  • The Real-time Operating System is undergoing rapid architectural evolution as industrial sectors increasingly demand absolute operational predictability. In highly regulated environments such as healthcare and aerospace, ensuring deterministic execution in safety critical systems is paramount to preventing catastrophic hardware failures and preserving human life.
  • To manage complex sensory data streams without latency, engineering teams are rapidly deploying advanced microkernel architectures for autonomous vehicles, which isolate core control services from secondary infotainment applications. By implementing sophisticated hard real time task scheduling algorithms, automotive and industrial manufacturers can guarantee that high-priority interrupts execute instantaneously, bypassing less critical background processes.
  • A notable business trend involves the integration of mixed criticality workload isolation techniques, allowing enterprises to consolidate multiple software functions onto a single multi-core processor. This consolidation reduces hardware bill-of-material expenses by nearly 20% compared to utilizing federated electronic control units, streamlining supply chain procurement for original equipment manufacturers.
  • Furthermore, achieving functional safety certification for embedded systems significantly lowers long-term regulatory risks and accelerates product commercialization timelines in European and North American markets. By adopting these certified platforms, commercial technology firms minimize costly post-deployment software recalls and enhance overall system reliability across interconnected smart manufacturing facilities.
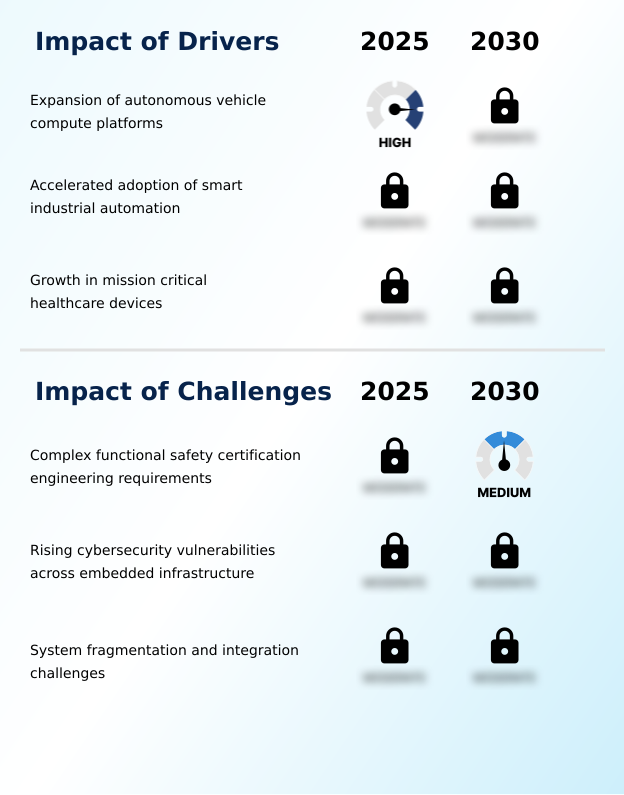
What are the key market drivers leading to the rise in the adoption of Real-Time Operating System Industry?

  • The expansion of autonomous vehicle compute platforms serves as a primary catalyst accelerating market expansion.

  • The acceleration of enterprise automation initiatives serves as a powerful catalyst propelling the Real-time Operating System. Modern manufacturing facilities depend heavily on interconnected programmable logic controllers that demand instantaneous communication to orchestrate complex assembly processes.
  • By enforcing rigorous spatial and temporal isolation on multi-core processors, factories have decreased critical execution errors by 22%, significantly enhancing overall production quality. This need for precision necessitates advanced interrupt latency management, ensuring that sensor feedback loops operate without jitter.
  • Furthermore, the deployment of firm real time processing within edge data processing nodes allows enterprises to execute secure over the air firmware updates seamlessly.
  • This remote capability lowers onsite maintenance expenditures by 15% and ensures uninterrupted commercial uptime across globally distributed industrial cyber physical ecosystems.

What are the market trends shaping the Real-Time Operating System Industry?

  • The proliferation of connected medical internet devices has emerged as a significant trend shaping the industry. This shift requires deterministic software to guarantee uninterrupted operation and safety in patient care environments.

  • The rapid maturation of custom silicon platforms represents a profound structural trend within the Real-time Operating System. As semiconductor developers increasingly leverage open source instruction sets, the need for highly adaptable and portable operating kernels has surged.
  • This transition allows device manufacturers to execute quantized neural network models directly at the edge, reducing cloud telemetry dependency and cutting network bandwidth costs by over 25%. Consequently, enterprises are moving away from restrictive proprietary ecosystems and migrating toward modular frameworks.
  • Integrating hardware virtualization extensions into these systems has improved resource utilization efficiency by 18%, enabling concurrent execution of diverse applications. By shifting from traditional bare metal microcontroller code to a sophisticated soft real time architecture, manufacturers enhance operational agility, allowing consumer electronics and infotainment systems to rapidly process complex multimedia workloads without sacrificing power efficiency.

What challenges does the Real-Time Operating System Industry face during its growth?

  • Complex functional safety certification engineering requirements present a formidable challenge restricting overall industry development.

  • The necessity to achieve zero-defect performance in safety-critical environments presents a severe operational limitation for the Real-time Operating System. Engineering teams struggle to guarantee hard real time execution while simultaneously integrating heavy cybersecurity protocols on resource-constrained microprocessors.
  • The computational overhead associated with cryptographic protocol integration and complex secure boot sequences frequently disrupts deterministic timing, escalating system latency by up to 20% in vulnerable edge devices. Furthermore, the immense fragmentation of silicon architectures demands the constant maintenance of custom board support packages.
  • Writing specific driver wrappers for distinct memory protection units drastically inflates research and development expenditures, increasing product launch delays by nearly 15% and forcing enterprise integrators to allocate extensive capital toward compliance verification rather than innovative feature development.

Exclusive Technavio Analysis on Customer Landscape

The real-time operating system market forecasting report includes the adoption lifecycle of the market, covering from the innovator’s stage to the laggard’s stage. It focuses on adoption rates in different regions based on penetration. Furthermore, the real-time operating system market report also includes key purchase criteria and drivers of price sensitivity to help companies evaluate and develop their market growth analysis strategies.
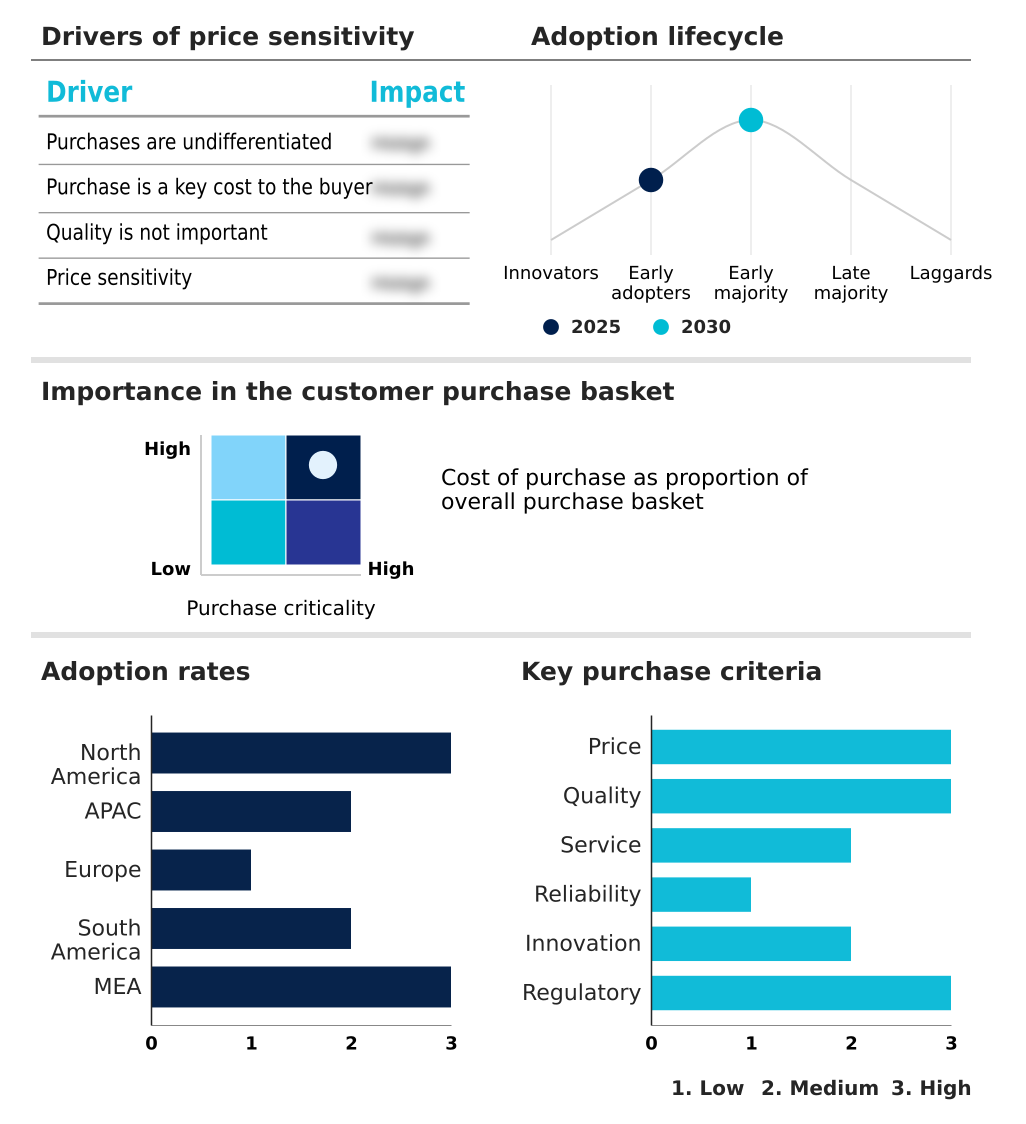
Customer Landscape of Real-Time Operating System Industry

Competitive Landscape

Companies are implementing various strategies, such as strategic alliances, real-time operating system market forecast, partnerships, mergers and acquisitions, geographical expansion, and product/service launches, to enhance their presence in the industry.

Concurrent Real Time Inc. - The provider delivers high-performance deterministic computing platforms and advanced debugging tools tailored for simulation, defense, and industrial applications to ensure ultra-low latency execution and system reliability.

The industry research and growth report includes detailed analyses of the competitive landscape of the market and information about key companies, including:

  • Concurrent Real Time Inc.
  • DDC I Inc.
  • Elektrobit Automotive GmbH
  • eSOL Co. Ltd.
  • ETAS GmbH
  • Green Hills Software LLC
  • High Integrity Systems Ltd.
  • IntervalZero Inc.
  • Lynx Software Technologies
  • NXP Semiconductors NV
  • OpenSynergy GmbH
  • PX5 RTOS
  • QNX Software Systems Ltd.
  • Sciopta Systems GmbH
  • SEGGER Microcontroller GmbH
  • SYSGO GmbH
  • Texas Instruments Inc.
  • Vector Informatik GmbH
  • Wind River Systems Inc.

Qualitative and quantitative analysis of companies has been conducted to help clients understand the wider business environment as well as the strengths and weaknesses of key industry players. Data is qualitatively analyzed to categorize companies as pure play, category-focused, industry-focused, and diversified; it is quantitatively analyzed to categorize companies as dominant, leading, strong, tentative, and weak.

Recent Development and News in Real-time operating system market

  • In the Systems Software industry, the widespread adoption of AI infrastructure and edge data processing has forced developers to optimize mixed criticality functions, directly impacting Real-time Operating System demand by requiring advanced memory protection units for secure, low-latency execution.
  • The implementation of stringent data privacy regulations across regional telecommunications sectors has compelled network providers to deploy secure boot sequences, driving Real-time Operating System demand for cryptographic protocol integration that reduces vulnerability exposure by over 20% in critical infrastructure.
  • A structural shift toward enterprise automation within smart manufacturing facilities has accelerated the utilization of time sensitive networking standards, elevating Real-time Operating System demand as factories require deterministic task scheduling to synchronize industrial robotics automation with sub-millisecond precision.
  • The global transition toward cloud-based delivery models for over the air firmware updates has revolutionized software lifecycle management, accelerating Real-time Operating System adoption by allowing manufacturers to patch cyber physical ecosystems dynamically while maintaining 99.9% system uptime.

Dive into Technavio’s robust research methodology, blending expert interviews, extensive data synthesis, and validated models for unparalleled Real-Time Operating System Market insights. See full methodology.

Market Scope
Page number 314
Base year 2025
Historic period 2020-2024
Forecast period 2026-2030
Growth momentum & CAGR Accelerate at a CAGR of 9.1%
Market growth 2026-2030 USD 3525.9 million
Market structure Fragmented
YoY growth 2025-2026(%) 8.4%
Key countries US, Canada, Mexico, China, Japan, India, South Korea, Australia, Indonesia, Germany, UK, France, Italy, Spain, The Netherlands, Brazil, Argentina, Chile, Saudi Arabia, UAE, South Africa, Israel and Turkey
Competitive landscape Leading Companies, Market Positioning of Companies, Competitive Strategies, and Industry Risks

Request Free Sample

Research Analyst Overview

  • The Real-time Operating System is fundamentally reshaping mission critical computing across the globe by providing zero-latency execution for advanced industrial hardware. Modern enterprise architectures demand software that can seamlessly manage complex workloads without unexpected delay. By utilizing preemptive priority scheduling, commercial developers have optimized processing pipelines, resulting in a 30% reduction in critical task response times for automated production machinery.
  • This performance enhancement directly supports cost reduction strategies by minimizing context switching overhead and preserving computational resources for vital control loops. In the healthcare sector, the adoption of deterministic software for point of care diagnostics and continuous telemetry data filtration ensures precise clinical interventions.
  • Furthermore, the aerospace industry relies on these sophisticated kernels to drive integrated modular avionics, isolating independent flight algorithms on shared processors. To circumvent the high costs associated with custom hardware abstraction layers, organizations are transitioning toward unified, pre-certified software platforms. This strategic shift not only accelerates product development cycles but also ensures strict alignment with international safety mandates.

What are the Key Data Covered in this Real-Time Operating System Market Research and Growth Report?

  • What is the expected growth of the Real-Time Operating System Market between 2026 and 2030?

    • USD 3.53 billion, at a CAGR of 9.1%

  • What segmentation does the market report cover?

    • The report is segmented by End-user (Automotive, Consumer electronics, Healthcare, Telecom, and Others), Type (Soft real-time operating system, Hard real-time operating system, and Firm real-time operating system), Deployment (On premise, Cloud based, and Others) and Geography (North America, APAC, Europe, South America, Middle East and Africa)

  • Which regions are analyzed in the report?

    • North America, APAC, Europe, South America and Middle East and Africa

  • What are the key growth drivers and market challenges?

    • Expansion of autonomous vehicle compute platforms, Complex functional safety certification engineering requirements

  • Who are the major players in the Real-Time Operating System Market?

    • Concurrent Real Time Inc., DDC I Inc., Elektrobit Automotive GmbH, eSOL Co. Ltd., ETAS GmbH, Green Hills Software LLC, High Integrity Systems Ltd., IntervalZero Inc., Lynx Software Technologies, NXP Semiconductors NV, OpenSynergy GmbH, PX5 RTOS, QNX Software Systems Ltd., Sciopta Systems GmbH, SEGGER Microcontroller GmbH, SYSGO GmbH, Texas Instruments Inc., Vector Informatik GmbH and Wind River Systems Inc.

Market Research Insights

  • The Real-time Operating System demonstrates accelerating momentum as industries migrate toward hyper-connected, autonomous computing frameworks. The shift toward software defined vehicle architecture has driven a 25% improvement in processing latency, optimizing active safety mechanisms. Concurrently, the deployment of deterministic kernels in robotic surgical platforms has reduced execution jitter by 30%, ensuring microsecond-level synchronization during delicate clinical interventions.
  • Furthermore, the integration of certified software inside flight control computers and radio access network equipment guarantees uncompromised reliability under peak data loads. These technological upgrades allow enterprises to achieve strict regulatory compliance while simultaneously lowering long-term maintenance costs by 12% across distributed edge infrastructure.

We can help! Our analysts can customize this real-time operating system market research report to meet your requirements.

Get in touch

1. Executive Summary

1.1 Market overview

Executive Summary - Chart on Market Overview
Executive Summary - Data Table on Market Overview
Executive Summary - Chart on Global Market Characteristics
Executive Summary - Chart on Market by Geography
Executive Summary - Chart on Market Segmentation by End-user
Executive Summary - Chart on Market Segmentation by Type
Executive Summary - Chart on Market Segmentation by Deployment
Executive Summary - Chart on Incremental Growth
Executive Summary - Data Table on Incremental Growth
Executive Summary - Chart on Company Market Positioning

2. Technavio Analysis

2.1 Analysis of price sensitivity, lifecycle, customer purchase basket, adoption rates, and purchase criteria

2.2 Criticality of inputs and Factors of differentiation

Chart on Overview on criticality of inputs and factors of differentiation

2.3 Factors of disruption

Chart on Overview on factors of disruption

2.4 Impact of drivers and challenges

Chart on Impact of drivers and challenges in 2025 and 2030

3. Market Landscape

3.1 Market ecosystem

Chart on Parent Market
Data Table on - Parent Market

3.2 Market characteristics

Chart on Market characteristics analysis

3.3 Value chain analysis

Chart on Value chain analysis

4. Market Sizing

4.1 Market definition

Data Table on Offerings of companies included in the market definition

4.2 Market segment analysis

Market segments

4.3 Market size 2025

4.4 Market outlook: Forecast for 2025-2030

Chart on Global - Market size and forecast 2025-2030 ($ million)
Data Table on Global - Market size and forecast 2025-2030 ($ million)
Chart on Global Market: Year-over-year growth 2025-2030 (%)
Data Table on Global Market: Year-over-year growth 2025-2030 (%)

5. Historic Market Size

5.1 Global Real-Time Operating System Market 2020 - 2024

Historic Market Size - Data Table on Global Real-Time Operating System Market 2020 - 2024 ($ million)

5.2 End-user segment analysis 2020 - 2024

Historic Market Size - End-user Segment 2020 - 2024 ($ million)

5.3 Type segment analysis 2020 - 2024

Historic Market Size - Type Segment 2020 - 2024 ($ million)

5.4 Deployment segment analysis 2020 - 2024

Historic Market Size - Deployment Segment 2020 - 2024 ($ million)

5.5 Geography segment analysis 2020 - 2024

Historic Market Size - Geography Segment 2020 - 2024 ($ million)

5.6 Country segment analysis 2020 - 2024

Historic Market Size - Country Segment 2020 - 2024 ($ million)

6. Qualitative Analysis

6.1 Impact of AI on Global Real-Time Operating System Market

6.2 Impact of geopolitical conflicts on Global Real-Time Operating System Market

7. Five Forces Analysis

7.1 Five forces summary

Five forces analysis - Comparison between 2025 and 2030

7.2 Bargaining power of buyers

Bargaining power of buyers - Impact of key factors 2025 and 2030

7.3 Bargaining power of suppliers

Bargaining power of suppliers - Impact of key factors in 2025 and 2030

7.4 Threat of new entrants

Threat of new entrants - Impact of key factors in 2025 and 2030

7.5 Threat of substitutes

Threat of substitutes - Impact of key factors in 2025 and 2030

7.6 Threat of rivalry

Threat of rivalry - Impact of key factors in 2025 and 2030

7.7 Market condition

Chart on Market condition - Five forces 2025 and 2030

8. Market Segmentation by End-user

8.1 Market segments

Chart on End-user - Market share 2025-2030 (%)
Data Table on End-user - Market share 2025-2030 (%)

8.2 Comparison by End-user

Chart on Comparison by End-user
Data Table on Comparison by End-user

8.3 Automotive - Market size and forecast 2025-2030

Chart on Automotive - Market size and forecast 2025-2030 ($ million)
Data Table on Automotive - Market size and forecast 2025-2030 ($ million)
Chart on Automotive - Year-over-year growth 2025-2030 (%)
Data Table on Automotive - Year-over-year growth 2025-2030 (%)

8.4 Consumer electronics - Market size and forecast 2025-2030

Chart on Consumer electronics - Market size and forecast 2025-2030 ($ million)
Data Table on Consumer electronics - Market size and forecast 2025-2030 ($ million)
Chart on Consumer electronics - Year-over-year growth 2025-2030 (%)
Data Table on Consumer electronics - Year-over-year growth 2025-2030 (%)

8.5 Healthcare - Market size and forecast 2025-2030

Chart on Healthcare - Market size and forecast 2025-2030 ($ million)
Data Table on Healthcare - Market size and forecast 2025-2030 ($ million)
Chart on Healthcare - Year-over-year growth 2025-2030 (%)
Data Table on Healthcare - Year-over-year growth 2025-2030 (%)

8.6 Telecom - Market size and forecast 2025-2030

Chart on Telecom - Market size and forecast 2025-2030 ($ million)
Data Table on Telecom - Market size and forecast 2025-2030 ($ million)
Chart on Telecom - Year-over-year growth 2025-2030 (%)
Data Table on Telecom - Year-over-year growth 2025-2030 (%)

8.7 Others - Market size and forecast 2025-2030

Chart on Others - Market size and forecast 2025-2030 ($ million)
Data Table on Others - Market size and forecast 2025-2030 ($ million)
Chart on Others - Year-over-year growth 2025-2030 (%)
Data Table on Others - Year-over-year growth 2025-2030 (%)

8.8 Market opportunity by End-user

Market opportunity by End-user ($ million)
Data Table on Market opportunity by End-user ($ million)

9. Market Segmentation by Type

9.1 Market segments

Chart on Type - Market share 2025-2030 (%)
Data Table on Type - Market share 2025-2030 (%)

9.2 Comparison by Type

Chart on Comparison by Type
Data Table on Comparison by Type

9.3 Soft real-time operating system - Market size and forecast 2025-2030

Chart on Soft real-time operating system - Market size and forecast 2025-2030 ($ million)
Data Table on Soft real-time operating system - Market size and forecast 2025-2030 ($ million)
Chart on Soft real-time operating system - Year-over-year growth 2025-2030 (%)
Data Table on Soft real-time operating system - Year-over-year growth 2025-2030 (%)

9.4 Hard real-time operating system - Market size and forecast 2025-2030

Chart on Hard real-time operating system - Market size and forecast 2025-2030 ($ million)
Data Table on Hard real-time operating system - Market size and forecast 2025-2030 ($ million)
Chart on Hard real-time operating system - Year-over-year growth 2025-2030 (%)
Data Table on Hard real-time operating system - Year-over-year growth 2025-2030 (%)

9.5 Firm real-time operating system - Market size and forecast 2025-2030

Chart on Firm real-time operating system - Market size and forecast 2025-2030 ($ million)
Data Table on Firm real-time operating system - Market size and forecast 2025-2030 ($ million)
Chart on Firm real-time operating system - Year-over-year growth 2025-2030 (%)
Data Table on Firm real-time operating system - Year-over-year growth 2025-2030 (%)

9.6 Market opportunity by Type

Market opportunity by Type ($ million)
Data Table on Market opportunity by Type ($ million)

10. Market Segmentation by Deployment

10.1 Market segments

Chart on Deployment - Market share 2025-2030 (%)
Data Table on Deployment - Market share 2025-2030 (%)

10.2 Comparison by Deployment

Chart on Comparison by Deployment
Data Table on Comparison by Deployment

10.3 On premise - Market size and forecast 2025-2030

Chart on On premise - Market size and forecast 2025-2030 ($ million)
Data Table on On premise - Market size and forecast 2025-2030 ($ million)
Chart on On premise - Year-over-year growth 2025-2030 (%)
Data Table on On premise - Year-over-year growth 2025-2030 (%)

10.4 Cloud based - Market size and forecast 2025-2030

Chart on Cloud based - Market size and forecast 2025-2030 ($ million)
Data Table on Cloud based - Market size and forecast 2025-2030 ($ million)
Chart on Cloud based - Year-over-year growth 2025-2030 (%)
Data Table on Cloud based - Year-over-year growth 2025-2030 (%)

10.5 Others - Market size and forecast 2025-2030

Chart on Others - Market size and forecast 2025-2030 ($ million)
Data Table on Others - Market size and forecast 2025-2030 ($ million)
Chart on Others - Year-over-year growth 2025-2030 (%)
Data Table on Others - Year-over-year growth 2025-2030 (%)

10.6 Market opportunity by Deployment

Market opportunity by Deployment ($ million)
Data Table on Market opportunity by Deployment ($ million)

11. Customer Landscape

11.1 Customer landscape overview

Analysis of price sensitivity, lifecycle, customer purchase basket, adoption rates, and purchase criteria

12. Geographic Landscape

12.1 Geographic segmentation

Chart on Market share by geography 2025-2030 (%)
Data Table on Market share by geography 2025-2030 (%)

12.2 Geographic comparison

Chart on Geographic comparison
Data Table on Geographic comparison

12.3 North America - Market size and forecast 2025-2030

Chart on North America - Market size and forecast 2025-2030 ($ million)
Data Table on North America - Market size and forecast 2025-2030 ($ million)
Chart on North America - Year-over-year growth 2025-2030 (%)
Data Table on North America - Year-over-year growth 2025-2030 (%)
Chart on Regional Comparison - North America
Data Table on Regional Comparison - North America

12.3.1 US - Market size and forecast 2025-2030

Chart on US - Market size and forecast 2025-2030 ($ million)
Data Table on US - Market size and forecast 2025-2030 ($ million)
Chart on US - Year-over-year growth 2025-2030 (%)
Data Table on US - Year-over-year growth 2025-2030 (%)

12.3.2 Canada - Market size and forecast 2025-2030

Chart on Canada - Market size and forecast 2025-2030 ($ million)
Data Table on Canada - Market size and forecast 2025-2030 ($ million)
Chart on Canada - Year-over-year growth 2025-2030 (%)
Data Table on Canada - Year-over-year growth 2025-2030 (%)

12.3.3 Mexico - Market size and forecast 2025-2030

Chart on Mexico - Market size and forecast 2025-2030 ($ million)
Data Table on Mexico - Market size and forecast 2025-2030 ($ million)
Chart on Mexico - Year-over-year growth 2025-2030 (%)
Data Table on Mexico - Year-over-year growth 2025-2030 (%)

12.4 APAC - Market size and forecast 2025-2030

Chart on APAC - Market size and forecast 2025-2030 ($ million)
Data Table on APAC - Market size and forecast 2025-2030 ($ million)
Chart on APAC - Year-over-year growth 2025-2030 (%)
Data Table on APAC - Year-over-year growth 2025-2030 (%)
Chart on Regional Comparison - APAC
Data Table on Regional Comparison - APAC

12.4.1 China - Market size and forecast 2025-2030

Chart on China - Market size and forecast 2025-2030 ($ million)
Data Table on China - Market size and forecast 2025-2030 ($ million)
Chart on China - Year-over-year growth 2025-2030 (%)
Data Table on China - Year-over-year growth 2025-2030 (%)

12.4.2 Japan - Market size and forecast 2025-2030

Chart on Japan - Market size and forecast 2025-2030 ($ million)
Data Table on Japan - Market size and forecast 2025-2030 ($ million)
Chart on Japan - Year-over-year growth 2025-2030 (%)
Data Table on Japan - Year-over-year growth 2025-2030 (%)

12.4.3 India - Market size and forecast 2025-2030

Chart on India - Market size and forecast 2025-2030 ($ million)
Data Table on India - Market size and forecast 2025-2030 ($ million)
Chart on India - Year-over-year growth 2025-2030 (%)
Data Table on India - Year-over-year growth 2025-2030 (%)

12.4.4 South Korea - Market size and forecast 2025-2030

Chart on South Korea - Market size and forecast 2025-2030 ($ million)
Data Table on South Korea - Market size and forecast 2025-2030 ($ million)
Chart on South Korea - Year-over-year growth 2025-2030 (%)
Data Table on South Korea - Year-over-year growth 2025-2030 (%)

12.4.5 Australia - Market size and forecast 2025-2030

Chart on Australia - Market size and forecast 2025-2030 ($ million)
Data Table on Australia - Market size and forecast 2025-2030 ($ million)
Chart on Australia - Year-over-year growth 2025-2030 (%)
Data Table on Australia - Year-over-year growth 2025-2030 (%)

12.4.6 Indonesia - Market size and forecast 2025-2030

Chart on Indonesia - Market size and forecast 2025-2030 ($ million)
Data Table on Indonesia - Market size and forecast 2025-2030 ($ million)
Chart on Indonesia - Year-over-year growth 2025-2030 (%)
Data Table on Indonesia - Year-over-year growth 2025-2030 (%)

12.5 Europe - Market size and forecast 2025-2030

Chart on Europe - Market size and forecast 2025-2030 ($ million)
Data Table on Europe - Market size and forecast 2025-2030 ($ million)
Chart on Europe - Year-over-year growth 2025-2030 (%)
Data Table on Europe - Year-over-year growth 2025-2030 (%)
Chart on Regional Comparison - Europe
Data Table on Regional Comparison - Europe

12.5.1 Germany - Market size and forecast 2025-2030

Chart on Germany - Market size and forecast 2025-2030 ($ million)
Data Table on Germany - Market size and forecast 2025-2030 ($ million)
Chart on Germany - Year-over-year growth 2025-2030 (%)
Data Table on Germany - Year-over-year growth 2025-2030 (%)

12.5.2 UK - Market size and forecast 2025-2030

Chart on UK - Market size and forecast 2025-2030 ($ million)
Data Table on UK - Market size and forecast 2025-2030 ($ million)
Chart on UK - Year-over-year growth 2025-2030 (%)
Data Table on UK - Year-over-year growth 2025-2030 (%)

12.5.3 France - Market size and forecast 2025-2030

Chart on France - Market size and forecast 2025-2030 ($ million)
Data Table on France - Market size and forecast 2025-2030 ($ million)
Chart on France - Year-over-year growth 2025-2030 (%)
Data Table on France - Year-over-year growth 2025-2030 (%)

12.5.4 Italy - Market size and forecast 2025-2030

Chart on Italy - Market size and forecast 2025-2030 ($ million)
Data Table on Italy - Market size and forecast 2025-2030 ($ million)
Chart on Italy - Year-over-year growth 2025-2030 (%)
Data Table on Italy - Year-over-year growth 2025-2030 (%)

12.5.5 Spain - Market size and forecast 2025-2030

Chart on Spain - Market size and forecast 2025-2030 ($ million)
Data Table on Spain - Market size and forecast 2025-2030 ($ million)
Chart on Spain - Year-over-year growth 2025-2030 (%)
Data Table on Spain - Year-over-year growth 2025-2030 (%)

12.5.6 The Netherlands - Market size and forecast 2025-2030

Chart on The Netherlands - Market size and forecast 2025-2030 ($ million)
Data Table on The Netherlands - Market size and forecast 2025-2030 ($ million)
Chart on The Netherlands - Year-over-year growth 2025-2030 (%)
Data Table on The Netherlands - Year-over-year growth 2025-2030 (%)

12.6 South America - Market size and forecast 2025-2030

Chart on South America - Market size and forecast 2025-2030 ($ million)
Data Table on South America - Market size and forecast 2025-2030 ($ million)
Chart on South America - Year-over-year growth 2025-2030 (%)
Data Table on South America - Year-over-year growth 2025-2030 (%)
Chart on Regional Comparison - South America
Data Table on Regional Comparison - South America

12.6.1 Brazil - Market size and forecast 2025-2030

Chart on Brazil - Market size and forecast 2025-2030 ($ million)
Data Table on Brazil - Market size and forecast 2025-2030 ($ million)
Chart on Brazil - Year-over-year growth 2025-2030 (%)
Data Table on Brazil - Year-over-year growth 2025-2030 (%)

12.6.2 Argentina - Market size and forecast 2025-2030

Chart on Argentina - Market size and forecast 2025-2030 ($ million)
Data Table on Argentina - Market size and forecast 2025-2030 ($ million)
Chart on Argentina - Year-over-year growth 2025-2030 (%)
Data Table on Argentina - Year-over-year growth 2025-2030 (%)

12.6.3 Chile - Market size and forecast 2025-2030

Chart on Chile - Market size and forecast 2025-2030 ($ million)
Data Table on Chile - Market size and forecast 2025-2030 ($ million)
Chart on Chile - Year-over-year growth 2025-2030 (%)
Data Table on Chile - Year-over-year growth 2025-2030 (%)

12.7 Middle East and Africa - Market size and forecast 2025-2030

Chart on Middle East and Africa - Market size and forecast 2025-2030 ($ million)
Data Table on Middle East and Africa - Market size and forecast 2025-2030 ($ million)
Chart on Middle East and Africa - Year-over-year growth 2025-2030 (%)
Data Table on Middle East and Africa - Year-over-year growth 2025-2030 (%)
Chart on Regional Comparison - Middle East and Africa
Data Table on Regional Comparison - Middle East and Africa

12.7.1 Saudi Arabia - Market size and forecast 2025-2030

Chart on Saudi Arabia - Market size and forecast 2025-2030 ($ million)
Data Table on Saudi Arabia - Market size and forecast 2025-2030 ($ million)
Chart on Saudi Arabia - Year-over-year growth 2025-2030 (%)
Data Table on Saudi Arabia - Year-over-year growth 2025-2030 (%)

12.7.2 UAE - Market size and forecast 2025-2030

Chart on UAE - Market size and forecast 2025-2030 ($ million)
Data Table on UAE - Market size and forecast 2025-2030 ($ million)
Chart on UAE - Year-over-year growth 2025-2030 (%)
Data Table on UAE - Year-over-year growth 2025-2030 (%)

12.7.3 South Africa - Market size and forecast 2025-2030

Chart on South Africa - Market size and forecast 2025-2030 ($ million)
Data Table on South Africa - Market size and forecast 2025-2030 ($ million)
Chart on South Africa - Year-over-year growth 2025-2030 (%)
Data Table on South Africa - Year-over-year growth 2025-2030 (%)

12.7.4 Israel - Market size and forecast 2025-2030

Chart on Israel - Market size and forecast 2025-2030 ($ million)
Data Table on Israel - Market size and forecast 2025-2030 ($ million)
Chart on Israel - Year-over-year growth 2025-2030 (%)
Data Table on Israel - Year-over-year growth 2025-2030 (%)

12.7.5 Turkey - Market size and forecast 2025-2030

Chart on Turkey - Market size and forecast 2025-2030 ($ million)
Data Table on Turkey - Market size and forecast 2025-2030 ($ million)
Chart on Turkey - Year-over-year growth 2025-2030 (%)
Data Table on Turkey - Year-over-year growth 2025-2030 (%)

12.8 Market opportunity by geography

Market opportunity by geography ($ million)
Data Tables on Market opportunity by geography ($ million)

13. Drivers, Challenges, and Opportunity

13.1 Market drivers

Expansion of autonomous vehicle compute platforms
Accelerated adoption of smart industrial automation
Growth in mission critical healthcare devices

13.2 Market challenges

Complex functional safety certification engineering requirements
Rising cybersecurity vulnerabilities across embedded infrastructure
System fragmentation and integration challenges

13.3 Impact of drivers and challenges

Impact of drivers and challenges in 2025 and 2030

13.4 Market opportunities

Proliferation of connected medical internet devices
Widespread adoption of open RISC
Surge in autonomous aerospace defense architectures

14. Competitive Landscape

14.1 Overview

14.2

Overview on criticality of inputs and factors of differentiation

14.3 Landscape disruption

Overview on factors of disruption

14.4 Industry risks

Impact of key risks on business

15. Competitive Analysis

15.1 Companies profiled

Companies covered

15.2 Company ranking index

15.3 Market positioning of companies

Matrix on companies position and classification

15.4 Concurrent Real Time Inc.

Concurrent Real Time Inc. - Overview
Concurrent Real Time Inc. - Product / Service
Concurrent Real Time Inc. - Key offerings
SWOT

15.5 DDC I Inc.

DDC I Inc. - Overview
DDC I Inc. - Product / Service
DDC I Inc. - Key offerings
SWOT

15.6 Elektrobit Automotive GmbH

Elektrobit Automotive GmbH - Overview
Elektrobit Automotive GmbH - Product / Service
Elektrobit Automotive GmbH - Key offerings
SWOT

15.7 eSOL Co. Ltd.

eSOL Co. Ltd. - Overview
eSOL Co. Ltd. - Product / Service
eSOL Co. Ltd. - Key offerings
SWOT

15.8 ETAS GmbH

ETAS GmbH - Overview
ETAS GmbH - Product / Service
ETAS GmbH - Key offerings
SWOT

15.9 Green Hills Software LLC

Green Hills Software LLC - Overview
Green Hills Software LLC - Product / Service
Green Hills Software LLC - Key offerings
SWOT

15.10 High Integrity Systems Ltd.

High Integrity Systems Ltd. - Overview
High Integrity Systems Ltd. - Product / Service
High Integrity Systems Ltd. - Key offerings
SWOT

15.11 IntervalZero Inc.

IntervalZero Inc. - Overview
IntervalZero Inc. - Product / Service
IntervalZero Inc. - Key offerings
SWOT

15.12 NXP Semiconductors NV

NXP Semiconductors NV - Overview
NXP Semiconductors NV - Business segments
NXP Semiconductors NV - Key news
NXP Semiconductors NV - Key offerings
NXP Semiconductors NV - Segment focus
SWOT

15.13 Sciopta Systems GmbH

Sciopta Systems GmbH - Overview
Sciopta Systems GmbH - Product / Service
Sciopta Systems GmbH - Key offerings
SWOT

15.14 SEGGER Microcontroller GmbH

SEGGER Microcontroller GmbH - Overview
SEGGER Microcontroller GmbH - Product / Service
SEGGER Microcontroller GmbH - Key offerings
SWOT

15.15 SYSGO GmbH

SYSGO GmbH - Overview
SYSGO GmbH - Product / Service
SYSGO GmbH - Key offerings
SWOT

15.16 Texas Instruments Inc.

Texas Instruments Inc. - Overview
Texas Instruments Inc. - Business segments
Texas Instruments Inc. - Key news
Texas Instruments Inc. - Key offerings
Texas Instruments Inc. - Segment focus
SWOT

15.17 Vector Informatik GmbH

Vector Informatik GmbH - Overview
Vector Informatik GmbH - Product / Service
Vector Informatik GmbH - Key offerings
SWOT

15.18 Wind River Systems Inc.

Wind River Systems Inc. - Overview
Wind River Systems Inc. - Product / Service
Wind River Systems Inc. - Key offerings
SWOT

16. Appendix

16.1 Scope of the report

Market definition
Objectives
Notes and caveats

16.2 Inclusions and exclusions checklist

Inclusions checklist
Exclusions checklist

16.3 Currency conversion rates for US$

16.4 Research methodology

16.5 Data procurement

Information sources

16.6 Data validation

16.7 Validation techniques employed for market sizing

16.8 Data synthesis

16.9 360 degree market analysis

16.10 List of abbreviations

Research Methodology

Technavio presents a detailed picture of the market by way of study, synthesis, and summation of data from multiple sources. The analysts have presented the various facets of the market with a particular focus on identifying the key industry influencers. The data thus presented is comprehensive, reliable, and the result of extensive research, both primary and secondary.

INFORMATION SOURCES

Primary sources

  • Manufacturers and suppliers
  • Channel partners
  • Industry experts
  • Strategic decision makers

Secondary sources

  • Industry journals and periodicals
  • Government data
  • Financial reports of key industry players
  • Historical data
  • Press releases

DATA ANALYSIS

Data Synthesis

  • Collation of data
  • Estimation of key figures
  • Analysis of derived insights

Data Validation

  • Triangulation with data models
  • Reference against proprietary databases
  • Corroboration with industry experts

REPORT WRITING

Qualitative

  • Market drivers
  • Market challenges
  • Market trends
  • Five forces analysis

Quantitative

  • Market size and forecast
  • Market segmentation
  • Geographical insights
  • Competitive landscape

Interested in this report?

Get your sample now to see our research methodology and insights!

Download Now

Frequently Asked Questions

Real-Time Operating System market growth will increase by USD 3525.9 million during 2026-2030.

The Real-Time Operating System market is expected to grow at a CAGR of 9.1% during 2026-2030.

Real-Time Operating System market is segmented by End-user (Automotive, Consumer electronics, Healthcare, Telecom, Others) Type (Soft real-time operating system, Hard real-time operating system, Firm real-time operating system) Deployment (On premise, Cloud based, Others)

Concurrent Real Time Inc., DDC I Inc., Elektrobit Automotive GmbH, eSOL Co. Ltd., ETAS GmbH, Green Hills Software LLC, High Integrity Systems Ltd., IntervalZero Inc., Lynx Software Technologies, NXP Semiconductors NV, OpenSynergy GmbH, PX5 RTOS, QNX Software Systems Ltd., Sciopta Systems GmbH, SEGGER Microcontroller GmbH, SYSGO GmbH, Texas Instruments Inc., Vector Informatik GmbH, Wind River Systems Inc. are a few of the key vendors in the Real-Time Operating System market.

North America will register the highest growth rate of 42.3% among the other regions. Therefore, the Real-Time Operating System market in North America is expected to garner significant business opportunities for the vendors during the forecast period.

US, Canada, Mexico, China, Japan, India, South Korea, Australia, Indonesia, Germany, UK, France, Italy, Spain, The Netherlands, Brazil, Argentina, Chile, Saudi Arabia, UAE, South Africa, Israel, Turkey

  • Expansion of autonomous vehicle compute platforms is the driving factor this market.

The Real-Time Operating System market vendors should focus on grabbing business opportunities from the End-user segment as it accounted for the largest market share in the base year.
RIA - Research AI Assistant
Ask RIA
