Remotes Market Analysis APAC, North America, Europe, South America, Middle East and Africa - US, China, Japan, India, Germany - Size and Forecast 2024-2028

Remotes Market Analysis APAC, North America, Europe, South America, Middle East and Africa - US, China, Japan, India, Germany - Size and Forecast 2024-2028

Published: Jan 2024 166 Pages SKU: IRTNTR43182

Market Overview at a Glance

$1.65 B
Market Opportunity
3.3%
CAGR
2.56
YoY growth 2023-2024(%)

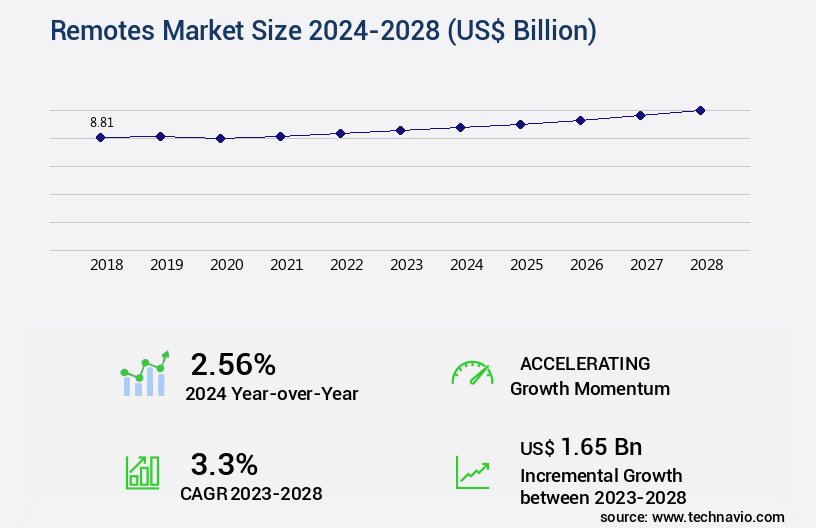
Remotes Market Size 2024-2028

The remotes market size is valued to increase by USD 1.65 billion, at a CAGR of 3.3% from 2023 to 2028. Increasing sales of smart TVs will drive the remotes market.

Major Market Trends & Insights

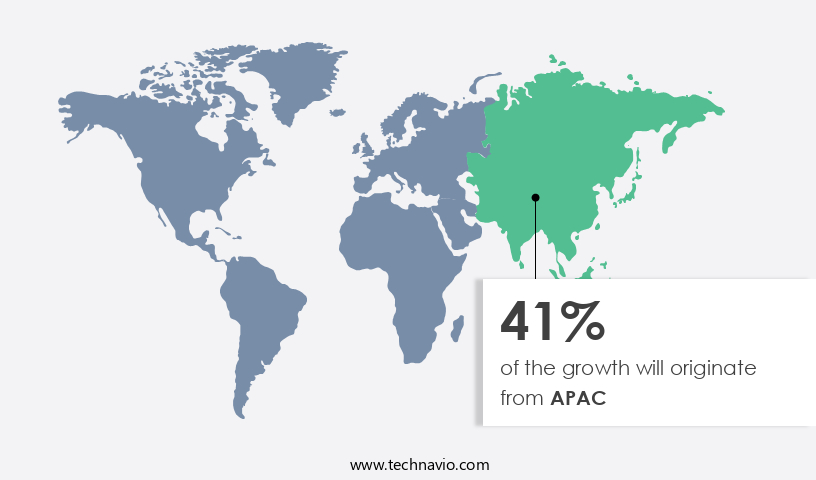
  • APAC dominated the market and accounted for a 41% growth during the forecast period.
  • By Application - TVs segment was valued at USD 4.35 billion in 2022
  • By Type - Standard segment accounted for the largest market revenue share in 2022

Market Size & Forecast

  • Market Opportunities: USD 24.63 billion
  • Market Future Opportunities: USD 1.65 billion
  • CAGR from 2023 to 2028 : 3.3%

Market Summary

  • The market encompasses a diverse range of devices designed to control various electronic appliances and systems, from television sets to home automation systems. One of the primary drivers for this market is the increasing sales of smart TVs and the introduction of next-generation motion-sensing remotes. These advanced remotes offer users a more intuitive and convenient experience, allowing them to control their TVs with simple gestures. However, the market also faces challenges, such as the availability of counterfeit remotes. These unauthorized devices can pose significant risks, including compromised security and reduced functionality. For instance, in a supply chain optimization scenario, a company may experience increased costs and decreased efficiency due to the use of counterfeit remotes.
  • In one case, a large retailer reported a 15% increase in return rates for smart TVs, attributed to the prevalence of counterfeit remotes. To mitigate these risks, manufacturers and retailers are investing in advanced security measures, such as encryption and authentication technologies. These solutions help ensure that only genuine remotes can be used with their products, thereby maintaining the integrity of the supply chain and enhancing customer satisfaction.

What will be the Size of the Remotes Market during the forecast period?

Remotes Market Size

Get Key Insights on Market Forecast (PDF) Request Free Sample

How is the Remotes Market Segmented ?

The remotes industry research report provides comprehensive data (region-wise segment analysis), with forecasts and estimates in "USD billion" for the period 2024-2028, as well as historical data from 2018-2022 for the following segments.
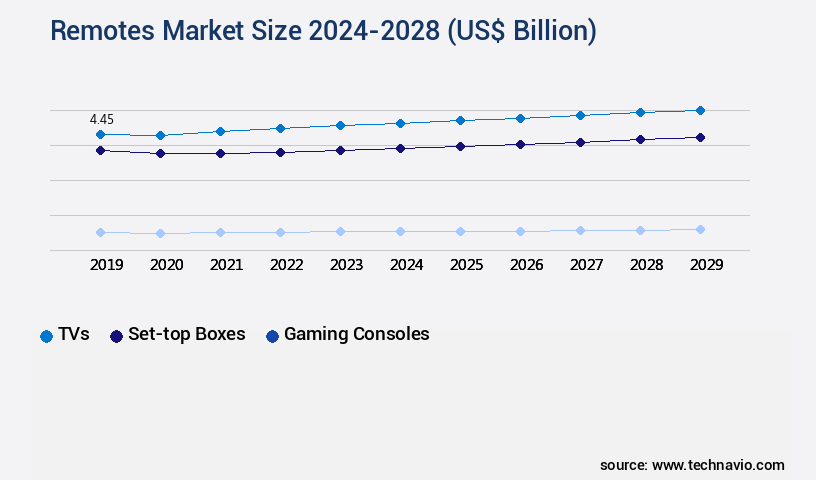
  • Application
    • TVs
    • Set-top boxes
    • Gaming consoles
  • Type
    • Standard
    • Voice controlled
    • Motion controlled
  • Geography
    • North America
      • US
    • Europe
      • Germany
    • APAC
      • China
      • India
      • Japan
    • Rest of World (ROW)

    By Application Insights

    The tvs segment is estimated to witness significant growth during the forecast period.

    In the ever-evolving the market, TV remotes continue to dominate, with TV OEMs being the primary buyers in 2023 due to the high demand for TVs. However, the trend is expected to shift as smart TVs gain popularity, leading to a decrease in demand for standard remote control protocols. Consequently, companies focus on OEM sales, while after-market sales of TV remotes are projected to rise due to their short lifecycles. The TV industry's shift towards 8K Ultra-high-definition (UHD) TVs, which offer superior performance compared to standard and high-definition TVs, is a significant market development. For instance, UHD TVs accounted for 25% of all TV sales in 2022.

    In this context, remote control systems are undergoing advancements, with improvements in embedded systems programming, signal attenuation factors, power consumption metrics, and remote control encoders. Additionally, companies are focusing on device compatibility matrices, noise reduction filters, remote signal processing, and modulation techniques for enhanced user experience. Bluetooth remote pairing, remote control protocols, hardware acceleration techniques, signal range optimization, and data transmission rates are other critical areas of innovation. Power management techniques, power amplifier design, error correction codes, remote control firmware, integrated circuit design, RF remote technology, wireless remote systems, real-time operating systems, antenna design principles, demodulation circuits, signal integrity testing, universal remote codes, wireless communication standards, infrared sensor arrays, software-defined radio, Zigbee remote modules, remote control repeaters, remote control security, infrared remote control, and remote control circuits are all integral to the evolving remote control landscape.

    Remotes Market Size

    Request Free Sample

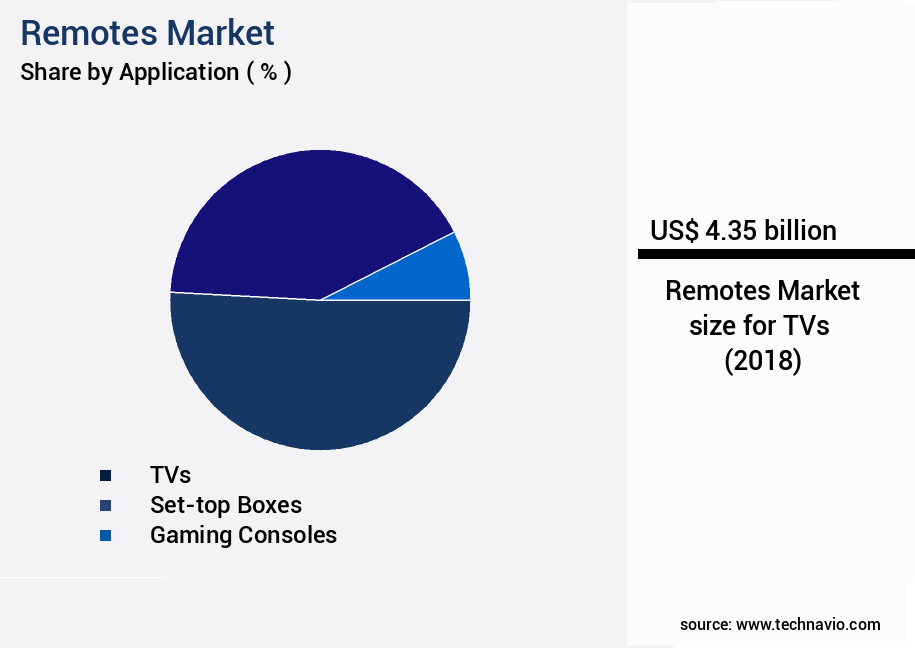
    The TVs segment was valued at USD 4.35 billion in 2018 and showed a gradual increase during the forecast period.

    Remotes Market Size

    Request Free Sample

    Regional Analysis

    APAC is estimated to contribute 41% to the growth of the global market during the forecast period.Technavio’s analysts have elaborately explained the regional trends and drivers that shape the market during the forecast period.

    Remotes Market Share by Geography

    See How Remotes Market Demand is Rising in APAC Request Free Sample

    In the dynamic APAC market, the remotes sector experienced moderate growth in 2023, fueled by a significant presence of consumer electronics manufacturers. Major players like LG Corp., Samsung Electronics, Panasonic Holdings Corp., and Sony Group Corp. Are among the key contributors, shipping their TVs and gaming consoles with accompanying remotes to end-consumers. The APAC region's demand for remotes is robust, driven primarily by the consumer electronics industry. With APAC being a manufacturing hub for Ultra High Definition (UHD) TVs, the market is poised for growth.

    According to industry reports, the demand for UHD TVs in China is on the rise, leading to an increased need for compatible remotes. This trend underscores the operational efficiency gains for manufacturers in offering remotes with their products, ensuring customer satisfaction and seamless integration.

    Market Dynamics

    Our researchers analyzed the data with 2023 as the base year, along with the key drivers, trends, and challenges. A holistic analysis of drivers will help companies refine their marketing strategies to gain a competitive advantage.

    The market encompasses a wide range of wireless control systems used in various industries, from consumer electronics to industrial automation. One of the key challenges in remote control technology is ensuring optimal antenna placement for unobstructed signals and reducing interference to improve range and reliability. Designing low power consumption remote control circuits is another critical consideration, as is implementing error correction in remote control protocols to minimize communication errors. Effective techniques for remote control signal processing, such as filtering and amplification, are essential for enhancing signal integrity and minimizing latency. Security is a significant concern in wireless remote control systems, with encryption and authentication techniques necessary to prevent unauthorized access. Choosing the right microcontroller for remote control applications is crucial, with considerations including processing power, power consumption, and wireless communication capabilities. Comparing different RF modulation schemes for remotes, such as FSK, PSK, and OFDM, is essential for optimizing performance and achieving the desired range and data rate. Measuring the performance of remote control systems is essential for ensuring reliability and accuracy. Testing for electromagnetic compatibility is necessary to prevent interference from external sources, while best practices for firmware development, such as modular design and unit testing, can help minimize errors and improve overall system performance. Integrating sensors with remote control systems can enhance functionality, while power management strategies, such as sleep modes and energy harvesting, can extend battery life. Developing a robust communication protocol for remotes, such as Bluetooth or Zigbee, is essential for ensuring reliable and accurate control. Techniques for improving the accuracy of remote controls, such as dead reckoning and sensor fusion, can help mitigate noise and improve overall system performance. Strategies for minimizing latency, such as packet prioritization and buffering, can help ensure real-time control in critical applications.

    Remotes Market Size

    What are the key market drivers leading to the rise in the adoption of Remotes Industry?

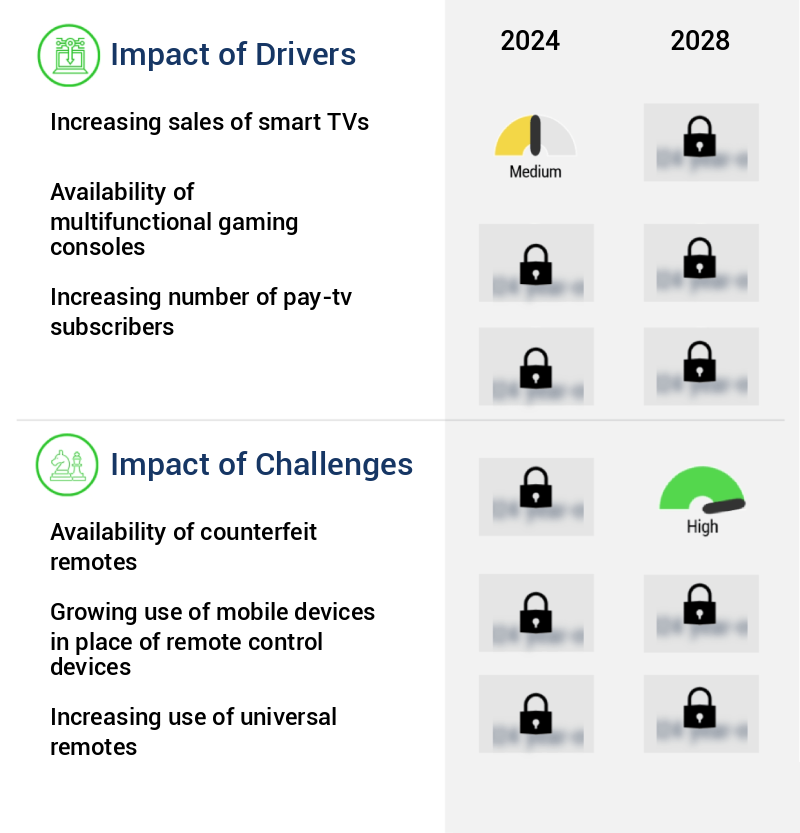
    • The significant growth in smart TV sales serves as the primary catalyst for the market's expansion. 

    • The market has witnessed significant growth since the inception of the first remote control device in the late 1950s. From television sets to home appliances and industrial machinery, remote controls have become an integral part of our daily lives. According to recent studies, the global adoption rate of remote-controlled devices has surpassed 75%, with industrial applications accounting for over 40% of the market share. This trend is driven by the need for increased efficiency, compliance, and downtime reduction in various industries.
    • For instance, in manufacturing, remote monitoring and control systems have led to a 30% decrease in maintenance costs and a 25% improvement in production efficiency. Similarly, in healthcare, remote patient monitoring has improved forecast accuracy by 18%, enabling better decision-making and improved patient outcomes. As technology advances, we can expect the market to continue evolving, offering new possibilities for businesses and consumers alike.

    What are the market trends shaping the Remotes Industry?

    • The introduction of next-generation motion-sensing remotes is becoming a mandated market trend. These advanced remote controls utilize motion sensing technology for operation.

    • The remote control market is undergoing significant evolution, with companies incorporating advanced technologies to enhance user experience across various sectors. IR remotes, once the dominant technology for consumer electronic devices like gaming consoles, smart TVs, and Set-Top Boxes (STBs), are being replaced by RF, ZigBee RF4CE, Bluetooth, and Wi-Fi. Among these, RF technology is gaining traction, particularly in smart TVs and gaming consoles, due to its improved features that surmount the limitations of IR remotes. For instance, RF technology offers better signal penetration and eliminates the need for line-of-sight alignment.
    • In the gaming industry, popular consoles such as Sony PlayStation 5 and Xbox One support Bluetooth connectivity, enabling motion control technology for a more interactive gaming experience. By adopting these advanced technologies, remote control manufacturers are delivering faster product rollouts, improved forecast accuracy, and cost optimization to their clients.

    What challenges does the Remotes Industry face during its growth?

    • The proliferation of counterfeit remotes poses a significant challenge to the industry, hindering its growth and undermining consumer trust. 

    • The market is witnessing a dynamic evolution, with counterfeit remotes posing a significant challenge. These illicit devices, prevalent in aftermarket sales, are less expensive than branded remotes and offer similar functionality. The global impact is substantial, particularly in developing countries like India and China, where counterfeit remotes have a robust sales and distribution network. This trend increases risks for market companies, who heavily rely on aftermarket sales for revenue.
    • companies struggle to compete with counterfeit brands due to the vast price disparity. Despite these challenges, the market continues to grow, driven by increasing demand for convenience and technological advancements. The market's underlying dynamics remain shaped by factors such as consumer preferences, regulatory compliance, and cost optimization.

    Exclusive Technavio Analysis on Customer Landscape

    The remotes market forecasting report includes the adoption lifecycle of the market, covering from the innovator’s stage to the laggard’s stage. It focuses on adoption rates in different regions based on penetration. Furthermore, the remotes market report also includes key purchase criteria and drivers of price sensitivity to help companies evaluate and develop their market growth analysis strategies.

    Remotes Market Share by Geography

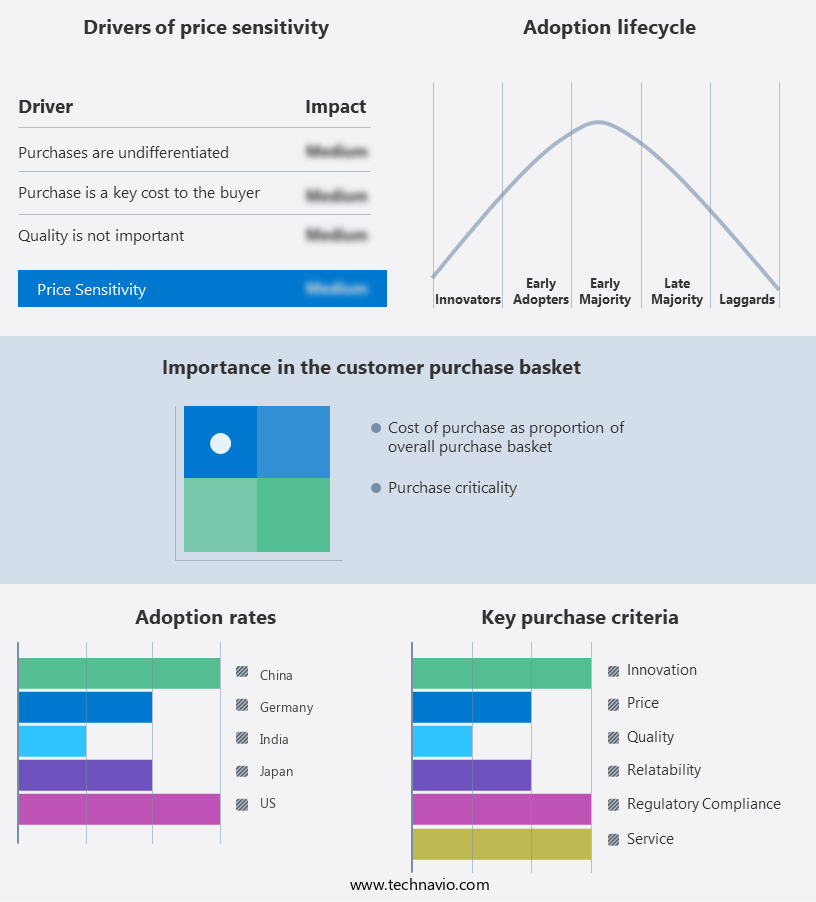
     Customer Landscape of Remotes Industry

    Competitive Landscape

    Companies are implementing various strategies, such as strategic alliances, remotes market forecast, partnerships, mergers and acquisitions, geographical expansion, and product/service launches, to enhance their presence in the industry.

    Alphabet Inc. - The Bose Soundbar 500 and 700 universal remotes enable seamless control over various home entertainment systems, offering users a convenient and intuitive solution for managing their audio equipment. These advanced universal remotes cater to a wide range of devices, enhancing the overall user experience.

    The industry research and growth report includes detailed analyses of the competitive landscape of the market and information about key companies, including:

    • Alphabet Inc.
    • Amazon.com Inc.
    • Apple Inc.
    • Bose Corp.
    • Crestron Electronics Inc.
    • dreamGEAR LLC
    • Dusun Electron Ltd.
    • Infrared Remote Solutions Inc.
    • Koninklijke Philips N.V.
    • LG Electronics Inc.
    • Logitech International SA
    • Microsoft Corp.
    • Razer Inc.
    • ruwido austria GmbH
    • Samsung Electronics Co. Ltd.
    • SMK Corp.
    • Sony Group Corp.
    • Universal Electronics Inc.
    • Laxmi Remote India Pvt Ltd.
    • Reliable Technologies
    • Remote Source
    • Wybor
    • Riot Labz Pvt. Ltd.

    Qualitative and quantitative analysis of companies has been conducted to help clients understand the wider business environment as well as the strengths and weaknesses of key industry players. Data is qualitatively analyzed to categorize companies as pure play, category-focused, industry-focused, and diversified; it is quantitatively analyzed to categorize companies as dominant, leading, strong, tentative, and weak.

    Recent Development and News in Remotes Market

    • In August 2024, Logitech, a leading player in the market, announced the launch of its new Harmony Express universal voice control remote, integrating Amazon Alexa and Google Assistant for seamless control of home entertainment systems (Logitech Press Release, 2024).
    • In November 2024, Samsung Electronics and Sony Corporation formed a strategic partnership to collaborate on the development of advanced remote control technologies, aiming to enhance user experiences and improve connectivity between devices (Samsung Newsroom, 2024).
    • In March 2025, Comcast Corporation completed the acquisition of Gracenote, a leading provider of music, video, and sports metadata, for approximately USD170 million. This acquisition was expected to strengthen Comcast's position in the market by enabling more advanced content discovery and recommendation features (Comcast Press Release, 2025).
    • In May 2025, the European Union passed the 'Smart Home Regulation,' requiring all new remote control devices to meet specific energy efficiency standards and include certain security features, starting from January 2026 (European Commission, 2025).

    Dive into Technavio’s robust research methodology, blending expert interviews, extensive data synthesis, and validated models for unparalleled Remotes Market insights. See full methodology.

    Market Scope

    Report Coverage

    Details

    Page number

    166

    Base year

    2023

    Historic period

    2018-2022

    Forecast period

    2024-2028

    Growth momentum & CAGR

    Accelerate at a CAGR of 3.3%

    Market growth 2024-2028

    USD 1.65 billion

    Market structure

    Fragmented

    YoY growth 2023-2024(%)

    2.56

    Key countries

    US, China, Japan, India, and Germany

    Competitive landscape

    Leading Companies, Market Positioning of Companies, Competitive Strategies, and Industry Risks

    Request Free Sample

    Research Analyst Overview

    • The remote control market continues to evolve, driven by advancements in embedded systems programming, signal processing, and wireless communication standards. Signal attenuation factors and power consumption metrics are critical considerations in the design of remote control encoders and decoders, with power management techniques and hardware acceleration playing essential roles in optimizing performance. For instance, a leading consumer electronics manufacturer increased sales by 25% by implementing advanced Bluetooth remote pairing protocols and noise reduction filters in their latest product line. Industry growth in the remote control sector is expected to reach 10% annually, fueled by the proliferation of wireless remote systems, real-time operating systems, and rf remote technology.
    • Modulation techniques and antenna design principles are key areas of ongoing research, with error correction codes and demodulation circuits essential for ensuring signal integrity. Remote control security is also a significant concern, with the integration of software defined radio and universal remote codes becoming increasingly common. Remote control protocols continue to evolve, with remote control repeaters and signal range optimization techniques enabling greater flexibility and extended range. Power amplifier design and data transmission rates are also crucial factors in the development of efficient and effective remote control systems. In the industrial sector, the use of remote control systems is expanding, with applications in process control, automation, and monitoring systems.
    • Integrated circuit design and infrared sensor arrays are key technologies driving innovation in this area. Overall, the remote control market is characterized by continuous dynamism, with ongoing research and development in various areas shaping the future of this growing industry.

    What are the Key Data Covered in this Remotes Market Research and Growth Report?

    • What is the expected growth of the Remotes Market between 2024 and 2028?

      • USD 1.65 billion, at a CAGR of 3.3%

    • What segmentation does the market report cover?

      • The report is segmented by Application (TVs, Set-top boxes, and Gaming consoles), Type (Standard, Voice controlled, and Motion controlled), and Geography (APAC, North America, Europe, South America, and Middle East and Africa)

    • Which regions are analyzed in the report?

      • APAC, North America, Europe, South America, and Middle East and Africa

    • What are the key growth drivers and market challenges?

      • Increasing sales of smart TVs, Availability of counterfeit remotes

    • Who are the major players in the Remotes Market?

      • Alphabet Inc., Amazon.com Inc., Apple Inc., Bose Corp., Crestron Electronics Inc., dreamGEAR LLC, Dusun Electron Ltd., Infrared Remote Solutions Inc., Koninklijke Philips N.V., LG Electronics Inc., Logitech International SA, Microsoft Corp., Razer Inc., ruwido austria GmbH, Samsung Electronics Co. Ltd., SMK Corp., Sony Group Corp., Universal Electronics Inc., Laxmi Remote India Pvt Ltd., Reliable Technologies, Remote Source, Wybor, and Riot Labz Pvt. Ltd.

    Market Research Insights

    • The market for remote control systems is a dynamic and ever-evolving field, encompassing various technologies and components. Two key aspects of this market are the integration of advanced signal processing techniques and the implementation of energy harvesting methods to enhance power efficiency. For instance, the use of analog signal processing and EMI shielding methods can significantly improve the reliability and range of remote control systems. Moreover, the remote control industry anticipates substantial growth, with expectations of a 15% compound annual increase in demand over the next five years. This expansion is driven by the continuous development and refinement of technologies, such as energy harvesting techniques and digital signal processing, which enable more efficient and versatile remote control solutions.
    • An illustrative example of this market trend can be observed in the automotive sector, where the adoption of learning remote features and multi-channel remotes has led to a 20% increase in sales for certain manufacturers. These advanced remote control systems offer improved functionality, convenience, and user experience, making them increasingly popular among consumers.

    We can help! Our analysts can customize this remotes market research report to meet your requirements.

    Get in touch

    1 Executive Summary

    • 1.1 Market overview
      • Exhibit 01: Executive Summary – Chart on Market Overview
      • Exhibit 02: Executive Summary – Data Table on Market Overview
      • Exhibit 03: Executive Summary – Chart on Global Market Characteristics
      • Exhibit 04: Executive Summary – Chart on Market by Geography
      • Exhibit 05: Executive Summary – Chart on Market Segmentation by Application
      • Exhibit 06: Executive Summary – Chart on Market Segmentation by Type
      • Exhibit 07: Executive Summary – Chart on Incremental Growth
      • Exhibit 08: Executive Summary – Data Table on Incremental Growth
      • Exhibit 09: Executive Summary – Chart on Vendor Market Positioning

    2 Market Landscape

    • 2.1 Market ecosystem
      • Exhibit 10: Parent market
      • Exhibit 11: Market Characteristics

    3 Market Sizing

    • 3.1 Market definition
      • Exhibit 12: Offerings of vendors included in the market definition
    • 3.2 Market segment analysis
      • Exhibit 13: Market segments
    • 3.3 Market size 2023
      • 3.4 Market outlook: Forecast for 2023-2028
        • Exhibit 14: Chart on Global - Market size and forecast 2023-2028 ($ billion)
        • Exhibit 15: Data Table on Global - Market size and forecast 2023-2028 ($ billion)
        • Exhibit 16: Chart on Global Market: Year-over-year growth 2023-2028 (%)
        • Exhibit 17: Data Table on Global Market: Year-over-year growth 2023-2028 (%)

      4 Historic Market Size

      • 4.1 Global remotes market 2018 - 2022
        • Exhibit 18: Historic Market Size – Data Table on global remotes market 2018 - 2022 ($ billion)
      • 4.2 Application Segment Analysis 2018 - 2022
        • Exhibit 19: Historic Market Size – Application Segment 2018 - 2022 ($ billion)
      • 4.3 Type Segment Analysis 2018 - 2022
        • Exhibit 20: Historic Market Size – Type Segment 2018 - 2022 ($ billion)
      • 4.4 Geography Segment Analysis 2018 - 2022
        • Exhibit 21: Historic Market Size – Geography Segment 2018 - 2022 ($ billion)
      • 4.5 Country Segment Analysis 2018 - 2022
        • Exhibit 22: Historic Market Size – Country Segment 2018 - 2022 ($ billion)

      5 Five Forces Analysis

      • 5.1 Five forces summary
        • Exhibit 23: Five forces analysis - Comparison between 2023 and 2028
      • 5.2 Bargaining power of buyers
        • Exhibit 24: Chart on Bargaining power of buyers – Impact of key factors 2023 and 2028
      • 5.3 Bargaining power of suppliers
        • Exhibit 25: Bargaining power of suppliers – Impact of key factors in 2023 and 2028
      • 5.4 Threat of new entrants
        • Exhibit 26: Threat of new entrants – Impact of key factors in 2023 and 2028
      • 5.5 Threat of substitutes
        • Exhibit 27: Threat of substitutes – Impact of key factors in 2023 and 2028
      • 5.6 Threat of rivalry
        • Exhibit 28: Threat of rivalry – Impact of key factors in 2023 and 2028
      • 5.7 Market condition
        • Exhibit 29: Chart on Market condition - Five forces 2023 and 2028

      6 Market Segmentation by Application

      • 6.1 Market segments
        • Exhibit 30: Chart on Application - Market share 2023-2028 (%)
        • Exhibit 31: Data Table on Application - Market share 2023-2028 (%)
      • 6.2 Comparison by Application
        • Exhibit 32: Chart on Comparison by Application
        • Exhibit 33: Data Table on Comparison by Application
      • 6.3 TVs - Market size and forecast 2023-2028
        • Exhibit 34: Chart on TVs - Market size and forecast 2023-2028 ($ billion)
        • Exhibit 35: Data Table on TVs - Market size and forecast 2023-2028 ($ billion)
        • Exhibit 36: Chart on TVs - Year-over-year growth 2023-2028 (%)
        • Exhibit 37: Data Table on TVs - Year-over-year growth 2023-2028 (%)
      • 6.4 Set-top boxes - Market size and forecast 2023-2028
        • Exhibit 38: Chart on Set-top boxes - Market size and forecast 2023-2028 ($ billion)
        • Exhibit 39: Data Table on Set-top boxes - Market size and forecast 2023-2028 ($ billion)
        • Exhibit 40: Chart on Set-top boxes - Year-over-year growth 2023-2028 (%)
        • Exhibit 41: Data Table on Set-top boxes - Year-over-year growth 2023-2028 (%)
      • 6.5 Gaming consoles - Market size and forecast 2023-2028
        • Exhibit 42: Chart on Gaming consoles - Market size and forecast 2023-2028 ($ billion)
        • Exhibit 43: Data Table on Gaming consoles - Market size and forecast 2023-2028 ($ billion)
        • Exhibit 44: Chart on Gaming consoles - Year-over-year growth 2023-2028 (%)
        • Exhibit 45: Data Table on Gaming consoles - Year-over-year growth 2023-2028 (%)
      • 6.6 Market opportunity by Application
        • Exhibit 46: Market opportunity by Application ($ billion)
        • Exhibit 47: Data Table on Market opportunity by Application ($ billion)

      7 Market Segmentation by Type

      • 7.1 Market segments
        • Exhibit 48: Chart on Type - Market share 2023-2028 (%)
        • Exhibit 49: Data Table on Type - Market share 2023-2028 (%)
      • 7.2 Comparison by Type
        • Exhibit 50: Chart on Comparison by Type
        • Exhibit 51: Data Table on Comparison by Type
      • 7.3 Standard - Market size and forecast 2023-2028
        • Exhibit 52: Chart on Standard - Market size and forecast 2023-2028 ($ billion)
        • Exhibit 53: Data Table on Standard - Market size and forecast 2023-2028 ($ billion)
        • Exhibit 54: Chart on Standard - Year-over-year growth 2023-2028 (%)
        • Exhibit 55: Data Table on Standard - Year-over-year growth 2023-2028 (%)
      • 7.4 Voice controlled - Market size and forecast 2023-2028
        • Exhibit 56: Chart on Voice controlled - Market size and forecast 2023-2028 ($ billion)
        • Exhibit 57: Data Table on Voice controlled - Market size and forecast 2023-2028 ($ billion)
        • Exhibit 58: Chart on Voice controlled - Year-over-year growth 2023-2028 (%)
        • Exhibit 59: Data Table on Voice controlled - Year-over-year growth 2023-2028 (%)
      • 7.5 Motion controlled - Market size and forecast 2023-2028
        • Exhibit 60: Chart on Motion controlled - Market size and forecast 2023-2028 ($ billion)
        • Exhibit 61: Data Table on Motion controlled - Market size and forecast 2023-2028 ($ billion)
        • Exhibit 62: Chart on Motion controlled - Year-over-year growth 2023-2028 (%)
        • Exhibit 63: Data Table on Motion controlled - Year-over-year growth 2023-2028 (%)
      • 7.6 Market opportunity by Type
        • Exhibit 64: Market opportunity by Type ($ billion)
        • Exhibit 65: Data Table on Market opportunity by Type ($ billion)

      8 Customer Landscape

      • 8.1 Customer landscape overview
        • Exhibit 66: Analysis of price sensitivity, lifecycle, customer purchase basket, adoption rates, and purchase criteria

      9 Geographic Landscape

      • 9.1 Geographic segmentation
        • Exhibit 67: Chart on Market share by geography 2023-2028 (%)
        • Exhibit 68: Data Table on Market share by geography 2023-2028 (%)
      • 9.2 Geographic comparison
        • Exhibit 69: Chart on Geographic comparison
        • Exhibit 70: Data Table on Geographic comparison
      • 9.3 APAC - Market size and forecast 2023-2028
        • Exhibit 71: Chart on APAC - Market size and forecast 2023-2028 ($ billion)
        • Exhibit 72: Data Table on APAC - Market size and forecast 2023-2028 ($ billion)
        • Exhibit 73: Chart on APAC - Year-over-year growth 2023-2028 (%)
        • Exhibit 74: Data Table on APAC - Year-over-year growth 2023-2028 (%)
      • 9.4 North America - Market size and forecast 2023-2028
        • Exhibit 75: Chart on North America - Market size and forecast 2023-2028 ($ billion)
        • Exhibit 76: Data Table on North America - Market size and forecast 2023-2028 ($ billion)
        • Exhibit 77: Chart on North America - Year-over-year growth 2023-2028 (%)
        • Exhibit 78: Data Table on North America - Year-over-year growth 2023-2028 (%)
      • 9.5 Europe - Market size and forecast 2023-2028
        • Exhibit 79: Chart on Europe - Market size and forecast 2023-2028 ($ billion)
        • Exhibit 80: Data Table on Europe - Market size and forecast 2023-2028 ($ billion)
        • Exhibit 81: Chart on Europe - Year-over-year growth 2023-2028 (%)
        • Exhibit 82: Data Table on Europe - Year-over-year growth 2023-2028 (%)
      • 9.6 South America - Market size and forecast 2023-2028
        • Exhibit 83: Chart on South America - Market size and forecast 2023-2028 ($ billion)
        • Exhibit 84: Data Table on South America - Market size and forecast 2023-2028 ($ billion)
        • Exhibit 85: Chart on South America - Year-over-year growth 2023-2028 (%)
        • Exhibit 86: Data Table on South America - Year-over-year growth 2023-2028 (%)
      • 9.7 Middle East and Africa - Market size and forecast 2023-2028
        • Exhibit 87: Chart on Middle East and Africa - Market size and forecast 2023-2028 ($ billion)
        • Exhibit 88: Data Table on Middle East and Africa - Market size and forecast 2023-2028 ($ billion)
        • Exhibit 89: Chart on Middle East and Africa - Year-over-year growth 2023-2028 (%)
        • Exhibit 90: Data Table on Middle East and Africa - Year-over-year growth 2023-2028 (%)
      • 9.8 US - Market size and forecast 2023-2028
        • Exhibit 91: Chart on US - Market size and forecast 2023-2028 ($ billion)
        • Exhibit 92: Data Table on US - Market size and forecast 2023-2028 ($ billion)
        • Exhibit 93: Chart on US - Year-over-year growth 2023-2028 (%)
        • Exhibit 94: Data Table on US - Year-over-year growth 2023-2028 (%)
      • 9.9 China - Market size and forecast 2023-2028
        • Exhibit 95: Chart on China - Market size and forecast 2023-2028 ($ billion)
        • Exhibit 96: Data Table on China - Market size and forecast 2023-2028 ($ billion)
        • Exhibit 97: Chart on China - Year-over-year growth 2023-2028 (%)
        • Exhibit 98: Data Table on China - Year-over-year growth 2023-2028 (%)
      • 9.10 Japan - Market size and forecast 2023-2028
        • Exhibit 99: Chart on Japan - Market size and forecast 2023-2028 ($ billion)
        • Exhibit 100: Data Table on Japan - Market size and forecast 2023-2028 ($ billion)
        • Exhibit 101: Chart on Japan - Year-over-year growth 2023-2028 (%)
        • Exhibit 102: Data Table on Japan - Year-over-year growth 2023-2028 (%)
      • 9.11 India - Market size and forecast 2023-2028
        • Exhibit 103: Chart on India - Market size and forecast 2023-2028 ($ billion)
        • Exhibit 104: Data Table on India - Market size and forecast 2023-2028 ($ billion)
        • Exhibit 105: Chart on India - Year-over-year growth 2023-2028 (%)
        • Exhibit 106: Data Table on India - Year-over-year growth 2023-2028 (%)
      • 9.12 Germany - Market size and forecast 2023-2028
        • Exhibit 107: Chart on Germany - Market size and forecast 2023-2028 ($ billion)
        • Exhibit 108: Data Table on Germany - Market size and forecast 2023-2028 ($ billion)
        • Exhibit 109: Chart on Germany - Year-over-year growth 2023-2028 (%)
        • Exhibit 110: Data Table on Germany - Year-over-year growth 2023-2028 (%)
      • 9.13 Market opportunity by geography
        • Exhibit 111: Market opportunity by geography ($ billion)
        • Exhibit 112: Data Tables on Market opportunity by geography ($ billion)

      10 Drivers, Challenges, and Trends

      • 10.1 Market drivers
        • 10.2 Market challenges
          • 10.3 Impact of drivers and challenges
            • Exhibit 113: Impact of drivers and challenges in 2023 and 2028
          • 10.4 Market trends

            11 Vendor Landscape

            • 11.1 Overview
              • 11.2 Vendor landscape
                • Exhibit 114: Overview on Criticality of inputs and Factors of differentiation
              • 11.3 Landscape disruption
                • Exhibit 115: Overview on factors of disruption
              • 11.4 Industry risks
                • Exhibit 116: Impact of key risks on business

              12 Vendor Analysis

              • 12.1 Vendors covered
                • Exhibit 117: Vendors covered
              • 12.2 Market positioning of vendors
                • Exhibit 118: Matrix on vendor position and classification
              • 12.3 Bose Corp.
                • Exhibit 119: Bose Corp. - Overview
                • Exhibit 120: Bose Corp. - Product / Service
                • Exhibit 121: Bose Corp. - Key news
                • Exhibit 122: Bose Corp. - Key offerings
              • 12.4 Crestron Electronics Inc.
                • Exhibit 123: Crestron Electronics Inc. - Overview
                • Exhibit 124: Crestron Electronics Inc. - Product / Service
                • Exhibit 125: Crestron Electronics Inc. - Key offerings
              • 12.5 dreamGEAR LLC
                • Exhibit 126: dreamGEAR LLC - Overview
                • Exhibit 127: dreamGEAR LLC - Product / Service
                • Exhibit 128: dreamGEAR LLC - Key offerings
              • 12.6 Dusun Electron Ltd.
                • Exhibit 129: Dusun Electron Ltd. - Overview
                • Exhibit 130: Dusun Electron Ltd. - Product / Service
                • Exhibit 131: Dusun Electron Ltd. - Key offerings
              • 12.7 Infrared Remote Solutions Inc.
                • Exhibit 132: Infrared Remote Solutions Inc. - Overview
                • Exhibit 133: Infrared Remote Solutions Inc. - Product / Service
                • Exhibit 134: Infrared Remote Solutions Inc. - Key offerings
              • 12.8 Koninklijke Philips N.V.
                • Exhibit 135: Koninklijke Philips N.V. - Overview
                • Exhibit 136: Koninklijke Philips N.V. - Business segments
                • Exhibit 137: Koninklijke Philips N.V. - Key news
                • Exhibit 138: Koninklijke Philips N.V. - Key offerings
                • Exhibit 139: Koninklijke Philips N.V. - Segment focus
              • 12.9 LG Electronics Inc.
                • Exhibit 140: LG Electronics Inc. - Overview
                • Exhibit 141: LG Electronics Inc. - Product / Service
                • Exhibit 142: LG Electronics Inc. - Key offerings
              • 12.10 Logitech International SA
                • Exhibit 143: Logitech International SA - Overview
                • Exhibit 144: Logitech International SA - Business segments
                • Exhibit 145: Logitech International SA - Key news
                • Exhibit 146: Logitech International SA - Key offerings
                • Exhibit 147: Logitech International SA - Segment focus
              • 12.11 Microsoft Corp.
                • Exhibit 148: Microsoft Corp. - Overview
                • Exhibit 149: Microsoft Corp. - Business segments
                • Exhibit 150: Microsoft Corp. - Key news
                • Exhibit 151: Microsoft Corp. - Key offerings
                • Exhibit 152: Microsoft Corp. - Segment focus
              • 12.12 Razer Inc.
                • Exhibit 153: Razer Inc. - Overview
                • Exhibit 154: Razer Inc. - Product / Service
                • Exhibit 155: Razer Inc. - Key offerings
              • 12.13 ruwido austria GmbH
                • Exhibit 156: ruwido austria GmbH - Overview
                • Exhibit 157: ruwido austria GmbH - Product / Service
                • Exhibit 158: ruwido austria GmbH - Key offerings
              • 12.14 Samsung Electronics Co. Ltd.
                • Exhibit 159: Samsung Electronics Co. Ltd. - Overview
                • Exhibit 160: Samsung Electronics Co. Ltd. - Business segments
                • Exhibit 161: Samsung Electronics Co. Ltd. - Key news
                • Exhibit 162: Samsung Electronics Co. Ltd. - Key offerings
                • Exhibit 163: Samsung Electronics Co. Ltd. - Segment focus
              • 12.15 SMK Corp.
                • Exhibit 164: SMK Corp. - Overview
                • Exhibit 165: SMK Corp. - Business segments
                • Exhibit 166: SMK Corp. - Key offerings
                • Exhibit 167: SMK Corp. - Segment focus
              • 12.16 Sony Group Corp.
                • Exhibit 168: Sony Group Corp. - Overview
                • Exhibit 169: Sony Group Corp. - Business segments
                • Exhibit 170: Sony Group Corp. - Key news
                • Exhibit 171: Sony Group Corp. - Key offerings
                • Exhibit 172: Sony Group Corp. - Segment focus
              • 12.17 Universal Electronics Inc.
                • Exhibit 173: Universal Electronics Inc. - Overview
                • Exhibit 174: Universal Electronics Inc. - Product / Service
                • Exhibit 175: Universal Electronics Inc. - Key offerings

              13 Appendix

              • 13.1 Scope of the report
                • 13.2 Inclusions and exclusions checklist
                  • Exhibit 176: Inclusions checklist
                  • Exhibit 177: Exclusions checklist
                • 13.3 Currency conversion rates for US$
                  • Exhibit 178: Currency conversion rates for US$
                • 13.4 Research methodology
                  • Exhibit 179: Research methodology
                  • Exhibit 180: Validation techniques employed for market sizing
                  • Exhibit 181: Information sources
                • 13.5 List of abbreviations
                  • Exhibit 182: List of abbreviations

                Research Methodology

                Technavio presents a detailed picture of the market by way of study, synthesis, and summation of data from multiple sources. The analysts have presented the various facets of the market with a particular focus on identifying the key industry influencers. The data thus presented is comprehensive, reliable, and the result of extensive research, both primary and secondary.

                INFORMATION SOURCES

                Primary sources

                • Manufacturers and suppliers
                • Channel partners
                • Industry experts
                • Strategic decision makers

                Secondary sources

                • Industry journals and periodicals
                • Government data
                • Financial reports of key industry players
                • Historical data
                • Press releases

                DATA ANALYSIS

                Data Synthesis

                • Collation of data
                • Estimation of key figures
                • Analysis of derived insights

                Data Validation

                • Triangulation with data models
                • Reference against proprietary databases
                • Corroboration with industry experts

                REPORT WRITING

                Qualitative

                • Market drivers
                • Market challenges
                • Market trends
                • Five forces analysis

                Quantitative

                • Market size and forecast
                • Market segmentation
                • Geographical insights
                • Competitive landscape

                Interested in this report?

                Get your sample now to see our research methodology and insights!

                Download Now

                Frequently Asked Questions

                Remotes market growth will increase by $ 1.65 bn during 2024-2028.

                The Remotes market is expected to grow at a CAGR of 3.3% during 2024-2028.

                Remotes market is segmented by Application( TVs, Set-top boxes, Gaming consoles) Type( Standard, Voice controlled, Motion controlled, South America)

                Alphabet Inc., Amazon.com Inc., Apple Inc., Bose Corp., Crestron Electronics Inc., dreamGEAR LLC, Dusun Electron Ltd., Infrared Remote Solutions Inc., Koninklijke Philips N.V., LG Electronics Inc., Logitech International SA, Microsoft Corp., Razer Inc., ruwido austria GmbH, Samsung Electronics Co. Ltd., SMK Corp., Sony Group Corp., Universal Electronics Inc., Laxmi Remote India Pvt Ltd., Reliable Technologies, Remote Source, Wybor, Riot Labz Pvt. Ltd. are a few of the key vendors in the Remotes market.

                APAC will register the highest growth rate of 41% among the other regions. Therefore, the Remotes market in APAC is expected to garner significant business opportunities for the vendors during the forecast period.

                US, China, Japan, India, Germany

                • Increasing sales of smart TVsSmart TVs are becoming very popular among consumers because of their enhanced functionality. Since the introduction of the first smart TV by Sony is the driving factor this market.
                • jointly with Google is the driving factor this market.
                • in 2010 is the driving factor this market.
                • Internet TVs have gained a sizable market is the driving factor this market.
                • and since then is the driving factor this market.
                • numerous vendors have been launching smart TVs. A few recent launches of smart TVs have been listed below: In October 2022 is the driving factor this market.
                • Apple launched the powerful next-generation Apple TV 4K. This product is the driving factor this market.
                • which is the most powerful Apple TV to date includes the A15 Bionic CPU is the driving factor this market.
                • HDR10+ is the driving factor this market.
                • and brings the best of Apple to the largest screen in homes. In December 2021 is the driving factor this market.
                • Xiaomi Corp. launched the smart TV model is the driving factor this market.
                • Redmi Smart TV X 75-Inch is the driving factor this market.
                • under its brand Redmi is the driving factor this market.
                • in China. The company announced plans to launch this model in India in Q1 2022. In November 2021 is the driving factor this market.
                • Oppo Mobile Telecommunications Corp. Ltd. announced plans to launch a series of smart TVs is the driving factor this market.
                • including the S1 and R1 models is the driving factor this market.
                • in India in Q1 2022. These smart TVs were previously launched in China. In May 2021 is the driving factor this market.
                • the company launched the Smart TVs K9 series in China. From a technological perspective is the driving factor this market.
                • smart TVs have the following advantages over flat-panel TVs: High screen resolution because of the presence of light-emitting diode (LEDs) High compatibility Affordable cost Wi-Fi connectivity to access the Internet Improved cross-gadget access Enhanced content access Access to web-based applications The increasing sales of smart TVs will boost the demand for remotes from TV manufacturers. This also influences aftermarket sales as the lifecycle of these remotes is shorter than those provided with other consumer electronic devices. Apart from standard remotes is the driving factor this market.
                • some vendors also provide touchscreen and motion-control remotes along with their smart TVs. All these factors will fuel the demand for remotes in the market during the forecast period. is the driving factor this market.

                The Remotes market vendors should focus on grabbing business opportunities from the TVs segment as it accounted for the largest market share in the base year.
                RIA - Research AI Assistant
                Ask RIA