
China Retail Market Size 2026-2030
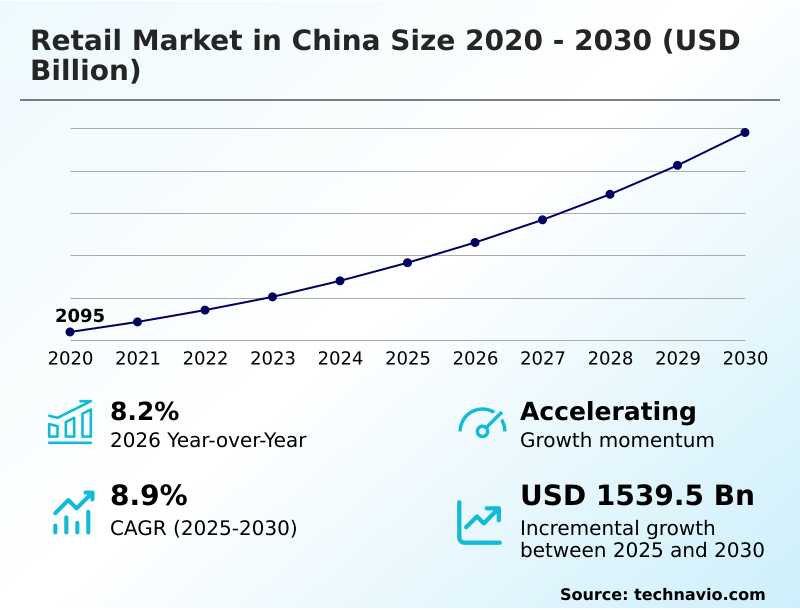
The china retail market size is valued to increase by USD 1539.5 billion, at a CAGR of 8.9% from 2025 to 2030. Expanding middle class and increasing disposable incomes as primary growth catalyst will drive the china retail market.
Major Market Trends & Insights
- By Product - Food and beverages segment was valued at USD 1121.3 billion in 2024
- By Distribution Channel - Offline segment accounted for the largest market revenue share in 2024
Market Size & Forecast
- Market Opportunities: USD 2357.6 billion
- Market Future Opportunities: USD 1539.5 billion
- CAGR from 2025 to 2030 : 8.9%
Market Summary
- The retail market in China is undergoing a profound transformation, driven by rapid digitalization and evolving consumer expectations. This dynamic environment moves beyond simple e-commerce transactions, fostering a deeply integrated commercial landscape where the lines between online and offline channels are blurred.
- Key market drivers include the expansion of the urban middle class, leading to a significant consumption upgrade where shoppers demand higher quality and greater brand value. This shift compels businesses to adopt sophisticated strategies focused on hyper-personalization and experiential retail.
- For instance, a fashion retailer might leverage a unified commerce experience, using in-store augmented reality mirrors to allow customers to try on virtual outfits, which can then be purchased online for home delivery. This phygital integration not only enhances customer engagement but also provides valuable data for inventory management and demand forecasting. However, the market is not without its challenges.
- Intense competition, navigating fragmented consumer demographics, and adapting to a dynamic regulatory framework require exceptional agility and strategic foresight from all participants. The ability to create a seamless customer journey across all touchpoints is no longer a competitive advantage but a fundamental requirement for survival and growth.
What will be the Size of the China Retail Market during the forecast period?
Get Key Insights on Market Forecast (PDF) Get Free Sample
How is the China Retail Market Segmented?
The china retail industry research report provides comprehensive data (region-wise segment analysis), with forecasts and estimates in "USD billion" for the period 2026-2030, as well as historical data from 2020-2024 for the following segments.
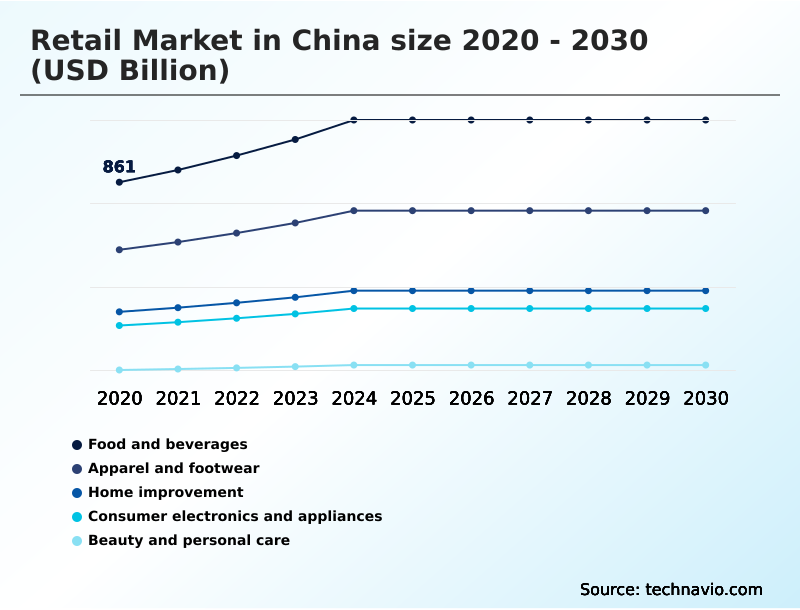
- Product
- Food and beverages
- Apparel and footwear
- Home improvement
- Consumer electronics and appliances
- Beauty and personal care
- Distribution channel
- Offline
- Online
- Pricing scheme
- Digital payment
- Buy now pay later
- Cash
- Geography
- APAC
- China
- APAC
By Product Insights
The food and beverages segment is estimated to witness significant growth during the forecast period.
The food and beverages segment is defined by a significant consumption upgrade trend, where demand shifts toward premium, healthier options. This evolution necessitates a sophisticated supply chain management approach, especially for cold chain logistics to ensure product quality.
Successful operators leverage a robust consumer data platform to inform personalized marketing and a data-driven personalization strategy.
The integration of a seamless checkout process and rapid delivery services, often managed through an omnichannel strategy and mobile application connectivity, is now standard.
Firms using in-store analytics to refine their phygital integration report a 15% improvement in inventory turnover ratio. The market's competitive nature requires strong brand storytelling and curated content feeds to engage the modern, brand-conscious consumer.
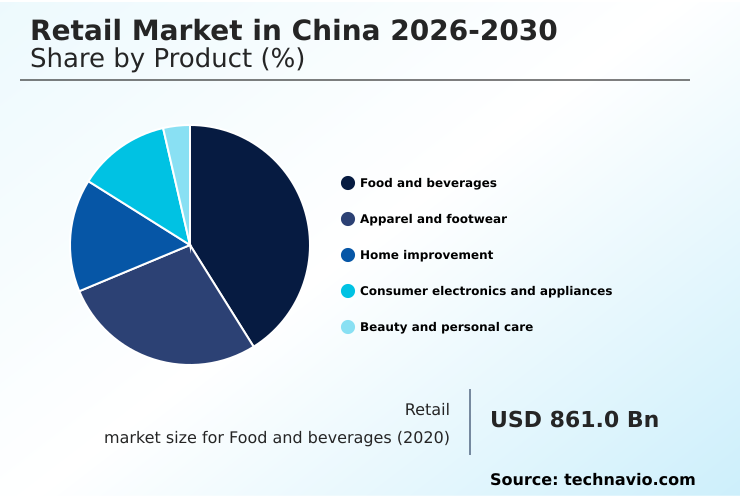
The Food and beverages segment was valued at USD 1121.3 billion in 2024 and showed a gradual increase during the forecast period.
Market Dynamics
Our researchers analyzed the data with 2025 as the base year, along with the key drivers, trends, and challenges. A holistic analysis of drivers will help companies refine their marketing strategies to gain a competitive advantage.
- Strategic execution in the retail market in china omnichannel strategy implementation is now a baseline requirement for success. The market has moved far beyond simple online sales, with the social commerce impact on conversion rates being a key metric for many brands.
- This is especially true for live-stream selling for fashion brands, which blends entertainment with commerce to drive impulse purchases. To support this digital-first approach, businesses are focused on last-mile delivery optimization using ai and exploring the potential of phygital integration in brick-and-mortar stores.
- The cultural shift toward the guochao trend affecting brand preference cannot be overstated, compelling both domestic and international players to refine their messaging. Effective data analytics for personalized marketing campaigns is crucial for reaching fragmented consumer segments. Simultaneously, there's a growing demand for supply chain traceability for conscious consumers, making blockchain applications in luxury retail an area of increasing investment.
- This focus on transparency and authenticity helps build trust. From an operational standpoint, reducing customer acquisition cost online while increasing customer lifetime value in e-commerce remains a core challenge. The impact of mobile payment systems has been transformative, enabling models like the o2o model for grocery retail and community group purchasing growth drivers.
- Companies adopting a D2C strategy for beauty products or managing inventory for flash sales are leveraging AI chatbots in customer service and using big data for demand forecasting to stay agile in this competitive environment, where the use of augmented reality in furniture retail is also gaining traction.
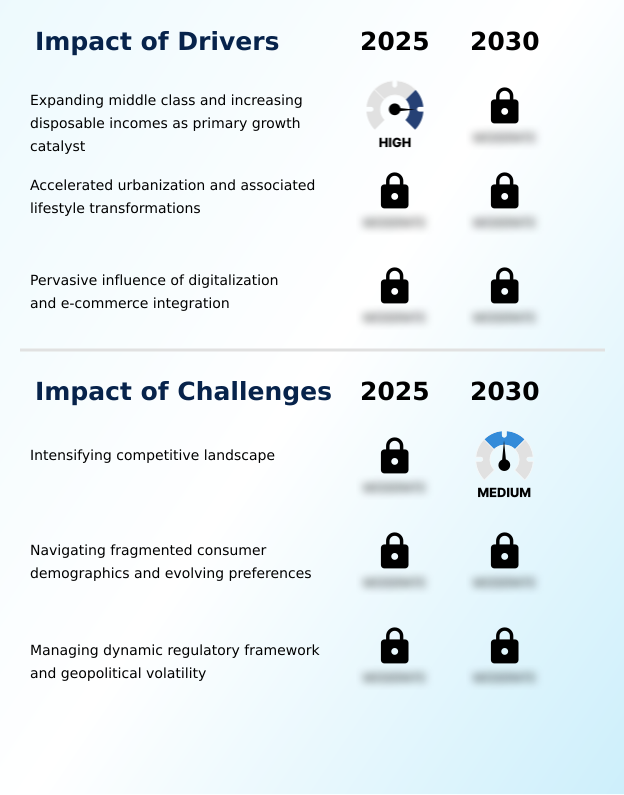
What are the key market drivers leading to the rise in the adoption of China Retail Industry?
- The expanding middle class and rising disposable incomes are the primary catalysts driving market growth.
- Growth is propelled by pervasive digitalization, which supports an advanced omnichannel strategy and O2O integration across all sectors. The widespread adoption of mobile payment systems facilitates a seamless checkout process and enables innovative models like community group purchasing.
- Investment in key opinion leader marketing has shown a direct correlation with market penetration, with some brands attributing 40% of new customer acquisition to these campaigns.
- Furthermore, advancements in big data analytics are crucial for demand forecasting, allowing businesses to optimize inventory turnover ratio by as much as 25%.
- This data-driven approach, combined with a focus on a unified commerce experience and user-generated content, creates a powerful growth engine.
What are the market trends shaping the China Retail Industry?
- The market is defined by the ascendancy of experiential retail and hyper-personalization. This trend reshapes consumer engagement from transactional to relational.
- Key trends are reshaping the market, led by the unstoppable integration of social network integration and influencer-led marketing, which now drives over 35% of sales in the beauty category. The hyper-personalization engine, fueled by sophisticated customer sentiment analysis and a dynamic pricing model, has enabled leading retailers to improve conversion rates by up to 22%.
- Experiential retail is being redefined through phygital integration, where augmented reality mirrors and interactive product displays in digital storefronts create an immersive shopping experience. This is complemented by the rise of the direct-to-consumer model and click-and-collect options, which improve convenience. Automated checkout systems are also gaining traction, reducing average transaction times by 60% in pilot stores.
What challenges does the China Retail Industry face during its growth?
- An intensifying competitive landscape presents a key challenge to sustainable industry growth.
- The primary challenge is navigating an intensely competitive landscape where customer acquisition cost has increased by an average of 30% over the last two years. Managing a complex supply chain management system capable of supporting rapid delivery services and on-demand fulfillment is another significant hurdle, with logistics representing up to 15% of total operational costs for some e-commerce players.
- The need for a sophisticated data governance framework to comply with evolving privacy regulations adds complexity and cost. Furthermore, achieving effective cross-border e-commerce operations requires overcoming significant tariff and regulatory obstacles. Differentiating through private label branding while maintaining profitability in a market dominated by flash sales models and peer-to-peer recommendation systems remains a constant struggle for many retailers.
Exclusive Technavio Analysis on Customer Landscape
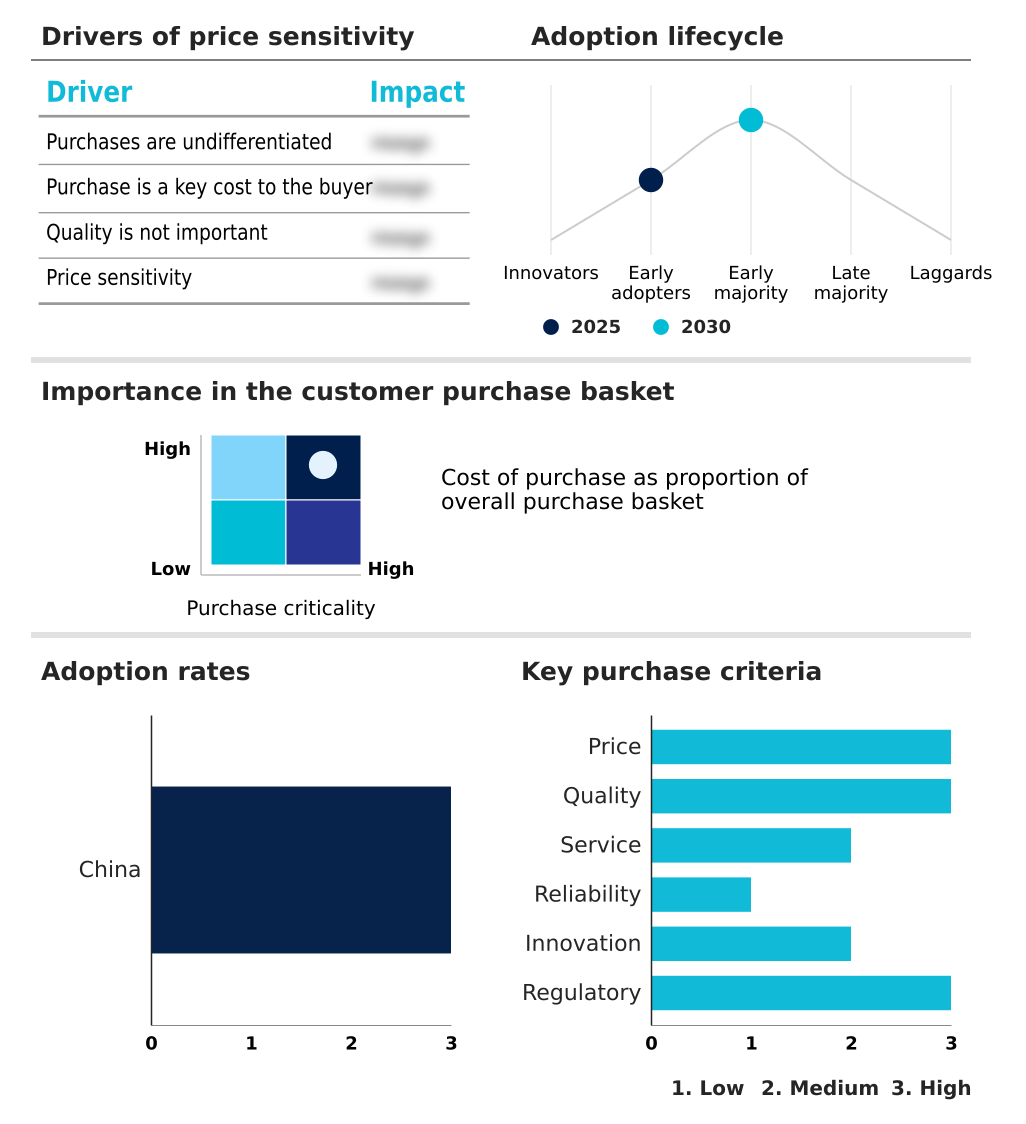
The china retail market forecasting report includes the adoption lifecycle of the market, covering from the innovator’s stage to the laggard’s stage. It focuses on adoption rates in different regions based on penetration. Furthermore, the china retail market report also includes key purchase criteria and drivers of price sensitivity to help companies evaluate and develop their market growth analysis strategies.
Customer Landscape of China Retail Industry
Competitive Landscape
Companies are implementing various strategies, such as strategic alliances, china retail market forecast, partnerships, mergers and acquisitions, geographical expansion, and product/service launches, to enhance their presence in the industry.
Aldi Group - Analysis indicates a focus on integrated retail ecosystems, leveraging data-driven personalization and omnichannel strategies to capture market share across diverse consumer segments and product categories.
The industry research and growth report includes detailed analyses of the competitive landscape of the market and information about key companies, including:
- Aldi Group
- Alibaba Group Holding Ltd.
- Bailian Group
- Carrefour SA
- CK Hutchison Holdings Ltd.
- Costco Wholesale Corp.
- GOME Retail Holdings Ltd.
- Inter IKEA Holding BV
- JD.com Inc.
- PetroChina Co. Ltd.
- Sun Art Retail Group Ltd.
- Suning.com Co. Ltd.
- UNIQLO Co
- Vipshop Holdings Ltd.
- Walmart Inc.
- Yonghui Superstores Co. Ltd.
Qualitative and quantitative analysis of companies has been conducted to help clients understand the wider business environment as well as the strengths and weaknesses of key industry players. Data is qualitatively analyzed to categorize companies as pure play, category-focused, industry-focused, and diversified; it is quantitatively analyzed to categorize companies as dominant, leading, strong, tentative, and weak.
Recent Development and News in China retail market
- In January 2025, the National Development and Reform Commission initiated a nationwide policy to stimulate domestic consumption through incentives for large-scale equipment updates and consumer goods trade-ins, impacting categories like household appliances and electronics.
- In February 2025, Alibaba Group Holding Ltd. announced a strategic partnership to embed advanced AI services into consumer technology products, aiming to enhance user experience and drive sales through intelligent features.
- In August 2024, JD.com Inc. confirmed a major investment to expand its rural supply chain infrastructure, utilizing AI-powered demand forecasting and advanced logistics to serve consumers in lower-tier cities.
- In October 2024, UNIQLO Co. launched a new sustainable apparel line that incorporates traditional cultural motifs, directly tapping into the growing Guochao movement and consumer demand for eco-conscious products.
Dive into Technavio’s robust research methodology, blending expert interviews, extensive data synthesis, and validated models for unparalleled China Retail Market insights. See full methodology.
| Market Scope | |
|---|---|
| Page number | 201 |
| Base year | 2025 |
| Historic period | 2020-2024 |
| Forecast period | 2026-2030 |
| Growth momentum & CAGR | Accelerate at a CAGR of 8.9% |
| Market growth 2026-2030 | USD 1539.5 billion |
| Market structure | Fragmented |
| YoY growth 2025-2026(%) | 8.2% |
| Key countries | China |
| Competitive landscape | Leading Companies, Market Positioning of Companies, Competitive Strategies, and Industry Risks |
Research Analyst Overview
- The retail market is defined by its rapid adoption of an advanced omnichannel strategy and O2O integration, creating a fluid commercial environment. Key differentiators include the effective use of a social commerce platform and live-stream commerce, which demand a robust infrastructure supporting mobile payment systems.
- Success hinges on mastering last-mile delivery and employing AI-powered demand forecasting for efficient supply chain management. Experiential retail and phygital integration are no longer novelties but essential components, with technologies like augmented reality mirrors and interactive product displays becoming standard in digital storefronts.
- Boardroom decisions are increasingly focused on leveraging big data analytics and a consumer data platform for deep data-driven personalization. Companies that master this have achieved a 30% reduction in customer acquisition cost. This requires a hyper-personalization engine, advanced customer relationship management, and optimized conversion rate optimization tactics.
- The rise of private label branding and smart home technology integration further complicates the competitive landscape, making warehouse automation and real-time inventory tracking critical for maintaining margins.
What are the Key Data Covered in this China Retail Market Research and Growth Report?
-
What is the expected growth of the China Retail Market between 2026 and 2030?
-
USD 1539.5 billion, at a CAGR of 8.9%
-
-
What segmentation does the market report cover?
-
The report is segmented by Product (Food and beverages, Apparel and footwear, Home improvement, Consumer electronics and appliances, and Beauty and personal care), Distribution Channel (Offline, and Online), Pricing Scheme (Digital payment, Buy now pay later, and Cash) and Geography (APAC)
-
-
Which regions are analyzed in the report?
-
APAC
-
-
What are the key growth drivers and market challenges?
-
Expanding middle class and increasing disposable incomes as primary growth catalyst, Intensifying competitive landscape
-
-
Who are the major players in the China Retail Market?
-
Aldi Group, Alibaba Group Holding Ltd., Bailian Group, Carrefour SA, CK Hutchison Holdings Ltd., Costco Wholesale Corp., GOME Retail Holdings Ltd., Inter IKEA Holding BV, JD.com Inc., PetroChina Co. Ltd., Sun Art Retail Group Ltd., Suning.com Co. Ltd., UNIQLO Co, Vipshop Holdings Ltd., Walmart Inc. and Yonghui Superstores Co. Ltd.
-
Market Research Insights
- The market's momentum is defined by a significant consumption upgrade trend, with a focus on the new retail concept and phygital customer journey. The integration of a robust product recommendation engine and a seamless checkout process has become standard, contributing to a 25% increase in average order value for leading platforms.
- The influencer-led marketing model, a core part of the digital ecosystem integration, now accounts for over 40% of marketing spend in key categories. Retailers are also leveraging in-store analytics and a membership-based retail structure to enhance customer loyalty. As the Guochao movement gains traction, effective brand storytelling is crucial for capturing the attention of the brand-conscious consumer.
We can help! Our analysts can customize this china retail market research report to meet your requirements.
 RIA -
RIA - 
