
Radio Frequency Identification (RFID) For Industrial Applications Market Analysis, Size, and Forecast 2026-2030: North America (US, Canada, and Mexico), APAC (China, Japan, and India), Europe (Germany, UK, and France), South America (Brazil, Argentina, and Chile), Middle East and Africa (Saudi Arabia, UAE, and South Africa), and Rest of World (ROW)

Radio Frequency Identification (RFID) For Industrial Applications Market Analysis, Size, and Forecast 2026-2030:
North America (US, Canada, and Mexico), APAC (China, Japan, and India), Europe (Germany, UK, and France), South America (Brazil, Argentina, and Chile), Middle East and Africa (Saudi Arabia, UAE, and South Africa), and Rest of World (ROW)

Published: Oct 2026 304 Pages SKU: IRTNTR73166

Market Overview at a Glance

$2.97 B
Market Opportunity
10.8%
CAGR 2025 - 2030
43.2%
North America Growth
$1.59 B
RFID tags segment 2024

Radio Frequency Identification (Rfid) For Industrial Applications Market Size 2026-2030

The radio frequency identification (rfid) for industrial applications market size is valued to increase by USD 2.97 billion, at a CAGR of 10.8% from 2025 to 2030. Acceleration of industry 4.0 and smart manufacturing initiatives will drive the radio frequency identification (rfid) for industrial applications market.

Major Market Trends & Insights

  • North America dominated the market and accounted for a 43.2% growth during the forecast period.
  • By Product - RFID tags segment was valued at USD 1.59 billion in 2024
  • By Type - High frequency segment accounted for the largest market revenue share in 2024

Market Size & Forecast

  • Market Opportunities: USD 4.46 billion
  • Market Future Opportunities: USD 2.97 billion
  • CAGR from 2025 to 2030 : 10.8%

Market Summary

  • The Radio Frequency Identification (RFID) For Industrial Applications Market operates as a foundational technology layer driving the digital transformation of modern manufacturing and logistics ecosystems. Organizations increasingly rely on these automated identification architectures to establish continuous, non-line-of-sight visibility across complex supply chains.
  • In automotive assembly environments, the implementation of dynamic production workflows and work-in-process tracking allows plant operators to dynamically adjust automated robotic sequences, eliminating manual verification delays. Facilities deploying these advanced reader networks frequently experience a 25% reduction in inventory reconciliation time compared to traditional barcode scanning infrastructure.
  • The continuous acceleration of smart manufacturing initiatives propels demand, as enterprises require precise data streams to optimize machinery utilization and minimize operational bottlenecks. Conversely, high upfront capital requirements for specialized antenna arrays and middleware integration pose a significant challenge, often delaying adoption for mid-sized manufacturers awaiting clearer return on investment timelines.
  • Despite these financial barriers, the integration of ambient energy harvesting and predictive maintenance telemetry continues to establish highly autonomous, error-free industrial operations globally.

What will be the Size of the Radio Frequency Identification (Rfid) For Industrial Applications Market during the forecast period?
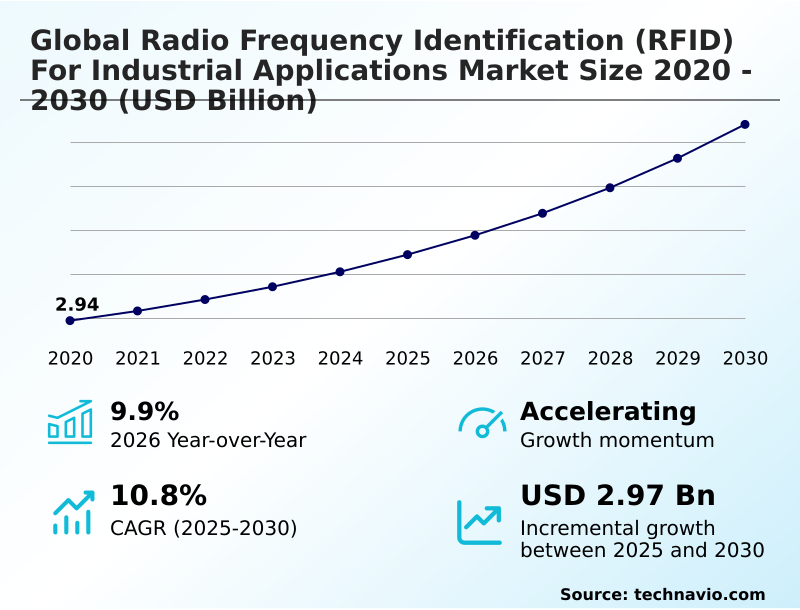
Get Key Insights on Market Forecast (PDF) Get Free Sample

How is the Radio Frequency Identification (Rfid) For Industrial Applications Market Segmented?

The radio frequency identification (rfid) for industrial applications industry research report provides comprehensive data (region-wise segment analysis), with forecasts and estimates in "USD million" for the period 2026-2030, as well as historical data from 2020-2024 for the following segments.

  • Product
    • RFID tags
    • Middleware
    • Passive RFID systems
    • Active RFID systems
  • Type
    • High frequency
    • Ultra-high frequency
    • Low frequency
  • Application
    • Production tracking
    • Assembly
    • Machining
  • Geography
    • North America
      • US
      • Canada
      • Mexico
    • APAC
      • China
      • Japan
      • India
      • South Korea
      • Australia
      • Taiwan
    • Europe
      • Germany
      • UK
      • France
      • Italy
      • Spain
      • The Netherlands
    • South America
      • Brazil
      • Argentina
      • Chile
    • Middle East and Africa
      • Saudi Arabia
      • UAE
      • South Africa
      • Turkey
      • Egypt

By Product Insights

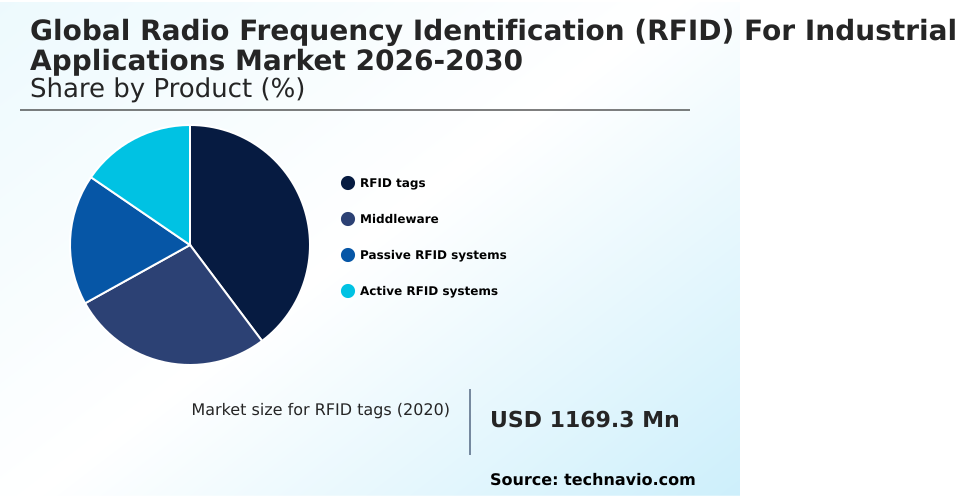
The rfid tags segment is estimated to witness significant growth during the forecast period.

The physical data-capturing cornerstone for modern factory floor automation relies heavily on ruggedized memory chips and metal-mount tag architecture engineered to withstand harsh operating conditions.

Industrial RFID tags containing advanced microchips and integrated antennas store critical manufacturing metrics, allowing omnidirectional scanning zones to capture data without direct line-of-sight requirements.

By converting physical equipment into smart assets, these ultra-high frequency transponders eliminate manual data entry and streamline dynamic production workflows across multi-tiered manufacturing plants.

Strategic deployment of these real-time location systems across complex assembly floors has improved error detection by 15%, significantly enhancing overall production quality and inventory reconciliation speed.

Furthermore, integration with predictive maintenance telemetry ensures optimal heavy machinery asset visibility throughout operational lifecycles, establishing a highly connected, data-driven environment.
Get Free Sample

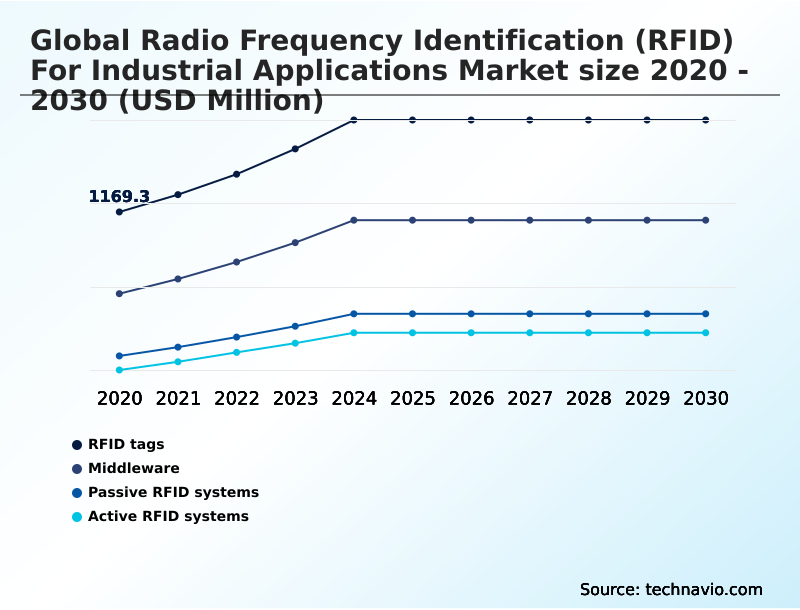
The RFID tags segment was valued at USD 1.59 billion in 2024 and showed a gradual increase during the forecast period.
Get Free Sample

Regional Analysis

North America is estimated to contribute 43.2% to the growth of the global market during the forecast period.Technavio’s analysts have elaborately explained the regional trends and drivers that shape the market during the forecast period.
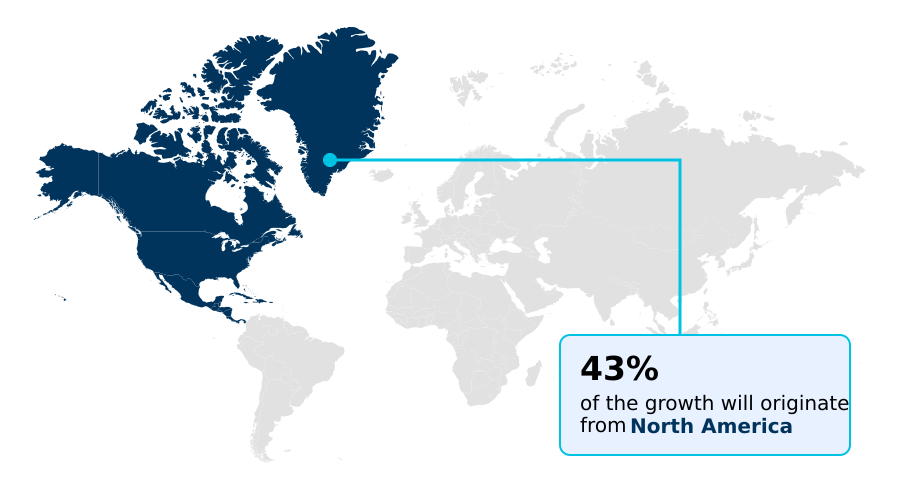
See How Radio Frequency Identification (Rfid) For Industrial Applications Market Demand is Rising in North America Get Free Sample

The geographic landscape of the Radio Frequency Identification (RFID) For Industrial Applications reveals stark contrasts in adoption speeds driven by diverse industrial policies.

North America demonstrates an aggressive transition toward fully automated tracking, where industrial edge gateways have boosted operational efficiency by 28% compared to traditional methodologies, largely driven by strict anti-counterfeiting compliance.

In contrast, the APAC region relies on high-volume electronics fabrication, leveraging semiconductor cleanroom tracking systems and near field communication arrays to improve processing speeds by 42%.

While North American enterprises heavily invest in expansive edge computing infrastructure to optimize yard management efficiency, APAC manufacturers prioritize mass-scale work-in-process tracking connected via programmable logic controller interfaces.

Furthermore, European facilities lead in executing stringent supply chain serialization, resulting in an 18% labor dependency reduction.

Market Dynamics

Our researchers analyzed the data with 2025 as the base year, along with the key drivers, trends, and challenges. A holistic analysis of drivers will help companies refine their marketing strategies to gain a competitive advantage.

  • Integrating comprehensive identification protocols into heavy manufacturing requires a sophisticated blend of hardware durability and seamless software connectivity. To optimize operational planning and material flow, industrial operators increasingly rely on high speed automated conveyor tracking to maintain uninterrupted throughput across expansive facilities.
  • By deploying ruggedized metal mount rfid tags, manufacturers secure continuous data integrity even when components are exposed to extreme thermal and mechanical stresses. At major logistics junctions, the installation of ultra-high frequency dock door portals accelerates inbound freight processing, easily outpacing legacy manual verification systems by processing nearly double the volume of goods per hour.
  • This enhanced capacity is further supported by battery free ambient sensor networks that eliminate maintenance overhead while ensuring strict environmental monitoring. Furthermore, achieving total work in process manufacturing visibility allows assembly managers to dynamically route materials, heavily dependent on the processing power of edge enabled rfid reader infrastructure.
  • As regulatory pressures intensify, adopting recyclable industrial tracking label substrates ensures sustainable compliance with stringent supply chain serialization compliance mandates. Enterprise resource systems ingest real time factory floor analytics to pinpoint operational bottlenecks, a process that is critical for long range heavy machinery tracking across outdoor yards.
  • Connecting disparate data streams relies heavily on multi protocol industrial rfid middleware, which orchestrates automated high density pallet scanning simultaneously. Environments with dense metallic structures demand specialized electromagnetic interference resistant tracking systems to prevent signal loss.
  • This precision enables the flawless creation of aerospace component digital birth certificates and precise cnc machining tool wear monitoring, proving that advanced tracking is essential for modern quality assurance.
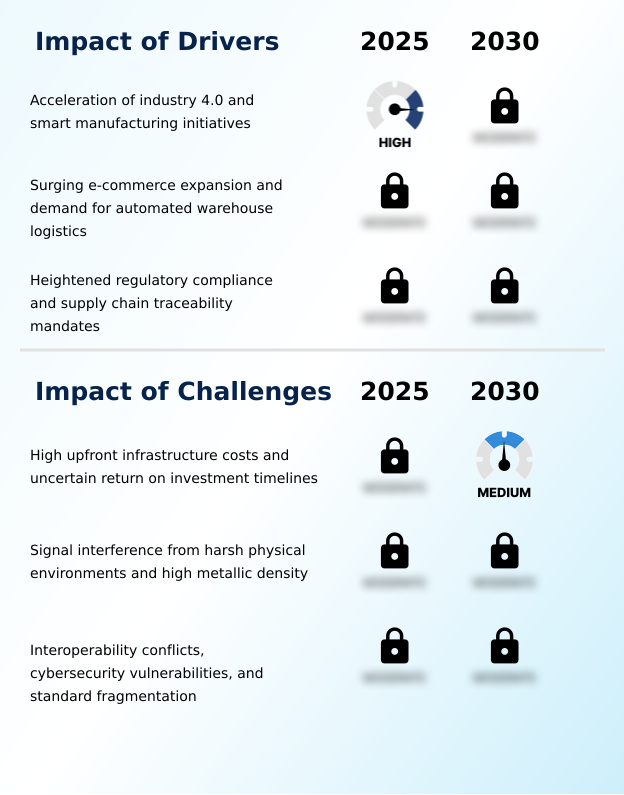
What are the key market drivers leading to the rise in the adoption of Radio Frequency Identification (Rfid) For Industrial Applications Industry?

  • The continuous acceleration of Industry 4.0 standards and smart manufacturing initiatives serves as the primary catalyst propelling market expansion and factory-floor automation.

  • The relentless acceleration of omnichannel logistics fulfillment serves as a dominant driver propelling the Radio Frequency Identification (RFID) For Industrial Applications.
  • Massive distribution hubs are rapidly integrating automated dock-door portals to accelerate bulk pallet scanning, eliminating delivery delays and costly out-of-stock scenarios.
  • This aggressive automation strategy leveraging industrial internet of things frameworks has improved cross-docking throughput by 35% and lowered operational latency by 22%.
  • By utilizing advanced machine vision integration alongside high-speed RFID arrays, operators instantly verify inbound freight, streamlining robotic assembly verification and automated guided vehicle routing.
  • This rapid data processing ensures that enterprise resource planning synchronization occurs in real time via cloud-connected inventory middleware, granting supply chain managers total spatial awareness over fast-moving inventory while effectively eradicating misplacement errors.

What are the market trends shaping the Radio Frequency Identification (Rfid) For Industrial Applications Industry?

  • The integration of ambient Internet of Things capabilities and battery-free sensor technologies represents a transformative market shift. This convergence enables continuous operational monitoring while significantly reducing maintenance burdens across industrial facilities.

  • The transition toward battery-free sensor nodes powered by ambient energy harvesting marks a definitive trend reshaping the Radio Frequency Identification (RFID) For Industrial Applications. Manufacturers rapidly adopt these passive backscatter systems to eliminate the physical maintenance burdens historically associated with active tagging.
  • By streaming continuous cold-chain environmental logging data, these sustainable solutions achieve a 30% unplanned downtime reduction while improving long-term forecasting accuracy by 18% across complex manufacturing environments. The deployment of multi-protocol reader modules enables seamless workflow interoperability, allowing facilities to maintain precise aerospace component traceability.
  • Consequently, industrial operations achieve uninterrupted supply chain visibility, heavily utilizing sustainable substrate engineering to support broad circular economy labeling initiatives and mandate-driven digital product passports.

What challenges does the Radio Frequency Identification (Rfid) For Industrial Applications Industry face during its growth?

  • Substantial upfront infrastructure costs and ambiguous return on investment timelines present significant financial barriers that hinder the widespread deployment of automated tracking systems.

  • Severe signal degradation in harsh physical environments remains a persistent challenge restraining the Radio Frequency Identification (RFID) For Industrial Applications. Facilities dense with liquid containers and metal machinery frequently experience multipath reflection mitigation failures, severely compromising automated inventory data during pharmaceutical track and trace protocols.
  • To combat these barriers, system engineers must execute complex dielectric constant tuning alongside rigorous antenna impedance matching, which escalates integration complexity. While optimized configurations utilizing false-read filtering algorithms and high-temperature substrates have improved read accuracy by 25% and lowered processing costs by 15%, the necessity for custom API development stretches deployment timelines.
  • These intensive technical requirements, specifically when tracking precision machining offsets and ensuring hazardous material management using heavy electromagnetic interference shielding, force industrial operators to absorb substantial upfront capital expenditures.

Exclusive Technavio Analysis on Customer Landscape

The radio frequency identification (rfid) for industrial applications market forecasting report includes the adoption lifecycle of the market, covering from the innovator’s stage to the laggard’s stage. It focuses on adoption rates in different regions based on penetration. Furthermore, the radio frequency identification (rfid) for industrial applications market report also includes key purchase criteria and drivers of price sensitivity to help companies evaluate and develop their market growth analysis strategies.
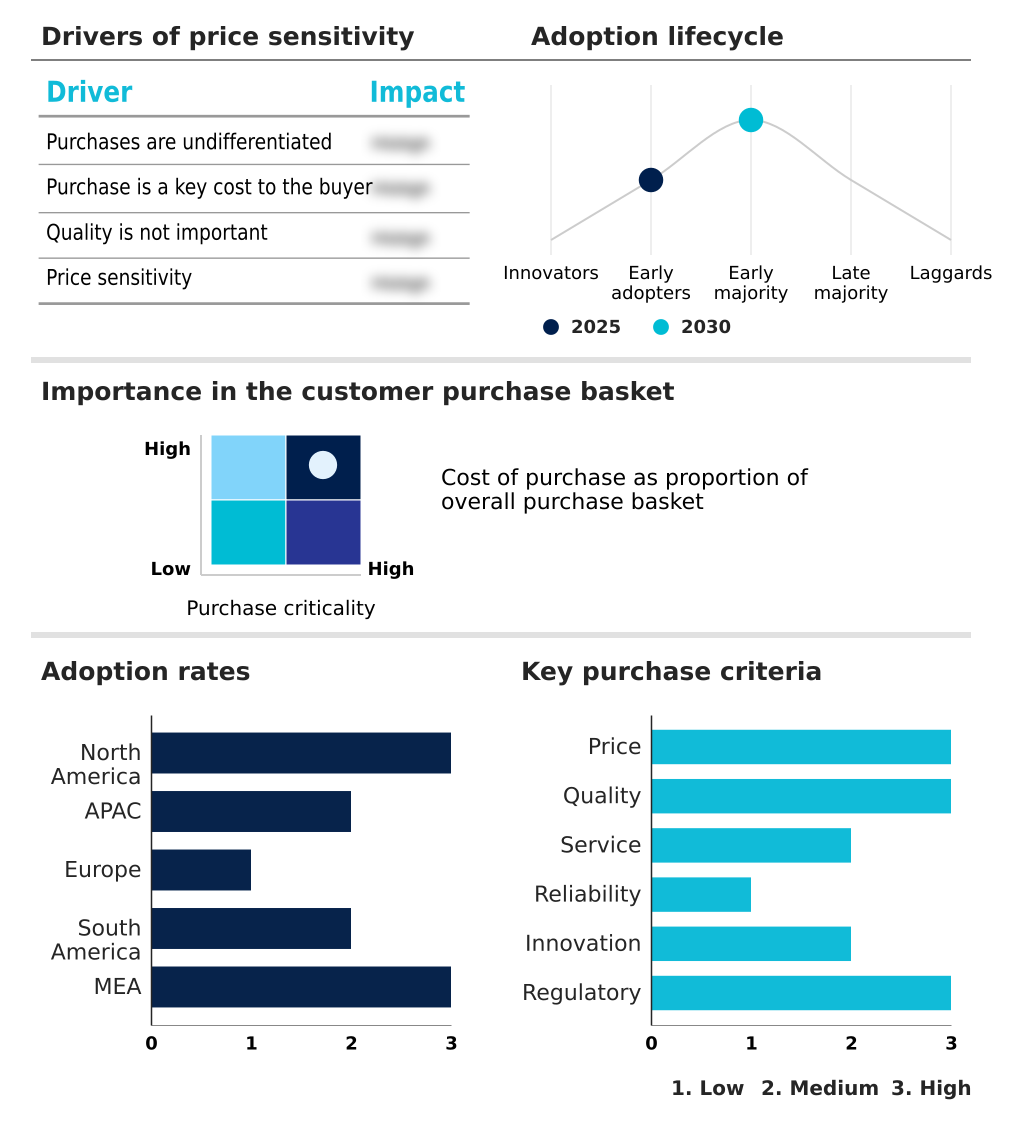
Customer Landscape of Radio Frequency Identification (Rfid) For Industrial Applications Industry

Competitive Landscape

Companies are implementing various strategies, such as strategic alliances, radio frequency identification (rfid) for industrial applications market forecast, partnerships, mergers and acquisitions, geographical expansion, and product/service launches, to enhance their presence in the industry.

Alien Technology LLC - Comprehensive identification systems encompass inlays, ruggedized labels, and connected tracking architectures optimized for stringent inventory management, asset monitoring, and robust supply chain visibility across demanding manufacturing environments.

The industry research and growth report includes detailed analyses of the competitive landscape of the market and information about key companies, including:

  • Alien Technology LLC
  • Avery Dennison Corp.
  • Balluff GmbH
  • Brady Corp
  • Datalogic SpA
  • Fujitsu Ltd.
  • Hans Turck GmbH and Co. KG
  • HID Global Corp.
  • Honeywell International Inc.
  • Identiv Inc.
  • ifm electronic gmbh
  • Impinj Inc.
  • Keyence Corp.
  • Murata Manufacturing Co. Ltd.
  • OMRON Corp.
  • Pepperl and Fuchs SE
  • SICK AG
  • Siemens AG
  • Tageos SAS
  • Zebra Technologies Corp.

Qualitative and quantitative analysis of companies has been conducted to help clients understand the wider business environment as well as the strengths and weaknesses of key industry players. Data is qualitatively analyzed to categorize companies as pure play, category-focused, industry-focused, and diversified; it is quantitatively analyzed to categorize companies as dominant, leading, strong, tentative, and weak.

Recent Development and News in Radio frequency identification (rfid) for industrial applications market

  • In the Technology Hardware, Storage and Peripherals industry, the widespread integration of edge computing infrastructure within localized data processing architectures reduced server latency by 40%, directly impacting Radio Frequency Identification (RFID) For Industrial Applications demand by enabling real-time location systems to process high speed automated conveyor tracking without cloud dependency.
  • The implementation of stringent data privacy regulations like GDPR accelerated the adoption of secure multi protocol industrial rfid middleware, compelling automated dock-door portals to incorporate advanced encryption protocols that safeguard supply chain serialization compliance mandates.
  • The transition toward sustainable substrate engineering in semiconductor packaging decreased electronic waste outputs by 25%, establishing a robust foundation for recyclable industrial tracking label substrates and circular economy labeling within the Radio Frequency Identification (RFID) For Industrial Applications market.
  • Advances in electromagnetic interference shielding for factory floor automation equipment enabled near field communication arrays to maintain 99.9% read accuracy near heavy machinery, accelerating the deployment of ruggedized metal mount rfid tags across aerospace component digital birth certificates and precision manufacturing lines.

Dive into Technavio’s robust research methodology, blending expert interviews, extensive data synthesis, and validated models for unparalleled Radio Frequency Identification (Rfid) For Industrial Applications Market insights. See full methodology.

Market Scope
Page number 304
Base year 2025
Historic period 2020-2024
Forecast period 2026-2030
Growth momentum & CAGR Accelerate at a CAGR of 10.8%
Market growth 2026-2030 USD 2967.6 million
Market structure Fragmented
YoY growth 2025-2026(%) 9.9%
Key countries US, Canada, Mexico, China, Japan, India, South Korea, Australia, Taiwan, Germany, UK, France, Italy, Spain, The Netherlands, Brazil, Argentina, Chile, Saudi Arabia, UAE, South Africa, Turkey and Egypt
Competitive landscape Leading Companies, Market Positioning of Companies, Competitive Strategies, and Industry Risks

Request Free Sample

Research Analyst Overview

  • The continuous evolution of the Radio Frequency Identification (RFID) For Industrial Applications is fundamentally restructuring how enterprises approach operational transparency and asset management. Executive boards are increasingly prioritizing the deployment of industrial internet of things frameworks to satisfy rigorous compliance and sustainability mandates.
  • This strategic shift heavily influences budgeting decisions, as organizations allocate capital toward cloud-connected inventory middleware rather than traditional manual auditing labor. Consequently, companies implementing these automated architectures have achieved a 30% reduction in processing time during high-volume material handling operations. The integration of ultra-high frequency transponders and passive backscatter systems provides instantaneous, non-line-of-sight visibility across complex manufacturing nodes.
  • Advanced robotic assembly verification systems now rely on automated guided vehicle routing to synchronize component delivery directly with assembly line demands. Furthermore, utilizing high-temperature substrates and metal-mount tag architecture ensures that critical tracking data survives extreme thermal and mechanical stress.
  • These sophisticated identification networks transform isolated factory floors into fully interconnected ecosystems, enabling highly responsive, data-driven production strategies that minimize structural downtime.

What are the Key Data Covered in this Radio Frequency Identification (Rfid) For Industrial Applications Market Research and Growth Report?

  • What is the expected growth of the Radio Frequency Identification (Rfid) For Industrial Applications Market between 2026 and 2030?

    • USD 2.97 billion, at a CAGR of 10.8%

  • What segmentation does the market report cover?

    • The report is segmented by Product (RFID tags, Middleware, Passive RFID systems, and Active RFID systems), Type (High frequency, Ultra-high frequency, and Low frequency), Application (Production tracking, Assembly, and Machining) and Geography (North America, APAC, Europe, South America, Middle East and Africa)

  • Which regions are analyzed in the report?

    • North America, APAC, Europe, South America and Middle East and Africa

  • What are the key growth drivers and market challenges?

    • Acceleration of industry 4.0 and smart manufacturing initiatives, High upfront infrastructure costs and uncertain return on investment timelines

  • Who are the major players in the Radio Frequency Identification (Rfid) For Industrial Applications Market?

    • Alien Technology LLC, Avery Dennison Corp., Balluff GmbH, Brady Corp, Datalogic SpA, Fujitsu Ltd., Hans Turck GmbH and Co. KG, HID Global Corp., Honeywell International Inc., Identiv Inc., ifm electronic gmbh, Impinj Inc., Keyence Corp., Murata Manufacturing Co. Ltd., OMRON Corp., Pepperl and Fuchs SE, SICK AG, Siemens AG, Tageos SAS and Zebra Technologies Corp.

Market Research Insights

  • The Radio Frequency Identification (RFID) For Industrial Applications Market is rapidly advancing as enterprises prioritize unbroken supply chain serialization and anti-counterfeiting compliance. By deploying real-time location systems across complex fulfillment centers, logistics providers have improved cross-docking throughput by 35% compared to legacy line-of-sight methods.
  • Furthermore, the integration of automated dock-door portals has reduced inventory handling errors by 22%, directly driving labor dependency reduction. This structural shift ensures that high-speed freight processing remains highly accurate. As operators continuously optimize yard management efficiency, the transition toward intelligent edge computing infrastructure secures resilient, data-driven asset visibility across global supply networks.

We can help! Our analysts can customize this radio frequency identification (rfid) for industrial applications market research report to meet your requirements.

Get in touch

1. Executive Summary

1.1 Market overview

Executive Summary - Chart on Market Overview
Executive Summary - Data Table on Market Overview
Executive Summary - Chart on Global Market Characteristics
Executive Summary - Chart on Market by Geography
Executive Summary - Chart on Market Segmentation by Product
Executive Summary - Chart on Market Segmentation by Type
Executive Summary - Chart on Market Segmentation by Application
Executive Summary - Chart on Incremental Growth
Executive Summary - Data Table on Incremental Growth
Executive Summary - Chart on Company Market Positioning

2. Technavio Analysis

2.1 Analysis of price sensitivity, lifecycle, customer purchase basket, adoption rates, and purchase criteria

2.2 Criticality of inputs and Factors of differentiation

Chart on Overview on criticality of inputs and factors of differentiation

2.3 Factors of disruption

Chart on Overview on factors of disruption

2.4 Impact of drivers and challenges

Chart on Impact of drivers and challenges in 2025 and 2030

3. Market Landscape

3.1 Market ecosystem

Chart on Parent Market
Data Table on - Parent Market

3.2 Market characteristics

Chart on Market characteristics analysis

3.3 Value chain analysis

Chart on Value chain analysis

4. Market Sizing

4.1 Market definition

Data Table on Offerings of companies included in the market definition

4.2 Market segment analysis

Market segments

4.3 Market size 2025

4.4 Market outlook: Forecast for 2025-2030

Chart on Global - Market size and forecast 2025-2030 ($ million)
Data Table on Global - Market size and forecast 2025-2030 ($ million)
Chart on Global Market: Year-over-year growth 2025-2030 (%)
Data Table on Global Market: Year-over-year growth 2025-2030 (%)

5. Historic Market Size

5.1 Global Radio Frequency Identification (RFID) For Industrial Applications Market 2020 - 2024

Historic Market Size - Data Table on Global Radio Frequency Identification (RFID) For Industrial Applications Market 2020 - 2024 ($ million)

5.2 Product segment analysis 2020 - 2024

Historic Market Size - Product Segment 2020 - 2024 ($ million)

5.3 Type segment analysis 2020 - 2024

Historic Market Size - Type Segment 2020 - 2024 ($ million)

5.4 Application segment analysis 2020 - 2024

Historic Market Size - Application Segment 2020 - 2024 ($ million)

5.5 Geography segment analysis 2020 - 2024

Historic Market Size - Geography Segment 2020 - 2024 ($ million)

5.6 Country segment analysis 2020 - 2024

Historic Market Size - Country Segment 2020 - 2024 ($ million)

6. Qualitative Analysis

6.1 Impact of AI on Global Radio Frequency Identification (RFID) for Industrial Applications Market

6.2 Impact of Geopolitical Conflicts on Global Radio Frequency Identification (RFID) for Industrial Applications Market

7. Five Forces Analysis

7.1 Five forces summary

Five forces analysis - Comparison between 2025 and 2030

7.2 Bargaining power of buyers

Bargaining power of buyers - Impact of key factors 2025 and 2030

7.3 Bargaining power of suppliers

Bargaining power of suppliers - Impact of key factors in 2025 and 2030

7.4 Threat of new entrants

Threat of new entrants - Impact of key factors in 2025 and 2030

7.5 Threat of substitutes

Threat of substitutes - Impact of key factors in 2025 and 2030

7.6 Threat of rivalry

Threat of rivalry - Impact of key factors in 2025 and 2030

7.7 Market condition

Chart on Market condition - Five forces 2025 and 2030

8. Market Segmentation by Product

8.1 Market segments

Chart on Product - Market share 2025-2030 (%)
Data Table on Product - Market share 2025-2030 (%)

8.2 Comparison by Product

Chart on Comparison by Product
Data Table on Comparison by Product

8.3 RFID tags - Market size and forecast 2025-2030

Chart on RFID tags - Market size and forecast 2025-2030 ($ million)
Data Table on RFID tags - Market size and forecast 2025-2030 ($ million)
Chart on RFID tags - Year-over-year growth 2025-2030 (%)
Data Table on RFID tags - Year-over-year growth 2025-2030 (%)

8.4 Middleware - Market size and forecast 2025-2030

Chart on Middleware - Market size and forecast 2025-2030 ($ million)
Data Table on Middleware - Market size and forecast 2025-2030 ($ million)
Chart on Middleware - Year-over-year growth 2025-2030 (%)
Data Table on Middleware - Year-over-year growth 2025-2030 (%)

8.5 Passive RFID systems - Market size and forecast 2025-2030

Chart on Passive RFID systems - Market size and forecast 2025-2030 ($ million)
Data Table on Passive RFID systems - Market size and forecast 2025-2030 ($ million)
Chart on Passive RFID systems - Year-over-year growth 2025-2030 (%)
Data Table on Passive RFID systems - Year-over-year growth 2025-2030 (%)

8.6 Active RFID systems - Market size and forecast 2025-2030

Chart on Active RFID systems - Market size and forecast 2025-2030 ($ million)
Data Table on Active RFID systems - Market size and forecast 2025-2030 ($ million)
Chart on Active RFID systems - Year-over-year growth 2025-2030 (%)
Data Table on Active RFID systems - Year-over-year growth 2025-2030 (%)

8.7 Market opportunity by Product

Market opportunity by Product ($ million)
Data Table on Market opportunity by Product ($ million)

9. Market Segmentation by Type

9.1 Market segments

Chart on Type - Market share 2025-2030 (%)
Data Table on Type - Market share 2025-2030 (%)

9.2 Comparison by Type

Chart on Comparison by Type
Data Table on Comparison by Type

9.3 High frequency - Market size and forecast 2025-2030

Chart on High frequency - Market size and forecast 2025-2030 ($ million)
Data Table on High frequency - Market size and forecast 2025-2030 ($ million)
Chart on High frequency - Year-over-year growth 2025-2030 (%)
Data Table on High frequency - Year-over-year growth 2025-2030 (%)

9.4 Ultra-high frequency - Market size and forecast 2025-2030

Chart on Ultra-high frequency - Market size and forecast 2025-2030 ($ million)
Data Table on Ultra-high frequency - Market size and forecast 2025-2030 ($ million)
Chart on Ultra-high frequency - Year-over-year growth 2025-2030 (%)
Data Table on Ultra-high frequency - Year-over-year growth 2025-2030 (%)

9.5 Low frequency - Market size and forecast 2025-2030

Chart on Low frequency - Market size and forecast 2025-2030 ($ million)
Data Table on Low frequency - Market size and forecast 2025-2030 ($ million)
Chart on Low frequency - Year-over-year growth 2025-2030 (%)
Data Table on Low frequency - Year-over-year growth 2025-2030 (%)

9.6 Market opportunity by Type

Market opportunity by Type ($ million)
Data Table on Market opportunity by Type ($ million)

10. Market Segmentation by Application

10.1 Market segments

Chart on Application - Market share 2025-2030 (%)
Data Table on Application - Market share 2025-2030 (%)

10.2 Comparison by Application

Chart on Comparison by Application
Data Table on Comparison by Application

10.3 Production tracking - Market size and forecast 2025-2030

Chart on Production tracking - Market size and forecast 2025-2030 ($ million)
Data Table on Production tracking - Market size and forecast 2025-2030 ($ million)
Chart on Production tracking - Year-over-year growth 2025-2030 (%)
Data Table on Production tracking - Year-over-year growth 2025-2030 (%)

10.4 Assembly - Market size and forecast 2025-2030

Chart on Assembly - Market size and forecast 2025-2030 ($ million)
Data Table on Assembly - Market size and forecast 2025-2030 ($ million)
Chart on Assembly - Year-over-year growth 2025-2030 (%)
Data Table on Assembly - Year-over-year growth 2025-2030 (%)

10.5 Machining - Market size and forecast 2025-2030

Chart on Machining - Market size and forecast 2025-2030 ($ million)
Data Table on Machining - Market size and forecast 2025-2030 ($ million)
Chart on Machining - Year-over-year growth 2025-2030 (%)
Data Table on Machining - Year-over-year growth 2025-2030 (%)

10.6 Market opportunity by Application

Market opportunity by Application ($ million)
Data Table on Market opportunity by Application ($ million)

11. Customer Landscape

11.1 Customer landscape overview

Analysis of price sensitivity, lifecycle, customer purchase basket, adoption rates, and purchase criteria

12. Geographic Landscape

12.1 Geographic segmentation

Chart on Market share by geography 2025-2030 (%)
Data Table on Market share by geography 2025-2030 (%)

12.2 Geographic comparison

Chart on Geographic comparison
Data Table on Geographic comparison

12.3 North America - Market size and forecast 2025-2030

Chart on North America - Market size and forecast 2025-2030 ($ million)
Data Table on North America - Market size and forecast 2025-2030 ($ million)
Chart on North America - Year-over-year growth 2025-2030 (%)
Data Table on North America - Year-over-year growth 2025-2030 (%)
Chart on Regional Comparison - North America
Data Table on Regional Comparison - North America

12.3.1 US - Market size and forecast 2025-2030

Chart on US - Market size and forecast 2025-2030 ($ million)
Data Table on US - Market size and forecast 2025-2030 ($ million)
Chart on US - Year-over-year growth 2025-2030 (%)
Data Table on US - Year-over-year growth 2025-2030 (%)

12.3.2 Canada - Market size and forecast 2025-2030

Chart on Canada - Market size and forecast 2025-2030 ($ million)
Data Table on Canada - Market size and forecast 2025-2030 ($ million)
Chart on Canada - Year-over-year growth 2025-2030 (%)
Data Table on Canada - Year-over-year growth 2025-2030 (%)

12.3.3 Mexico - Market size and forecast 2025-2030

Chart on Mexico - Market size and forecast 2025-2030 ($ million)
Data Table on Mexico - Market size and forecast 2025-2030 ($ million)
Chart on Mexico - Year-over-year growth 2025-2030 (%)
Data Table on Mexico - Year-over-year growth 2025-2030 (%)

12.4 APAC - Market size and forecast 2025-2030

Chart on APAC - Market size and forecast 2025-2030 ($ million)
Data Table on APAC - Market size and forecast 2025-2030 ($ million)
Chart on APAC - Year-over-year growth 2025-2030 (%)
Data Table on APAC - Year-over-year growth 2025-2030 (%)
Chart on Regional Comparison - APAC
Data Table on Regional Comparison - APAC

12.4.1 China - Market size and forecast 2025-2030

Chart on China - Market size and forecast 2025-2030 ($ million)
Data Table on China - Market size and forecast 2025-2030 ($ million)
Chart on China - Year-over-year growth 2025-2030 (%)
Data Table on China - Year-over-year growth 2025-2030 (%)

12.4.2 Japan - Market size and forecast 2025-2030

Chart on Japan - Market size and forecast 2025-2030 ($ million)
Data Table on Japan - Market size and forecast 2025-2030 ($ million)
Chart on Japan - Year-over-year growth 2025-2030 (%)
Data Table on Japan - Year-over-year growth 2025-2030 (%)

12.4.3 India - Market size and forecast 2025-2030

Chart on India - Market size and forecast 2025-2030 ($ million)
Data Table on India - Market size and forecast 2025-2030 ($ million)
Chart on India - Year-over-year growth 2025-2030 (%)
Data Table on India - Year-over-year growth 2025-2030 (%)

12.4.4 South Korea - Market size and forecast 2025-2030

Chart on South Korea - Market size and forecast 2025-2030 ($ million)
Data Table on South Korea - Market size and forecast 2025-2030 ($ million)
Chart on South Korea - Year-over-year growth 2025-2030 (%)
Data Table on South Korea - Year-over-year growth 2025-2030 (%)

12.4.5 Australia - Market size and forecast 2025-2030

Chart on Australia - Market size and forecast 2025-2030 ($ million)
Data Table on Australia - Market size and forecast 2025-2030 ($ million)
Chart on Australia - Year-over-year growth 2025-2030 (%)
Data Table on Australia - Year-over-year growth 2025-2030 (%)

12.4.6 Taiwan - Market size and forecast 2025-2030

Chart on Taiwan - Market size and forecast 2025-2030 ($ million)
Data Table on Taiwan - Market size and forecast 2025-2030 ($ million)
Chart on Taiwan - Year-over-year growth 2025-2030 (%)
Data Table on Taiwan - Year-over-year growth 2025-2030 (%)

12.5 Europe - Market size and forecast 2025-2030

Chart on Europe - Market size and forecast 2025-2030 ($ million)
Data Table on Europe - Market size and forecast 2025-2030 ($ million)
Chart on Europe - Year-over-year growth 2025-2030 (%)
Data Table on Europe - Year-over-year growth 2025-2030 (%)
Chart on Regional Comparison - Europe
Data Table on Regional Comparison - Europe

12.5.1 Germany - Market size and forecast 2025-2030

Chart on Germany - Market size and forecast 2025-2030 ($ million)
Data Table on Germany - Market size and forecast 2025-2030 ($ million)
Chart on Germany - Year-over-year growth 2025-2030 (%)
Data Table on Germany - Year-over-year growth 2025-2030 (%)

12.5.2 UK - Market size and forecast 2025-2030

Chart on UK - Market size and forecast 2025-2030 ($ million)
Data Table on UK - Market size and forecast 2025-2030 ($ million)
Chart on UK - Year-over-year growth 2025-2030 (%)
Data Table on UK - Year-over-year growth 2025-2030 (%)

12.5.3 France - Market size and forecast 2025-2030

Chart on France - Market size and forecast 2025-2030 ($ million)
Data Table on France - Market size and forecast 2025-2030 ($ million)
Chart on France - Year-over-year growth 2025-2030 (%)
Data Table on France - Year-over-year growth 2025-2030 (%)

12.5.4 Italy - Market size and forecast 2025-2030

Chart on Italy - Market size and forecast 2025-2030 ($ million)
Data Table on Italy - Market size and forecast 2025-2030 ($ million)
Chart on Italy - Year-over-year growth 2025-2030 (%)
Data Table on Italy - Year-over-year growth 2025-2030 (%)

12.5.5 Spain - Market size and forecast 2025-2030

Chart on Spain - Market size and forecast 2025-2030 ($ million)
Data Table on Spain - Market size and forecast 2025-2030 ($ million)
Chart on Spain - Year-over-year growth 2025-2030 (%)
Data Table on Spain - Year-over-year growth 2025-2030 (%)

12.5.6 The Netherlands - Market size and forecast 2025-2030

Chart on The Netherlands - Market size and forecast 2025-2030 ($ million)
Data Table on The Netherlands - Market size and forecast 2025-2030 ($ million)
Chart on The Netherlands - Year-over-year growth 2025-2030 (%)
Data Table on The Netherlands - Year-over-year growth 2025-2030 (%)

12.6 South America - Market size and forecast 2025-2030

Chart on South America - Market size and forecast 2025-2030 ($ million)
Data Table on South America - Market size and forecast 2025-2030 ($ million)
Chart on South America - Year-over-year growth 2025-2030 (%)
Data Table on South America - Year-over-year growth 2025-2030 (%)
Chart on Regional Comparison - South America
Data Table on Regional Comparison - South America

12.6.1 Brazil - Market size and forecast 2025-2030

Chart on Brazil - Market size and forecast 2025-2030 ($ million)
Data Table on Brazil - Market size and forecast 2025-2030 ($ million)
Chart on Brazil - Year-over-year growth 2025-2030 (%)
Data Table on Brazil - Year-over-year growth 2025-2030 (%)

12.6.2 Argentina - Market size and forecast 2025-2030

Chart on Argentina - Market size and forecast 2025-2030 ($ million)
Data Table on Argentina - Market size and forecast 2025-2030 ($ million)
Chart on Argentina - Year-over-year growth 2025-2030 (%)
Data Table on Argentina - Year-over-year growth 2025-2030 (%)

12.6.3 Chile - Market size and forecast 2025-2030

Chart on Chile - Market size and forecast 2025-2030 ($ million)
Data Table on Chile - Market size and forecast 2025-2030 ($ million)
Chart on Chile - Year-over-year growth 2025-2030 (%)
Data Table on Chile - Year-over-year growth 2025-2030 (%)

12.7 Middle East and Africa - Market size and forecast 2025-2030

Chart on Middle East and Africa - Market size and forecast 2025-2030 ($ million)
Data Table on Middle East and Africa - Market size and forecast 2025-2030 ($ million)
Chart on Middle East and Africa - Year-over-year growth 2025-2030 (%)
Data Table on Middle East and Africa - Year-over-year growth 2025-2030 (%)
Chart on Regional Comparison - Middle East and Africa
Data Table on Regional Comparison - Middle East and Africa

12.7.1 Saudi Arabia - Market size and forecast 2025-2030

Chart on Saudi Arabia - Market size and forecast 2025-2030 ($ million)
Data Table on Saudi Arabia - Market size and forecast 2025-2030 ($ million)
Chart on Saudi Arabia - Year-over-year growth 2025-2030 (%)
Data Table on Saudi Arabia - Year-over-year growth 2025-2030 (%)

12.7.2 UAE - Market size and forecast 2025-2030

Chart on UAE - Market size and forecast 2025-2030 ($ million)
Data Table on UAE - Market size and forecast 2025-2030 ($ million)
Chart on UAE - Year-over-year growth 2025-2030 (%)
Data Table on UAE - Year-over-year growth 2025-2030 (%)

12.7.3 South Africa - Market size and forecast 2025-2030

Chart on South Africa - Market size and forecast 2025-2030 ($ million)
Data Table on South Africa - Market size and forecast 2025-2030 ($ million)
Chart on South Africa - Year-over-year growth 2025-2030 (%)
Data Table on South Africa - Year-over-year growth 2025-2030 (%)

12.7.4 Turkey - Market size and forecast 2025-2030

Chart on Turkey - Market size and forecast 2025-2030 ($ million)
Data Table on Turkey - Market size and forecast 2025-2030 ($ million)
Chart on Turkey - Year-over-year growth 2025-2030 (%)
Data Table on Turkey - Year-over-year growth 2025-2030 (%)

12.7.5 Egypt - Market size and forecast 2025-2030

Chart on Egypt - Market size and forecast 2025-2030 ($ million)
Data Table on Egypt - Market size and forecast 2025-2030 ($ million)
Chart on Egypt - Year-over-year growth 2025-2030 (%)
Data Table on Egypt - Year-over-year growth 2025-2030 (%)

12.8 Market opportunity by geography

Market opportunity by geography ($ million)
Data Tables on Market opportunity by geography ($ million)

13. Drivers, Challenges, and Opportunity

13.1 Market drivers

Acceleration of industry 4.0 and smart manufacturing initiatives
Surging e-commerce expansion and demand for automated warehouse logistics
Heightened regulatory compliance and supply chain traceability mandates

13.2 Market challenges

High upfront infrastructure costs and uncertain return on investment timelines
Signal interference from harsh physical environments and high metallic density
Interoperability conflicts, cybersecurity vulnerabilities, and standard fragmentation

13.3 Impact of drivers and challenges

Impact of drivers and challenges in 2025 and 2030

13.4 Market opportunities

Integration of ambient IOT and battery-free sensor RFID technologies
Convergence of edge computing and autonomous fixed RFID infrastructure
Accelerated adoption of sustainable and recyclable RFID tagging solutions

14. Competitive Landscape

14.1 Overview

14.2

Overview on criticality of inputs and factors of differentiation

14.3 Landscape disruption

Overview on factors of disruption

14.4 Industry risks

Impact of key risks on business

15. Competitive Analysis

15.1 Companies profiled

Companies covered

15.2 Company ranking index

15.3 Market positioning of companies

Matrix on companies position and classification

15.4 Avery Dennison Corp.

Avery Dennison Corp. - Overview
Avery Dennison Corp. - Business segments
Avery Dennison Corp. - Key news
Avery Dennison Corp. - Key offerings
Avery Dennison Corp. - Segment focus
SWOT

15.5 Balluff GmbH

Balluff GmbH - Overview
Balluff GmbH - Product / Service
Balluff GmbH - Key offerings
SWOT

15.6 Brady Corp

Brady Corp - Overview
Brady Corp - Business segments
Brady Corp - Key offerings
Brady Corp - Segment focus
SWOT

15.7 Datalogic SpA

Datalogic SpA - Overview
Datalogic SpA - Business segments
Datalogic SpA - Key offerings
Datalogic SpA - Segment focus
SWOT

15.8 Fujitsu Ltd.

Fujitsu Ltd. - Overview
Fujitsu Ltd. - Business segments
Fujitsu Ltd. - Key offerings
Fujitsu Ltd. - Segment focus
SWOT

15.9 Hans Turck GmbH and Co. KG

Hans Turck GmbH and Co. KG - Overview
Hans Turck GmbH and Co. KG - Product / Service
Hans Turck GmbH and Co. KG - Key offerings
SWOT

15.10 HID Global Corp.

HID Global Corp. - Overview
HID Global Corp. - Product / Service
HID Global Corp. - Key offerings
SWOT

15.11 Honeywell International Inc.

Honeywell International Inc. - Overview
Honeywell International Inc. - Business segments
Honeywell International Inc. - Key news
Honeywell International Inc. - Key offerings
Honeywell International Inc. - Segment focus
SWOT

15.12 Impinj Inc.

Impinj Inc. - Overview
Impinj Inc. - Product / Service
Impinj Inc. - Key offerings
SWOT

15.13 Keyence Corp.

Keyence Corp. - Overview
Keyence Corp. - Product / Service
Keyence Corp. - Key offerings
SWOT

15.14 Murata Manufacturing Co. Ltd.

Murata Manufacturing Co. Ltd. - Overview
Murata Manufacturing Co. Ltd. - Business segments
Murata Manufacturing Co. Ltd. - Key offerings
Murata Manufacturing Co. Ltd. - Segment focus
SWOT

15.15 OMRON Corp.

OMRON Corp. - Overview
OMRON Corp. - Business segments
OMRON Corp. - Key offerings
OMRON Corp. - Segment focus
SWOT

15.16 SICK AG

SICK AG - Overview
SICK AG - Product / Service
SICK AG - Key offerings
SWOT

15.17 Siemens AG

Siemens AG - Overview
Siemens AG - Business segments
Siemens AG - Key news
Siemens AG - Key offerings
Siemens AG - Segment focus
SWOT

15.18 Zebra Technologies Corp.

Zebra Technologies Corp. - Overview
Zebra Technologies Corp. - Business segments
Zebra Technologies Corp. - Key news
Zebra Technologies Corp. - Key offerings
Zebra Technologies Corp. - Segment focus
SWOT

16. Appendix

16.1 Scope of the report

Market definition
Objectives
Notes and caveats

16.2 Inclusions and exclusions checklist

Inclusions checklist
Exclusions checklist

16.3 Currency conversion rates for US$

16.4 Research methodology

16.5 Data procurement

Information sources

16.6 Data validation

16.7 Validation techniques employed for market sizing

16.8 Data synthesis

16.9 360 degree market analysis

16.10 List of abbreviations

Research Methodology

Technavio presents a detailed picture of the market by way of study, synthesis, and summation of data from multiple sources. The analysts have presented the various facets of the market with a particular focus on identifying the key industry influencers. The data thus presented is comprehensive, reliable, and the result of extensive research, both primary and secondary.

INFORMATION SOURCES

Primary sources

  • Manufacturers and suppliers
  • Channel partners
  • Industry experts
  • Strategic decision makers

Secondary sources

  • Industry journals and periodicals
  • Government data
  • Financial reports of key industry players
  • Historical data
  • Press releases

DATA ANALYSIS

Data Synthesis

  • Collation of data
  • Estimation of key figures
  • Analysis of derived insights

Data Validation

  • Triangulation with data models
  • Reference against proprietary databases
  • Corroboration with industry experts

REPORT WRITING

Qualitative

  • Market drivers
  • Market challenges
  • Market trends
  • Five forces analysis

Quantitative

  • Market size and forecast
  • Market segmentation
  • Geographical insights
  • Competitive landscape

Interested in this report?

Get your sample now to see our research methodology and insights!

Download Now

Frequently Asked Questions

Radio Frequency Identification (Rfid) For Industrial Applications market growth will increase by USD 2967.6 million during 2026-2030.

The Radio Frequency Identification (Rfid) For Industrial Applications market is expected to grow at a CAGR of 10.8% during 2026-2030.

Radio Frequency Identification (Rfid) For Industrial Applications market is segmented by Product (RFID tags, Middleware, Passive RFID systems, Active RFID systems) Type (High frequency, Ultra-high frequency, Low frequency) Application (Production tracking, Assembly, Machining)

Alien Technology LLC, Avery Dennison Corp., Balluff GmbH, Brady Corp, Datalogic SpA, Fujitsu Ltd., Hans Turck GmbH and Co. KG, HID Global Corp., Honeywell International Inc., Identiv Inc., ifm electronic gmbh, Impinj Inc., Keyence Corp., Murata Manufacturing Co. Ltd., OMRON Corp., Pepperl and Fuchs SE, SICK AG, Siemens AG, Tageos SAS, Zebra Technologies Corp. are a few of the key vendors in the Radio Frequency Identification (Rfid) For Industrial Applications market.

North America will register the highest growth rate of 43.2% among the other regions. Therefore, the Radio Frequency Identification (Rfid) For Industrial Applications market in North America is expected to garner significant business opportunities for the vendors during the forecast period.

US, Canada, Mexico, China, Japan, India, South Korea, Australia, Taiwan, Germany, UK, France, Italy, Spain, The Netherlands, Brazil, Argentina, Chile, Saudi Arabia, UAE, South Africa, Turkey, Egypt

  • Acceleration of industry 4.0 and smart manufacturing initiatives is the driving factor this market.

The Radio Frequency Identification (Rfid) For Industrial Applications market vendors should focus on grabbing business opportunities from the Product segment as it accounted for the largest market share in the base year.
RIA - Research AI Assistant
Ask RIA
