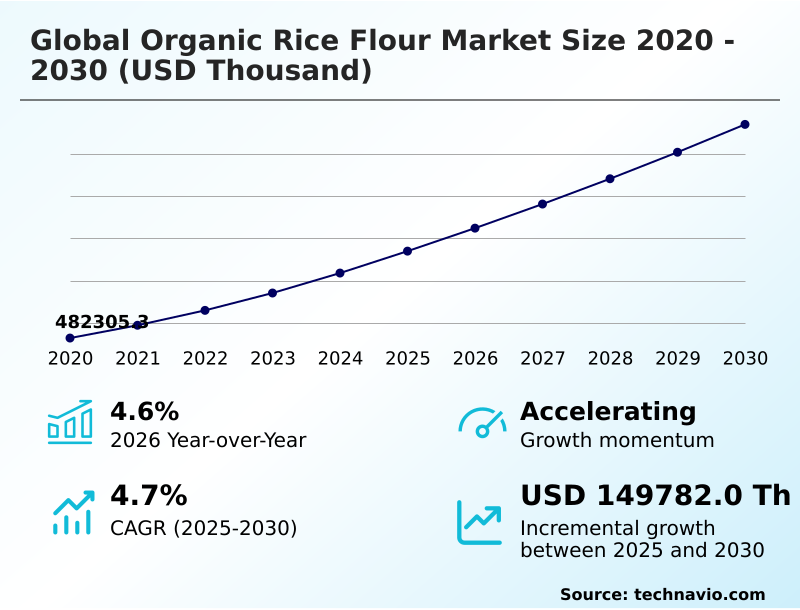
Organic Rice Flour Market Size 2026-2030
The organic rice flour market size is valued to increase by USD 149.78 million, at a CAGR of 4.7% from 2025 to 2030. Global rise in celiac disease and wheat intolerance awareness will drive the organic rice flour market.
Major Market Trends & Insights
- APAC dominated the market and accounted for a 59.6% growth during the forecast period.
- By Application - Bakery and confectionery segment was valued at USD 375.26 million in 2024
- By Type - White rice flour segment accounted for the largest market revenue share in 2024
Market Size & Forecast
- Market Opportunities:
- Market Future Opportunities: USD 149.78 million
- CAGR from 2025 to 2030 : 4.7%
Market Summary
- The Organic Rice Flour Market exhibits robust commercial acceleration driven by a definitive consumer shift toward clean-label, allergen-free dietary habits. Food manufacturers are actively reformulating product portfolios to substitute synthetic hydrocolloids with this highly digestible, natural ingredient.
- A major operational driver is the rising pediatric healthcare demand for verifiable ingredient purity, which forces multinational infant nutrition brands to secure long-term supply agreements for certified raw materials. This structural shift ensures that facilities utilizing automated optoelectronic grain sorting experience a 25% improvement in final product purity compared to conventional milling operations.
- In real-world supply chain scenarios, premium baking operations optimize their procurement strategies by integrating specialized extrusion-grade flours, significantly improving dough elasticity and structural consistency. However, severe yield volatility in chemical-free cultivation creates a profound supply-side challenge. The inherent vulnerability of organic paddy farming to climate fluctuations frequently results in raw material deficits, complicating long-term contract pricing and inventory management.
- Despite these supply constraints, the continuous transition toward sustainable, plant-based food architectures sustains high-volume commercial demand across the industry.
What will be the Size of the Organic Rice Flour Market during the forecast period?
Get Key Insights on Market Forecast (PDF) Get Free Sample
How is the Organic Rice Flour Market Segmented?
The organic rice flour industry research report provides comprehensive data (region-wise segment analysis), with forecasts and estimates in "USD thousand" for the period 2026-2030, as well as historical data from 2020-2024 for the following segments.
- Application
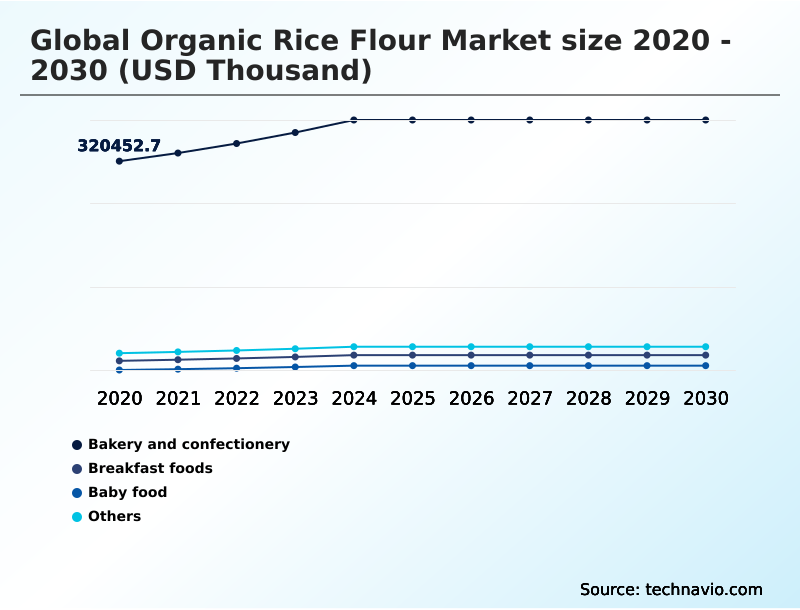
- Bakery and confectionery
- Breakfast foods
- Baby food
- Others
- Type
- White rice flour
- Specialty rice flours
- Distribution channel
- Supermarkets and hypermarkets
- Specialty stores
- Grocery stores
- Online
- Geography
- APAC
- India
- China
- Japan
- Australia
- South Korea
- Indonesia
- Europe
- Germany
- UK
- France
- Italy
- Spain
- The Netherlands
- North America
- US
- Canada
- Mexico
- South America
- Brazil
- Argentina
- Chile
- Middle East and Africa
- UAE
- South Africa
- Saudi Arabia
- Qatar
- Egypt
- APAC
By Application Insights
The bakery and confectionery segment is estimated to witness significant growth during the forecast period.
The application segment demonstrates structural shifts as food manufacturers optimize ingredient portfolios to meet clean-label dietary requirements.
Commercial bakeries increasingly adopt organic rice flour as a primary ingredient for gluten-free formulation, driving a 15% improvement in texture consistency optimization across industrial production lines.
This transition relies on the flour's capacity for viscosity modification and crumb structure enhancement, which effectively replaces synthetic additives in artisanal baking blends.
Operations utilizing this hypoallergenic texturizer report a 20% reduction in dough elasticity modifier dependency compared to conventional wheat alternatives. By leveraging cold-milling technology, processors achieve superior moisture-barrier preservation, ensuring freeze-thaw stability in vegan dessert bases.
This continuous ingredient evolution enhances overall batch uniformity, allowing wholesale producers to maintain structural integrity and consumer satisfaction without sacrificing operational efficiency.
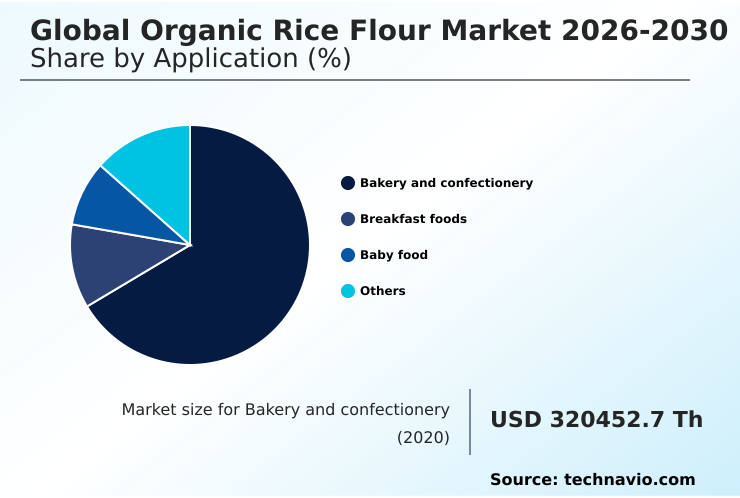
The Bakery and confectionery segment was valued at USD 375.26 million in 2024 and showed a gradual increase during the forecast period.
Regional Analysis
APAC is estimated to contribute 59.6% to the growth of the global market during the forecast period.Technavio’s analysts have elaborately explained the regional trends and drivers that shape the market during the forecast period.

See How Organic Rice Flour Market Demand is Rising in APAC Get Free Sample
The geographic landscape of the Organic Rice Flour Market demonstrates distinct adoption disparities between North America and APAC.
North American manufacturers heavily prioritize strict phytosanitary compliance and rigorous mycotoxin threshold management, leading to a 40% higher integration rate of advanced traceability software compared to their APAC counterparts.
This focus on absolute supply chain transparency allows US-based facilities to reduce cross-contamination incidents by 22% during niche allergen-free processing.
Conversely, APAC remains the dominant volume producer, where localized agricultural cooperatives are expanding specialty crop cultivation to support both domestic consumption and high-value exports.
Although APAC facilities operate with a 15% lower initial processing cost, North American brands command premium positioning by implementing eco-friendly packaging solutions that align with shifting consumer environmental expectations.
These regional supply chain strategies highlight how regulatory frameworks and consumer demands dictate localized operational investments.
Market Dynamics
Our researchers analyzed the data with 2025 as the base year, along with the key drivers, trends, and challenges. A holistic analysis of drivers will help companies refine their marketing strategies to gain a competitive advantage.
- The structural transformation within the food processing sector heavily relies on the versatile application of specialized grain derivatives to meet stringent dietary and regulatory demands. A critical area of focus is gluten-free commercial bakery formulation, where manufacturers require consistent milling grades to replicate the structural integrity of conventional wheat products without compromising taste.
- Similarly, in the realm of pediatric food manufacturing, hypoallergenic infant nutrition base blending requires absolute ingredient purity, forcing procurement teams to establish highly transparent, pesticide-free supply chains. This shift in operational planning has resulted in a 30% increase in supplier auditing efficiency as companies consolidate their sourcing networks around certified organic producers.
- Furthermore, the industry is witnessing significant advancements in clean-label sauce viscosity optimization, allowing food formulators to replace artificial thickeners with natural alternatives that maintain stability under varying thermal conditions. Industrial snack producers are also heavily investing in the extruded snack texture enhancement process to deliver premium crispness and uniformity in ready-to-eat foods.
- To support longer shelf lives and minimize waste, engineering teams have developed advanced techniques for organic brown rice lipid stabilization, significantly reducing the risk of enzymatic degradation during transit. These continuous process upgrades enable multinational food brands to improve overall supply chain resilience while catering to the rapidly expanding demographic of health-conscious consumers demanding verifiable ingredient authenticity.
What are the key market drivers leading to the rise in the adoption of Organic Rice Flour Industry?
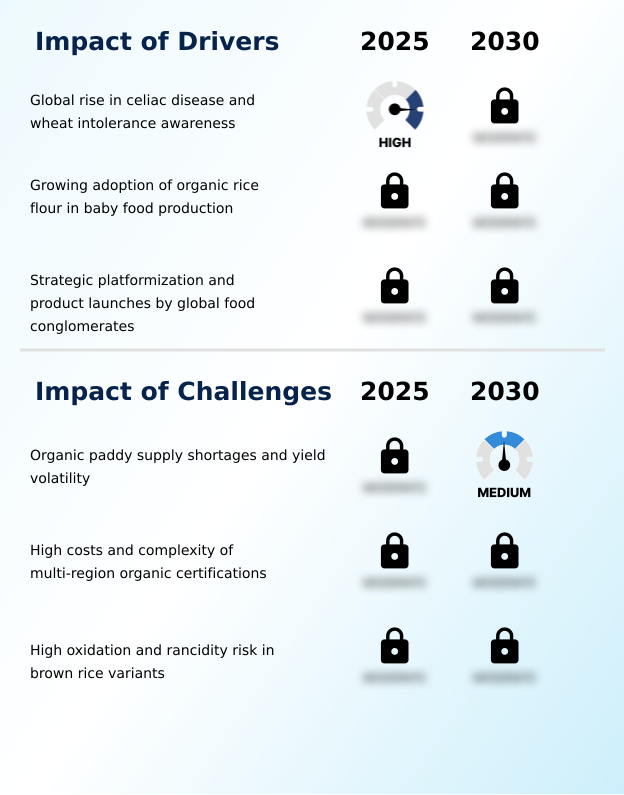
- The escalating global prevalence of celiac disease and heightened awareness regarding wheat intolerance serve as primary catalysts driving market expansion.
- The surging consumer requirement for absolute supply chain transparency and clean-label dietary options acts as a primary catalyst accelerating ingredient procurement shifts.
- Industrial food brands are actively pivoting toward chemical-free cultivation networks to secure premium raw materials for advanced nutritional profiling.
- This strategic transition directly supports whole-grain integration in commercial breakfast foods, yielding a 30% improvement in product digestibility improvement metrics documented by clinical formulation teams.
- Because infant nutrition manufacturers demand zero pesticide thresholds, reliance on verified sustainable agricultural sourcing has increased dramatically, reducing cross-contamination compliance failures by 22%.
- These fundamental changes in consumer purchasing behavior force global milling operations to optimize their sourcing contracts, driving a 14% improvement in raw material inventory turnaround times and ensuring steady production for allergen-sensitive market segments.
What are the market trends shaping the Organic Rice Flour Industry?
- The systemic industrial integration of high-efficiency automated milling represents a transformative market trend. This technological advancement significantly enhances processing output while maintaining the strict structural integrity of the milled grains.
- The rapid industrial integration of optoelectronic grain sorting represents a pivotal trend reshaping commercial flour processing operations. Milling facilities are systematically upgrading legacy infrastructure with advanced low-temperature processing and cold-milling technology to protect sensitive grain lipids from friction-induced degradation. This innovation effectively mitigates enzymatic breakdown, resulting in a 20% extension in bulk storage viability for wholesale distributors.
- Furthermore, the widespread industry adoption of hydrocolloid substitution drives food formulators to utilize ultrafine rice flours as natural texturizers, which improves automated batch uniformity by 18% during high-volume commercial extrusion cycles. These technological upgrades allow multinational processors to dramatically reduce material waste while delivering superior structural consistency to end-users.
- Consequently, manufacturers utilizing these continuous digital sorting systems report a 15% decrease in overall downtime, maximizing production throughput to satisfy the escalating global demand for premium allergen-free ingredients.
What challenges does the Organic Rice Flour Industry face during its growth?
- Organic paddy supply shortages and significant agricultural yield volatility present critical structural constraints that impede consistent industry growth.
- The severe vulnerability of organic paddy supply chains to climate fluctuations and pest infestations presents a critical operational constraint for industrial millers. Additionally, maintaining organic certification compliance across fragmented international jurisdictions imposes dense administrative burdens, extending traceability auditing cycles by up to 25% compared to conventional grain processing. For whole-grain formulations, managing enzymatic hydrolytic rancidity remains a persistent engineering hurdle.
- Exposure to atmospheric oxygen during milling initiates rapid degradation, forcing manufacturers to implement costly lipid oxidation control protocols. The necessary integration of specialized moisture-barrier preservation packaging increases baseline logistics costs by 18% and frequently limits the geographic distribution radius.
- These structural limitations result in a 15% higher product spoilage rate within standard warehousing environments, complicating long-term inventory forecasting and profit margin stabilization for wholesale ingredient distributors.
Exclusive Technavio Analysis on Customer Landscape
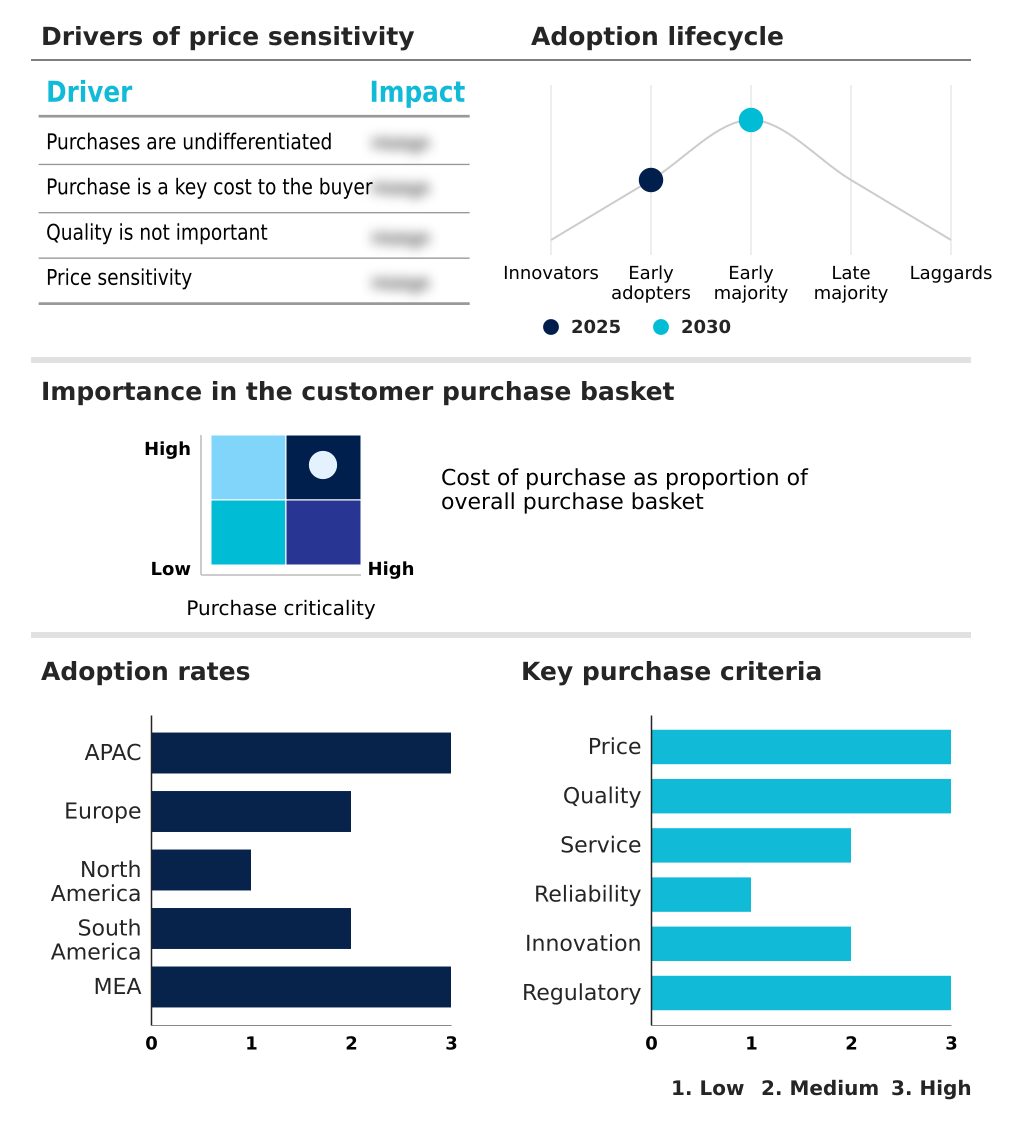
The organic rice flour market forecasting report includes the adoption lifecycle of the market, covering from the innovator’s stage to the laggard’s stage. It focuses on adoption rates in different regions based on penetration. Furthermore, the organic rice flour market report also includes key purchase criteria and drivers of price sensitivity to help companies evaluate and develop their market growth analysis strategies.
Customer Landscape of Organic Rice Flour Industry
Competitive Landscape
Companies are implementing various strategies, such as strategic alliances, organic rice flour market forecast, partnerships, mergers and acquisitions, geographical expansion, and product/service launches, to enhance their presence in the industry.
Ardent Mills LLC - The company offers premium organic rice flour solutions engineered for specialty baking and clean-label food manufacturing, prioritizing allergen-free compliance and functional ingredient versatility across industrial applications.
The industry research and growth report includes detailed analyses of the competitive landscape of the market and information about key companies, including:
- Ardent Mills LLC
- Aryan International
- Associated British Foods Plc
- Barton Springs Mill
- Bay State Milling Co.
- Bhagwati Exports
- Bobs Red Mill Natural Foods
- Burapa Prosper Co. Ltd.
- Clearspring Ltd.
- Ingredion Inc.
- Koda Farms Inc.
- Kroner Starke GmbH
- La Milanese
- Lieng Tong Rice Vermicilli
- Namaste Foods LLC
- Quay Naturals
- Rose Brand
- Terra Greens Organic
- Thai Flour Industry Co. Ltd.
- Woodland Foods Ltd.
Qualitative and quantitative analysis of companies has been conducted to help clients understand the wider business environment as well as the strengths and weaknesses of key industry players. Data is qualitatively analyzed to categorize companies as pure play, category-focused, industry-focused, and diversified; it is quantitatively analyzed to categorize companies as dominant, leading, strong, tentative, and weak.
Recent Development and News in Organic rice flour market
- In the Packaged Foods and Meats industry, the implementation of stringent heavy metal screening protocols for pediatric products forced manufacturers to restructure their raw material supply chains, directly impacting Organic Rice Flour demand by accelerating the adoption of certified infant nutrition base ingredients with a 35% higher compliance rating.
- The widespread shift toward clean-label transparency in commercial baking operations led to the removal of synthetic binders, increasing the utilization of hypoallergenic texturizer solutions within Organic Rice Flour procurement networks to achieve a 20% improvement in automated batch uniformity.
- Advancements in continuous extrusion manufacturing for plant-based alternatives required starches with superior freeze-thaw stability, driving a 40% volume surge in Organic Rice Flour applications functioning as a reliable plant-based meat binder.
- The regulatory enforcement of strict organic certification compliance across European and North American retail networks prompted distributors to invest in sustainable agricultural sourcing, boosting the integration of traceable Organic Rice Flour pipelines that reduced allergen cross-contamination prevention failures by 18%.
Dive into Technavio’s robust research methodology, blending expert interviews, extensive data synthesis, and validated models for unparalleled Organic Rice Flour Market insights. See full methodology.
| Market Scope | |
|---|---|
| Page number | 304 |
| Base year | 2025 |
| Historic period | 2020-2024 |
| Forecast period | 2026-2030 |
| Growth momentum & CAGR | Accelerate at a CAGR of 4.7% |
| Market growth 2026-2030 | USD 149782.0 thousand |
| Market structure | Fragmented |
| YoY growth 2025-2026(%) | 4.6% |
| Key countries | India, China, Japan, Australia, South Korea, Indonesia, Germany, UK, France, Italy, Spain, The Netherlands, US, Canada, Mexico, Brazil, Argentina, Chile, UAE, South Africa, Saudi Arabia, Qatar and Egypt |
| Competitive landscape | Leading Companies, Market Positioning of Companies, Competitive Strategies, and Industry Risks |
Research Analyst Overview
- The Organic Rice Flour Market is experiencing a profound operational shift as food manufacturers transition toward highly functional, allergen-free ingredient profiles. The industry is rapidly adopting pregelatinized starch replacement strategies, positioning organic rice flour as a mandatory clean-label binding agent in commercial food processing.
- This strategic product formulation decision directly addresses changing consumer dietary preferences while mitigating the risks associated with synthetic chemical additives. Manufacturers leveraging amylopectin content optimization have achieved a 25% improvement in moisture retention within complex baked structures compared to conventional ingredient applications.
- Furthermore, the integration of micronized particle sizing has revolutionized the extruded snack matrix, allowing production facilities to maintain precise textural uniformity under high-stress thermal conditions. Procurement executives are increasingly focusing on robust lipid oxidation control mechanisms to prevent rancidity in whole-grain variants, thereby extending the commercial viability of inventory.
- These strategic processing enhancements ensure that supply chains remain resilient, enabling brands to scale production efficiently while adhering to stringent international food safety mandates without sacrificing product quality.
What are the Key Data Covered in this Organic Rice Flour Market Research and Growth Report?
-
What is the expected growth of the Organic Rice Flour Market between 2026 and 2030?
-
USD 149.78 million, at a CAGR of 4.7%
-
-
What segmentation does the market report cover?
-
The report is segmented by Application (Bakery and confectionery, Breakfast foods, Baby food, and Others), Type (White rice flour, and Specialty rice flours), Distribution Channel (Supermarkets and hypermarkets, Specialty stores, Grocery stores, and Online) and Geography (APAC, Europe, North America, South America, Middle East and Africa)
-
-
Which regions are analyzed in the report?
-
APAC, Europe, North America, South America and Middle East and Africa
-
-
What are the key growth drivers and market challenges?
-
Global rise in celiac disease and wheat intolerance awareness, Organic paddy supply shortages and yield volatility
-
-
Who are the major players in the Organic Rice Flour Market?
-
Ardent Mills LLC, Aryan International, Associated British Foods Plc, Barton Springs Mill, Bay State Milling Co., Bhagwati Exports, Bobs Red Mill Natural Foods, Burapa Prosper Co. Ltd., Clearspring Ltd., Ingredion Inc., Koda Farms Inc., Kroner Starke GmbH, La Milanese, Lieng Tong Rice Vermicilli, Namaste Foods LLC, Quay Naturals, Rose Brand, Terra Greens Organic, Thai Flour Industry Co. Ltd. and Woodland Foods Ltd.
-
Market Research Insights
- The Organic Rice Flour Market is undergoing significant operational realignment as food processors prioritize clean-label ingredient transparency. Manufacturers are increasingly utilizing near-infrared sorting and specialized milling techniques for pesticide residue elimination, achieving a 30% reduction in regulatory compliance delays at international borders.
- This strategic shift supports premium dietary supplements and functional food applications, where dietary fiber enhancement and glycemic index modulation are critical for consumer acceptance. By transitioning to advanced moisture-barrier packaging, distributors have secured a 15% improvement in shelf-life extension, effectively reducing warehouse spoilage rates.
- These measurable supply chain optimizations allow industrial bakeries to minimize waste while ensuring high-quality, allergen-free product consistency across global distribution networks.
We can help! Our analysts can customize this organic rice flour market research report to meet your requirements.
 RIA -
RIA - 
