
Ricinoleic Acid Market Size 2026-2030
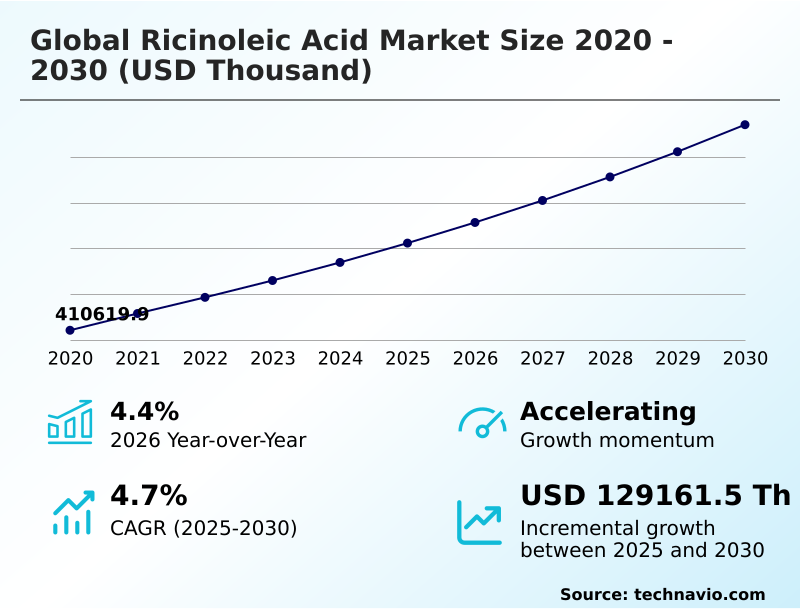
The ricinoleic acid market size is valued to increase by USD 129.16 million, at a CAGR of 4.7% from 2025 to 2030. Rising demand from major end-user will drive the ricinoleic acid market.
Major Market Trends & Insights
- APAC dominated the market and accounted for a 58.3% growth during the forecast period.
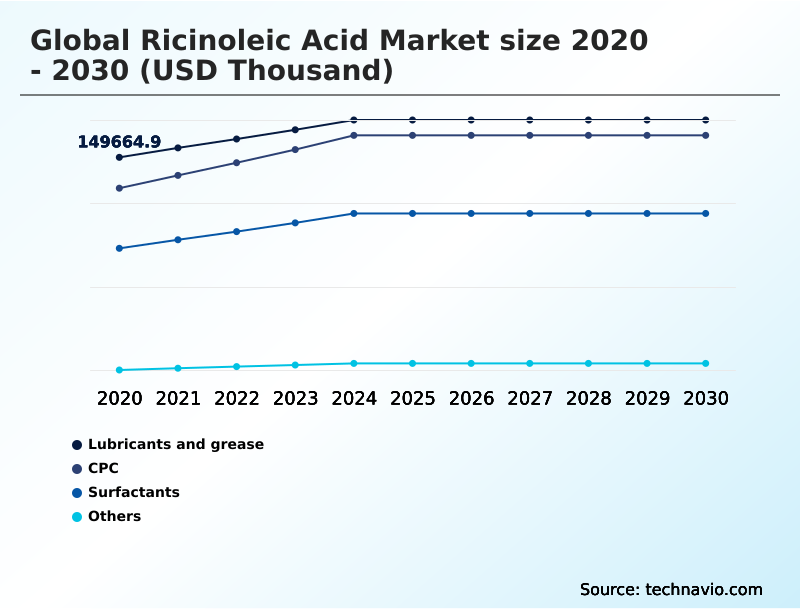
- By End-user - Lubricants and grease segment was valued at USD 170.65 million in 2024
- By Type - Industrial-grade segment accounted for the largest market revenue share in 2024
Market Size & Forecast
- Market Opportunities:
- Market Future Opportunities: USD 129.16 million
- CAGR from 2025 to 2030 : 4.7%
Market Summary
- The ricinoleic acid market is defined by its role as a critical green chemistry intermediate derived from castor oil hydrolysis. This hydroxylated fatty acid is integral to producing a wide range of oleochemical derivatives, including bio-based lubricants, cosmetic-grade ricinoleic acid for personal care, and high-purity fatty acids for pharmaceutical excipients.
- Market dynamics are shaped by the increasing industrial demand for sustainable alternatives to petroleum-based products. A key driver is the compound's versatile functionality, including its emollient properties and utility in creating biocompatible polymers and non-ionic surfactants.
- For instance, in the automotive sector, manufacturers are reformulating greases with ricinoleic acid esters to improve thermal stability and biodegradability, meeting stricter environmental standards without compromising performance. However, the industry grapples with supply chain vulnerabilities tied to castor seed harvesting.
- This creates a complex landscape where innovation in synthetic esterification and castor oil splitting processes is crucial for stabilizing supply and expanding applications in areas like controlled drug delivery and the synthesis of sebacic acid precursors.
What will be the Size of the Ricinoleic Acid Market during the forecast period?
Get Key Insights on Market Forecast (PDF) Get Free Sample
How is the Ricinoleic Acid Market Segmented?
The ricinoleic acid industry research report provides comprehensive data (region-wise segment analysis), with forecasts and estimates in "USD thousand" for the period 2026-2030, as well as historical data from 2020-2024 for the following segments.
- End-user
- Lubricants and grease
- CPC
- Surfactants
- Others
- Type
- Industrial-grade
- Optimal grade
- Source
- Castor oil
- Synthetic esterification
- Form factor
- Liquid
- Solid
- Geography
- APAC
- China
- Japan
- India
- Europe
- Germany
- UK
- France
- North America
- US
- Canada
- Mexico
- Middle East and Africa
- Saudi Arabia
- UAE
- South Africa
- South America
- Brazil
- Argentina
- Rest of World (ROW)
- APAC
By End-user Insights
The lubricants and grease segment is estimated to witness significant growth during the forecast period.
The lubricants and grease segment is driven by the adoption of bio-based lubricants and high-performance lubricant formulation. Formulations using ricinoleic acid esters and other oleochemical derivatives offer superior thermal stability, making them critical for heavy-duty industrial greases.
The use of this hydroxylated fatty acid as a lubricity enhancement agent is expanding, as industries shift toward eco-friendly industrial fluids to align with sustainability goals.
This transition to materials with a high viscosity index and plant-derived emollients supports a more sustainable oleochemical value chain.
These advanced lubricants can improve equipment efficiency by 5%, directly impacting operational costs and meeting the demand for reduced carbon footprint materials through responsible raw material sourcing.
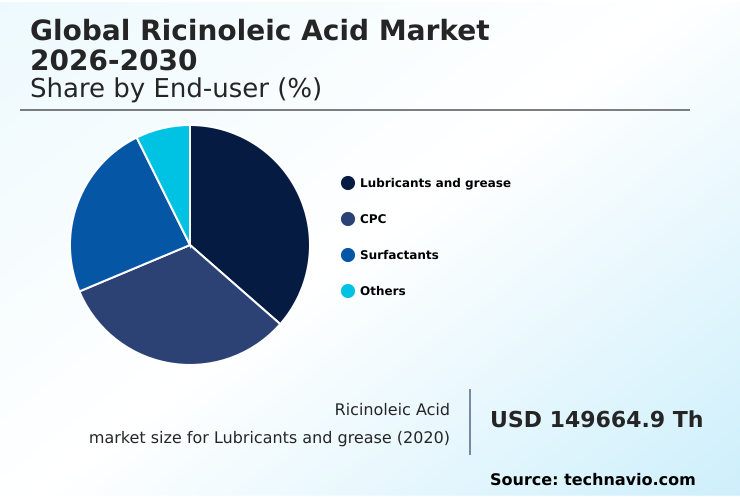
The Lubricants and grease segment was valued at USD 170.65 million in 2024 and showed a gradual increase during the forecast period.
Regional Analysis
APAC is estimated to contribute 58.3% to the growth of the global market during the forecast period.Technavio’s analysts have elaborately explained the regional trends and drivers that shape the market during the forecast period.

See How Ricinoleic Acid Market Demand is Rising in APAC Get Free Sample
The geographic landscape is dominated by APAC, which accounts for 58.3% of the incremental growth opportunity, making it a focal point for renewable feedstock integration and specialty chemical synthesis.
This region's leadership is built on extensive castor cultivation, enabling large-scale castor oil splitting and the production of industrial-grade castor derivatives.
The region's growth rate is approximately 20% faster than that of North America, driven by strong demand for biocompatible medical devices and cosmetic applications.
In contrast, Europe and North America focus on high-value applications, such as pharmaceutical excipients and specialty esters, leveraging advanced technologies for synthetic esterification and creating water-resistant coating formulations.
The global distribution network reflects a dynamic where raw material production is concentrated, while consumption of high-purity fatty acids is more widespread.
Market Dynamics
Our researchers analyzed the data with 2025 as the base year, along with the key drivers, trends, and challenges. A holistic analysis of drivers will help companies refine their marketing strategies to gain a competitive advantage.
- The global ricinoleic acid market is navigating a complex landscape defined by the need for sustainable sourcing of castor oil and advanced process optimization. The applications of hydrogenated castor oil continue to expand, particularly in creating durable industrial products. For high-value sectors, the focus is on developing high-purity ricinoleic acid for cosmetics, where its skin moisturization properties are highly valued.
- A significant portion of the market is dedicated to using ricinoleic acid as a chemical intermediate for undecylenic acid synthesis from ricinoleic acid and for nylon-11 synthesis. In industrial applications, formulating with ricinoleic acid esters is key for creating bio-based lubricants for the automotive industry with enhanced thermal stability in lubricant formulations.
- The production of biodegradable surfactants from ricinoleic acid and its use in specialty coatings are growing segments. However, the industry must address the environmental impact of castor cultivation and the price volatility of castor seeds. Regulatory standards for cosmetic ingredients are also becoming more stringent, pushing for innovation.
- Castor oil hydrolysis process optimization and the development of industrial-grade castor oil derivatives are critical for cost management. Meanwhile, ricinoleic acid in polyurethane production and dehydrated castor oil in alkyd resins represent stable end-use markets.
- Companies with integrated supply chains have demonstrated an ability to reduce raw material acquisition costs by over 15% compared to those reliant on spot markets, showcasing a clear operational advantage.
What are the key market drivers leading to the rise in the adoption of Ricinoleic Acid Industry?
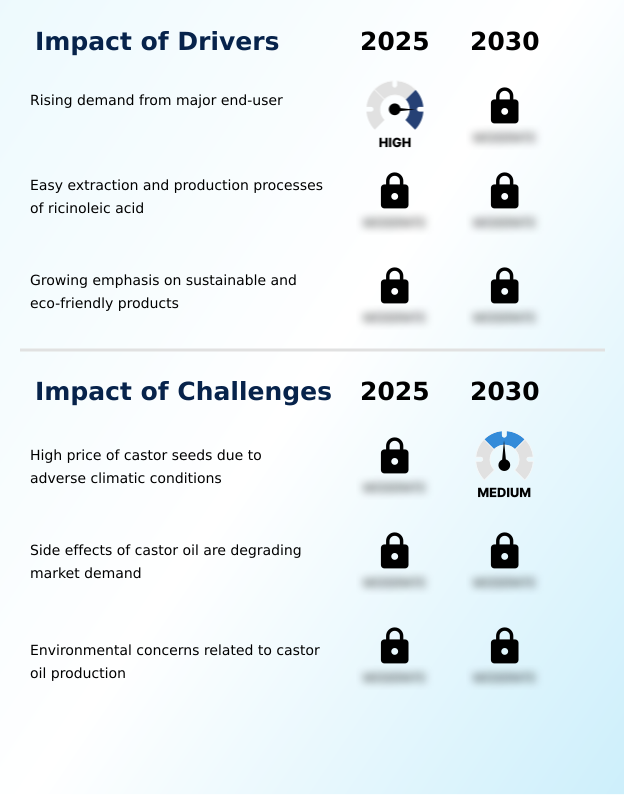
- The rising demand from major end-user industries, including lubricants, cosmetics, pharmaceuticals, and surfactants, serves as a key driver for the market.
- The primary driver for the market is the expanding demand from end-users seeking sustainable alternatives, such as petroleum-free chemical alternatives and materials for skin-friendly cosmetic formulations.
- The exceptional performance of ricinoleic acid, with its inherent lubricity enhancement capabilities, makes it a preferred choice. For instance, the transition to bio-based lubricants can extend equipment lifespan by up to 10% in high-stress industrial settings.
- This demand is further supported by the compound's utility in manufacturing biodegradable surface-active agents and its role as a sebacic acid precursor.
- The simplified production pathway, including castor oil splitting, contributes to its commercial viability, enabling manufacturers to scale production 20% faster than with complex synthetic routes.
What are the market trends shaping the Ricinoleic Acid Industry?
- A significant market trend is the growing shift toward bio-based chemicals. This transition is driven by increased environmental awareness, regulatory pressure, and the need to reduce dependence on petroleum-based raw materials.
- A primary trend shaping the market is the accelerated adoption of green chemistry applications and adherence to circular economy principles. Industries are increasingly demanding bio-based polymer intermediates and plant-based therapeutic formulations, which has amplified the need for innovation in undecylenic acid production and the creation of materials for anti-inflammatory preparations.
- This shift is driven by consumer demand for products with natural ingredient positioning, leading to a 25% increase in R&D spending on sustainable chemical solutions over the last three years.
- The use of ricinoleic acid, a key green chemistry intermediate, in food-grade lubricant applications has also grown as manufacturers seek to meet stricter safety and environmental regulations, improving compliance rates by over 15%.
What challenges does the Ricinoleic Acid Industry face during its growth?
- The high price and price volatility of castor seeds, resulting from adverse climatic conditions, present a key challenge affecting industry growth and supply chain stability.
- A significant challenge confronting the market is the dependency on agricultural outputs, making it vulnerable to supply chain diversification issues and raw material price fluctuations. Adverse weather can cause castor seed prices to surge by as much as 30% in a single season, directly eroding profit margins for producers of industrial-grade castor derivatives.
- This volatility also affects the cost structure of downstream products, including heavy-duty industrial greases and specialty chemical synthesis. Furthermore, environmental concerns associated with large-scale sustainable agriculture practices are prompting calls for more responsible raw material sourcing. Manufacturers are responding by investing in technologies that improve yield from castor oil hydrolysis by up to 8%, mitigating some of the cost pressures.
Exclusive Technavio Analysis on Customer Landscape
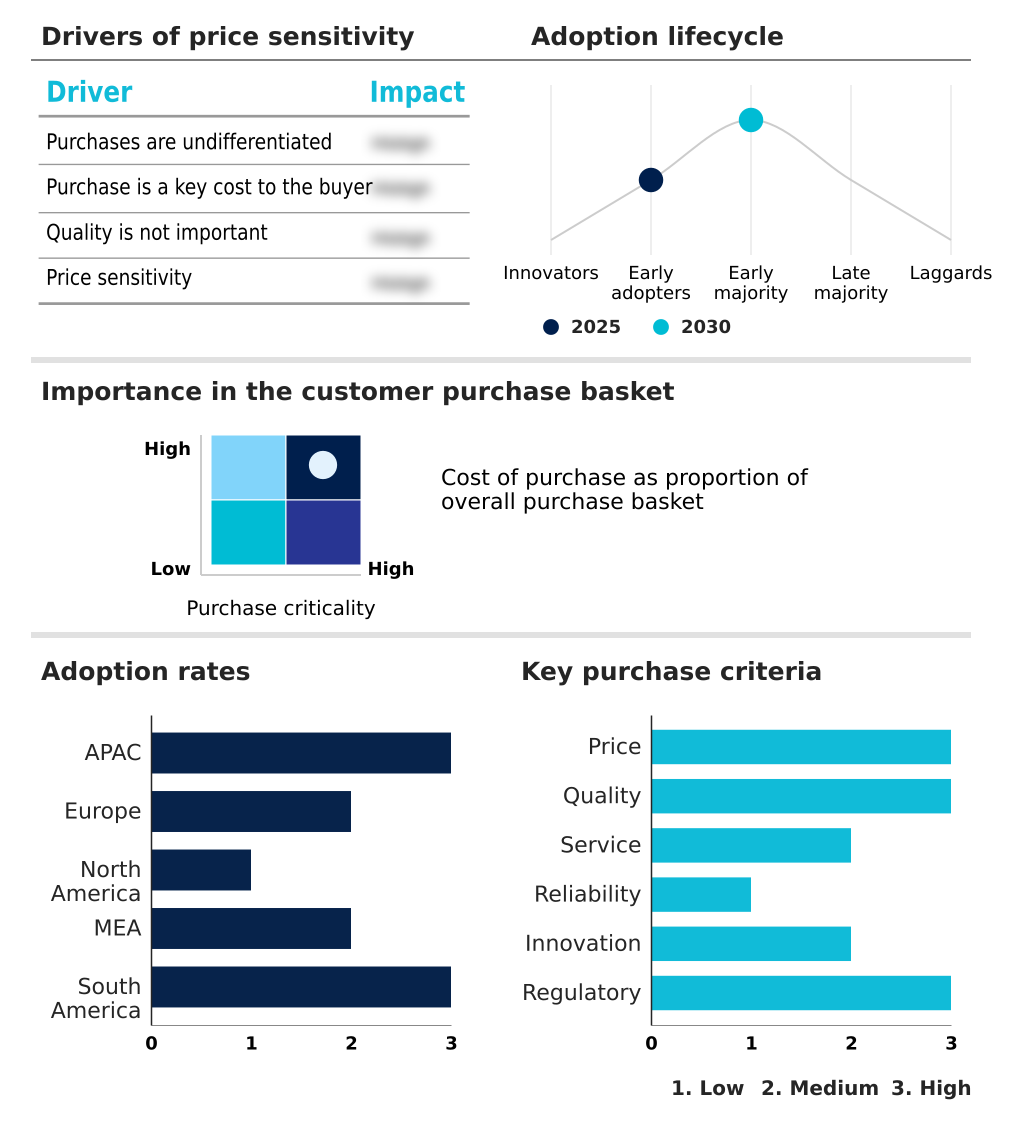
The ricinoleic acid market forecasting report includes the adoption lifecycle of the market, covering from the innovator’s stage to the laggard’s stage. It focuses on adoption rates in different regions based on penetration. Furthermore, the ricinoleic acid market report also includes key purchase criteria and drivers of price sensitivity to help companies evaluate and develop their market growth analysis strategies.
Customer Landscape of Ricinoleic Acid Industry
Competitive Landscape
Companies are implementing various strategies, such as strategic alliances, ricinoleic acid market forecast, partnerships, mergers and acquisitions, geographical expansion, and product/service launches, to enhance their presence in the industry.
Acme Synthetic Chemicals - Offerings include high-purity oleochemical derivatives and bio-based intermediates, enabling the development of specialty polyamides and advanced polymers for diverse industrial applications.
The industry research and growth report includes detailed analyses of the competitive landscape of the market and information about key companies, including:
- Acme Synthetic Chemicals
- Adani Wilmar Ltd.
- Ambuja Solvex Pvt. Ltd.
- Arkema Group
- BASF SE
- BOM Brazil Oil and Minerals
- Girnar Industries
- Hokoku Corp.
- ITOH OIL CHEMICALS CO. LTD.
- Jayant Agro Organics Ltd.
- JX Global Spice Pvt Ltd
- Kanak Castor Products Pvt Ltd
- KN Biosciences India Pvt Ltd
- Merck KGaA
- Parshva Chemicals
- Royal Castor Products Ltd
- Shreeji Expeller Industries
- Thai Ricinoleic Industry Co Ltd
- Tokyo Chemical Industry Co.
- VVF Ltd.
Qualitative and quantitative analysis of companies has been conducted to help clients understand the wider business environment as well as the strengths and weaknesses of key industry players. Data is qualitatively analyzed to categorize companies as pure play, category-focused, industry-focused, and diversified; it is quantitatively analyzed to categorize companies as dominant, leading, strong, tentative, and weak.
Recent Development and News in Ricinoleic acid market
- In October 2024, a major oleochemical producer announced a strategic partnership to secure castor seed supply chains, aiming to mitigate raw material price volatility and ensure a consistent supply for downstream industries.
- In March 2025, Arkema highlighted its bio-based polyamide and lubricant intermediate solutions derived from castor oil value chains, reinforcing the growing industrial importance of ricinoleic acid-based derivatives in sustainable systems.
- In April 2025, Croda International expanded its bio-based industrial chemical production capabilities, including castor oil-derived intermediates used in lubricant and surfactant applications.
- In May 2025, Emery Oleochemicals expanded its bio-based fatty acid production capabilities using renewable castor oil feedstock, reinforcing the growing reliance on castor oil as a sustainable source for ricinoleic acid.
Dive into Technavio’s robust research methodology, blending expert interviews, extensive data synthesis, and validated models for unparalleled Ricinoleic Acid Market insights. See full methodology.
| Market Scope | |
|---|---|
| Page number | 315 |
| Base year | 2025 |
| Historic period | 2020-2024 |
| Forecast period | 2026-2030 |
| Growth momentum & CAGR | Accelerate at a CAGR of 4.7% |
| Market growth 2026-2030 | USD 129161.5 thousand |
| Market structure | Fragmented |
| YoY growth 2025-2026(%) | 4.4% |
| Key countries | China, Japan, India, South Korea, Australia, Indonesia, Germany, UK, France, Italy, Spain, The Netherlands, US, Canada, Mexico, Saudi Arabia, UAE, South Africa, Israel, Turkey, Brazil, Argentina and Chile |
| Competitive landscape | Leading Companies, Market Positioning of Companies, Competitive Strategies, and Industry Risks |
Research Analyst Overview
- The market's trajectory is firmly linked to the adoption of green chemistry principles, where ricinoleic acid, a unique monounsaturated omega-9 fatty acid, serves as a cornerstone. Its role as a biodegradable feedstock is pivotal for producing a range of oleochemical derivatives, from bio-based plasticizers to specialty polyamides.
- The functionality of this hydroxylated fatty acid is leveraged in applications requiring specific emollient properties, such as cosmetic grade ricinoleic acid. Boardroom decisions are increasingly influenced by ESG metrics, compelling a shift toward renewable chemical feedstock and away from petroleum-based materials.
- For example, utilizing bio-based lubricants formulated with ricinoleic acid esters can reduce a company's reportable carbon footprint by up to 30% in certain heavy machinery applications. This shift necessitates advancements in processes like castor oil hydrolysis and synthetic esterification to produce high-purity fatty acids, including 12-hydroxy stearic acid and its hydrogenated castor oil variants.
- The compound's amphiphilic structure is also essential for developing non-ionic surfactants and coating additives, while its application in controlled drug delivery and as a sebacic acid precursor for biocompatible polymers highlights its versatility. Ultimately, innovation in producing dehydrated castor oil, specialty esters, and bio-based polyols is critical for sustained relevance.
What are the Key Data Covered in this Ricinoleic Acid Market Research and Growth Report?
-
What is the expected growth of the Ricinoleic Acid Market between 2026 and 2030?
-
USD 129.16 million, at a CAGR of 4.7%
-
-
What segmentation does the market report cover?
-
The report is segmented by End-user (Lubricants and grease, CPC, Surfactants, and Others), Type (Industrial-grade, and Optimal grade), Source (Castor oil, and Synthetic esterification), Form Factor (Liquid, and Solid) and Geography (APAC, Europe, North America, Middle East and Africa, South America)
-
-
Which regions are analyzed in the report?
-
APAC, Europe, North America, Middle East and Africa and South America
-
-
What are the key growth drivers and market challenges?
-
Rising demand from major end-user, High price of castor seeds due to adverse climatic conditions
-
-
Who are the major players in the Ricinoleic Acid Market?
-
Acme Synthetic Chemicals, Adani Wilmar Ltd., Ambuja Solvex Pvt. Ltd., Arkema Group, BASF SE, BOM Brazil Oil and Minerals, Girnar Industries, Hokoku Corp., ITOH OIL CHEMICALS CO. LTD., Jayant Agro Organics Ltd., JX Global Spice Pvt Ltd, Kanak Castor Products Pvt Ltd, KN Biosciences India Pvt Ltd, Merck KGaA, Parshva Chemicals, Royal Castor Products Ltd, Shreeji Expeller Industries, Thai Ricinoleic Industry Co Ltd, Tokyo Chemical Industry Co. and VVF Ltd.
-
Market Research Insights
- Market dynamics are increasingly influenced by a strategic pivot toward a sustainable oleochemical value chain, where the adoption of renewable raw material sourcing is paramount. Companies leveraging advanced purification processes are achieving a 15% improvement in yield for high-specification bio-based materials, directly impacting profitability.
- This shift is particularly evident in applications requiring clean-label beauty ingredients and plant-based therapeutic formulations, where product differentiation is key. The integration of life-cycle sustainability performance metrics has become standard, with leading firms demonstrating a 20% reduction in environmental impact through optimized manufacturing.
- This focus on eco-friendly solutions provides a competitive advantage in a market where buyers are increasingly prioritizing sustainability alongside performance.
We can help! Our analysts can customize this ricinoleic acid market research report to meet your requirements.
 RIA -
RIA - 
