Rugged Smartphone Market Analysis, Size, and Forecast 2026-2030: North America (US, Canada, and Mexico), Europe (Germany, UK, and France), APAC (China, India, and Japan), South America (Brazil and Argentina), Middle East and Africa (Saudi Arabia, UAE, and South Africa), and Rest of World (ROW)

Rugged Smartphone Market Analysis, Size, and Forecast 2026-2030:
North America (US, Canada, and Mexico), Europe (Germany, UK, and France), APAC (China, India, and Japan), South America (Brazil and Argentina), Middle East and Africa (Saudi Arabia, UAE, and South Africa), and Rest of World (ROW)

Published: May 2026 293 Pages SKU: IRTNTR75156

Market Overview at a Glance

$313.4 Mn
Market Opportunity
4.5%
CAGR 2025 - 2030
40.3%
North America Growth
$590.8 Mn
Semi-rugged segment 2024

Rugged Smartphone Market Size 2026-2030

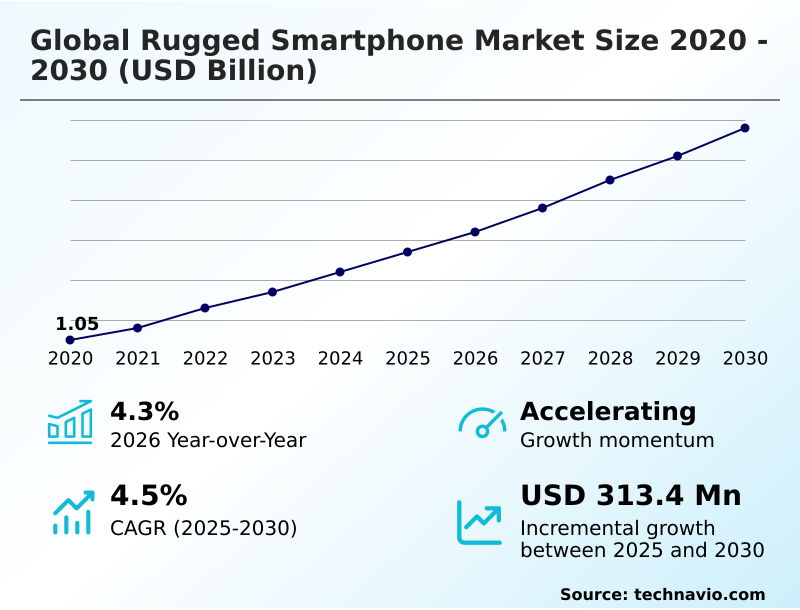
The Rugged Smartphone Market size was valued at USD 1.27 billion in 2025, growing at a CAGR of 4.5% during the forecast period 2026-2030.

Major Market Trends & Insights

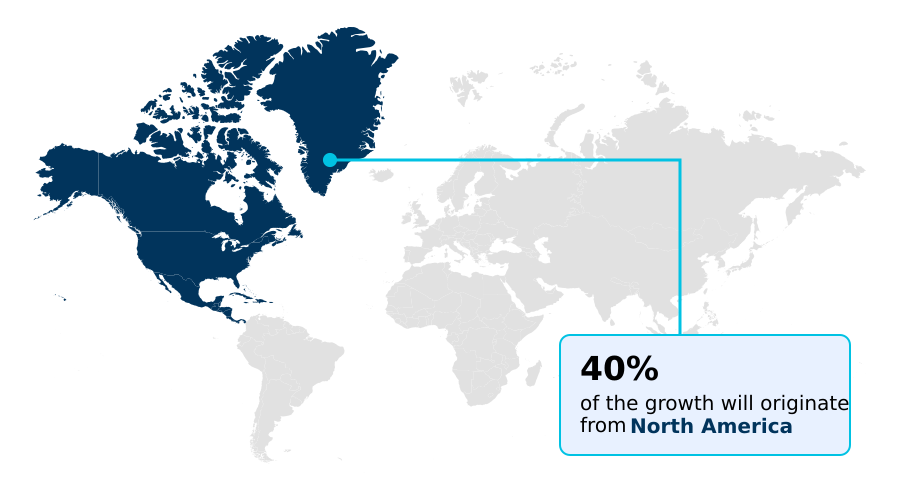
  • North America dominated the market and accounted for a 40.3% growth during the forecast period.
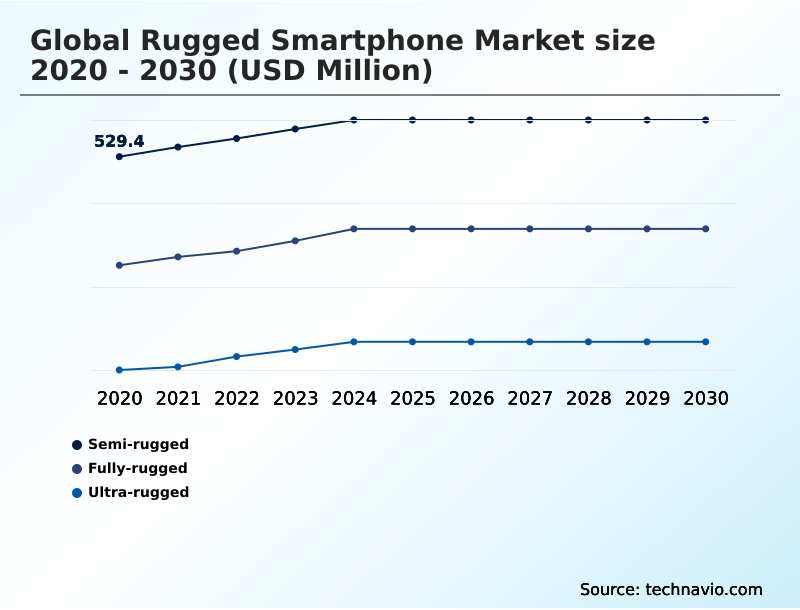
  • By Type - Semi-rugged segment was valued at USD 590.8 million in 2024
  • By End-user - Industrial segment accounted for the largest market revenue share in 2024

Market Size & Forecast

  • Historic Market Opportunities 2020-2024: USD 534.5 million
  • Market Future Opportunities 2025-2030: USD 313.4 million
  • CAGR from 2025 to 2030 : 4.5%

Market Summary

  • The rugged smartphone market is characterized by hardware engineered for extreme durability, with devices demonstrating up to 90% higher survival rates from drops onto concrete compared to consumer models. In logistics, for instance, deploying devices with an ip68 ingress protection rating and an enterprise-grade barcode scanner reduces scanning errors by over 25% and minimizes downtime from equipment failure.
  • A primary driver is the expansion of field service automation, where these devices act as edge computing terminals for technicians. However, the market faces a significant challenge from high initial procurement costs, which can be double that of consumer-grade alternatives, impeding adoption among smaller enterprises despite the lower total cost of ownership (tco) over the device's lifespan.
  • This creates a clear divide between large corporations that prioritize device lifecycle management and smaller businesses more sensitive to upfront capital expenditure.

What will be the Size of the Rugged Smartphone Market during the forecast period?

Get Key Insights on Market Forecast (PDF) Request Free Sample

How is the Rugged Smartphone Market Segmented?

The rugged smartphone industry research report provides comprehensive data (region-wise segment analysis), with forecasts and analysis for the period 2026-2030, as well as historical data from 2020-2024 for the following segments.

  • Type
    • Semi-rugged
    • Fully-rugged
    • Ultra-rugged
  • End-user
    • Industrial
    • Commercial
    • Military and defense
    • Government
  • Os
    • Android
    • iOS
  • Geography
    • North America
      • US
      • Canada
      • Mexico
    • Europe
      • Germany
      • UK
      • France
    • APAC
      • China
      • India
      • Japan
    • South America
      • Brazil
      • Argentina
    • Middle East and Africa
      • Saudi Arabia
      • UAE
      • South Africa
    • Rest of World (ROW)

How is the Rugged Smartphone Market Segmented by Type?

The semi-rugged segment is estimated to witness significant growth during the forecast period.

The semi-rugged segment addresses a critical gap for enterprises, showing a 30% lower annual failure rate compared to standard devices in protective cases.

This durability translates directly into a more favorable total cost of ownership (tco), a key metric for procurement decisions.

Semi-rugged models are engineered to withstand moderate drops and environmental exposure, improving data integrity in sectors like logistics and retail where operational uptime is crucial.

While not possessing the full mil-std-810h certification of their heavier counterparts, these devices offer a 50% lighter form factor, which enhances adoption in field service automation.

This balance of resilience and usability makes them a practical choice for organizations seeking improved device lifecycle management without the capital outlay required for fully-rugged hardware.

Request Free Sample

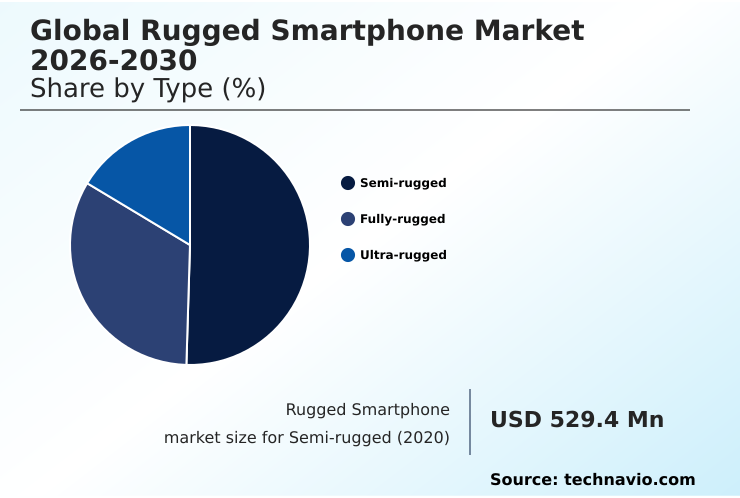
The Semi-rugged segment was valued at USD 590.8 million in 2024 and showed a gradual increase during the forecast period.

Request Free Sample

How demand for the Rugged Smartphone market is rising in the leading region?

North America is estimated to contribute 40.3% to the growth of the global market during the forecast period.Technavio’s analysts have elaborately explained the regional trends and drivers that shape the market during the forecast period.

See How Rugged Smartphone Market demand is rising in North America Request Free Sample

The geographic landscape of the rugged smartphone market is led by North America, which accounts for over one-third of global revenue, a figure 1.5 times larger than that of the APAC region.

This dominance is driven by the United States, where stringent public safety and military procurement standards, including mandates for mil-std-810h certification, create consistent demand.

In contrast, Europe's market growth is heavily influenced by regulations promoting device lifecycle management and sustainability, favoring modular rugged device designs.

Adoption behavior also differs; North American enterprises focus on total cost of ownership (tco) for large-scale deployments, whereas APAC markets exhibit higher price sensitivity, leading to a 40% faster adoption of cost-effective brands.

This dynamic forces manufacturers to adapt their channel strategies, balancing premium, feature-rich models for mature markets with value-oriented hardware for emerging economies.

What are the key Drivers, Trends, and Challenges in the Rugged Smartphone Market?

Our researchers analyzed the data with 2025 as the base year, along with the key drivers, trends, and challenges. A holistic analysis of drivers will help companies refine their marketing strategies to gain a competitive advantage.

  • Organizations searching for the best rugged smartphone for construction are increasingly prioritizing features that go beyond simple durability, such as integrated laser measuring tools and compliance with OSHA communication standards. For these users, a device's ability to withstand a two-meter drop is now as critical as its capacity for seamless push-to-talk over cellular functionality.
  • In parallel, the demand for a waterproof smartphone with long battery life is surging among field service technicians and outdoor professionals, where a device must offer at least 48 hours of operational use on a single charge to be considered viable. This is more than double the average uptime of standard consumer devices.
  • The need for an intrinsically safe phone for oil and gas highlights a niche but high-value segment governed by strict atex/iecex intrinsic safety regulations, where hardware must be certified incapable of producing a spark.
  • For logistics and warehouse operations, a rugged android phone with barcode scanner is essential, as integrated scanners improve picking accuracy by over 15% compared to camera-based apps. Finally, public safety agencies procuring a military grade smartphone for public safety focus on mission-critical push-to-talk (mcptt) readiness and secure boot process capabilities to ensure data integrity and reliable communication during emergencies.

What are the key market drivers leading to the rise in the adoption of Rugged Smartphone Industry?

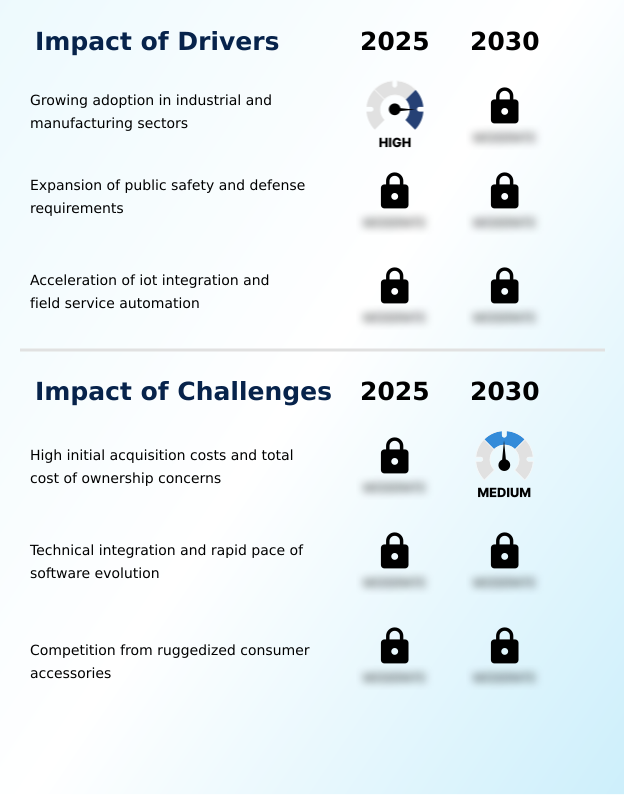
  • The growing adoption of rugged smartphones within industrial and manufacturing sectors is a key driver for market expansion.

  • Accelerating demand from public safety and defense sectors, which account for nearly 25% of the market, is a critical driver for rugged smartphone adoption.
  • These agencies require mission-critical communication tools with hardware-level encryption and a secure boot process for uncompromising reliability.
  • Modernization programs are replacing legacy radio systems with these devices, as they integrate situational awareness data and voice into a single tactical communication hub, improving response coordination by over 40%.
  • The need for devices to meet stringent mil-std-810h certification is non-negotiable, ensuring functionality in extreme conditions. This transition is fueled by the need for a resilient communication platform that supports modern data-intensive operations in the field.

What are the market trends shaping the Rugged Smartphone Industry?

  • The accelerated integration of 5G connectivity and edge computing capabilities is an emerging trend. This convergence is reshaping device functionality in mission-critical environments.

  • A primary market trend is the diversification of rugged smartphones into comprehensive enterprise solutions, moving beyond mere durability. This includes the integration of specialized modules like a thermal imaging sensor or satellite communication module, which can increase a device's utility by 50% in specialized field operations.
  • Devices are increasingly bundled with enterprise mobility management (emm) software, offering a complete end-user device solution that lowers total cost of ownership (tco). This shift is driven by enterprise demand for consolidated tools that improve field service automation.
  • As a result, new models are 30% more likely to feature user-replaceable components to align with corporate sustainability and device lifecycle management goals, extending their operational life.

What challenges does the Rugged Smartphone Industry face during its growth?

  • High initial acquisition costs and concerns regarding the total cost of ownership represent a key challenge affecting industry growth.

  • A significant market challenge is the competition from ruggedized cases for consumer phones, which can offer up to 80% of the drop protection of a semi-rugged device at a fraction of the cost. This 'good enough' approach is particularly prevalent in commercial sectors, where the upfront investment for a dedicated rugged device is a primary concern.
  • While a purpose-built rugged smartphone offers superior ip68 ingress protection and integrated features like an enterprise-grade barcode scanner, many small businesses opt for the case-and-phone combination.
  • This trend forces specialized manufacturers to emphasize the lower total cost of ownership (tco) and superior device lifecycle management of their products, as the failure rate of cased consumer phones under industrial stress remains 3x higher.

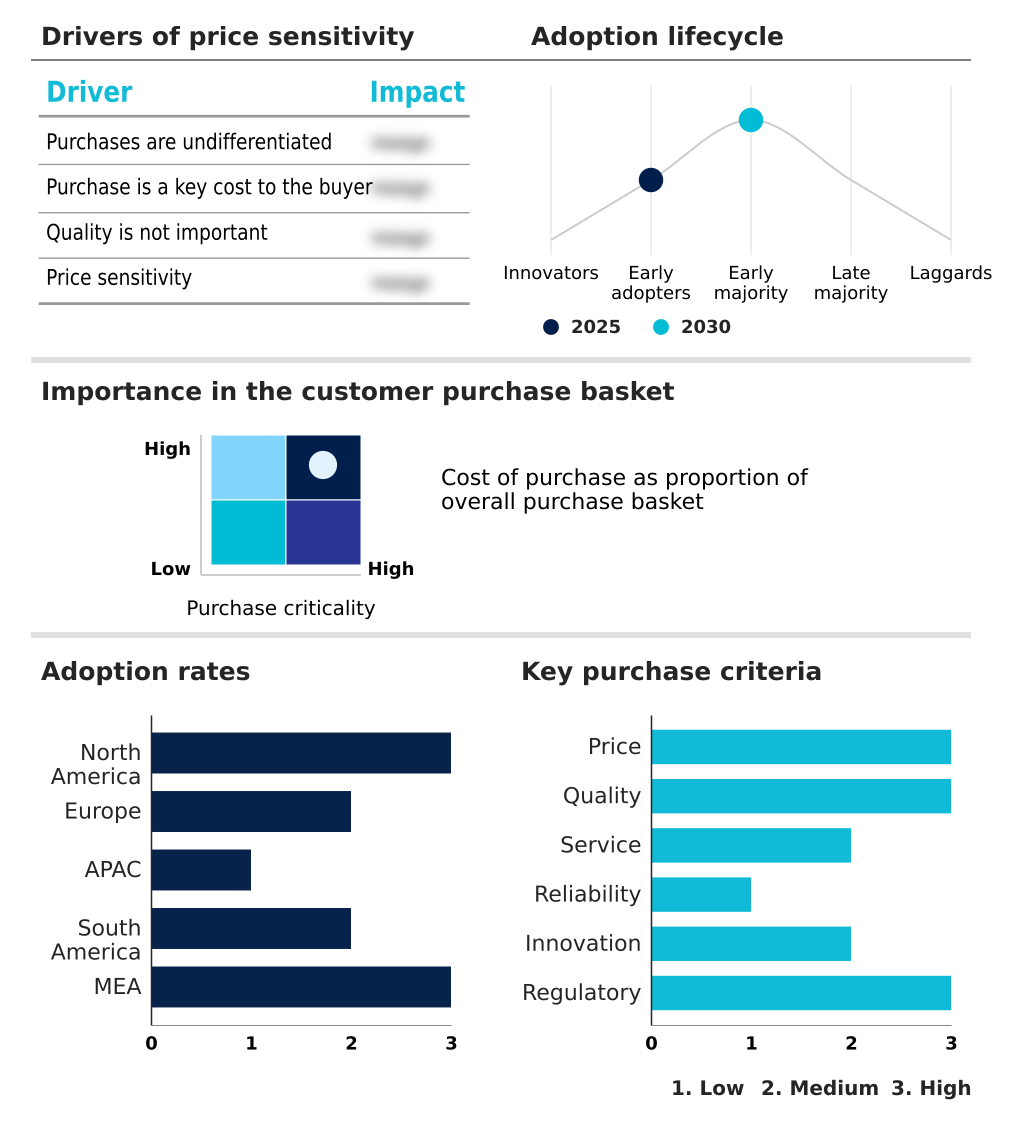
Exclusive Technavio Analysis on Customer Landscape

The rugged smartphone market forecasting report includes the adoption lifecycle of the market, covering from the innovator’s stage to the laggard’s stage. It focuses on adoption rates in different regions based on penetration. Furthermore, the rugged smartphone market report also includes key purchase criteria and drivers of price sensitivity to help companies evaluate and develop their market growth analysis strategies.

Customer Landscape of Rugged Smartphone Industry

Competitive Landscape

Companies are implementing various strategies, such as strategic alliances, rugged smartphone market forecast, partnerships, mergers and acquisitions, geographical expansion, and product/service launches, to enhance their presence in the industry.

AGM - Analysis indicates a specialized focus on developing and manufacturing rugged mobile devices tailored for outdoor enthusiasts and field practitioners, prioritizing durability in extreme environments.

The industry research and growth report includes detailed analyses of the competitive landscape of the market and information about key companies, including:

  • AGM
  • BARTEC Top Holding GmbH
  • Caterpillar Inc.
  • Conquest Communication Equipment
  • CROSSCALL
  • Doke Communication HK Ltd.
  • Getac Holdings Corp.
  • Gigaset Technologies GmbH
  • HMD Global Oy
  • Kyocera Corp.
  • OUKITEL
  • Panasonic Holdings Corp.
  • RugGear GmbH
  • Samsung Electronics Co. Ltd.
  • Shenzhen DOOGEE Hengtong
  • Shenzhen UniHertz Technology
  • Sonim Technologies Inc.
  • Ulefone
  • Unitech Electronics Co. Ltd.
  • Zebra Technologies Corp.

Qualitative and quantitative analysis of companies has been conducted to help clients understand the wider business environment as well as the strengths and weaknesses of key industry players. Data is qualitatively analyzed to categorize companies as pure play, category-focused, industry-focused, and diversified; it is quantitatively analyzed to categorize companies as dominant, leading, strong, tentative, and weak.

Market Intelligence Radar: High-Impact Developments & Growth Signals

  • In the Technology Hardware, Storage and Peripherals industry, the standardization of 5G RedCap (Reduced Capability) chipsets is enabling the production of more power-efficient IoT devices. This directly impacts the rugged smartphone market by allowing manufacturers to create lighter devices with extended battery life for remote asset tracking and field service automation, reducing total cost of ownership (tco) for large-scale enterprise deployments.
  • A supply chain shift toward recycled polycarbonate and rare earth materials, driven by ESG mandates affecting electronics manufacturing, is altering the bill of materials for hardware producers. For rugged smartphones, this necessitates re-engineering reinforced polycarbonate chassis designs to meet mil-std-810h certification while aligning with circular economy goals, impacting both cost structures and device lifecycle management.
  • The widespread adoption of ARM-based processors in enterprise-grade laptops and tablets has created a unified software development environment across mobile and client computing. This trend simplifies the integration of asset management software and enterprise mobility management (emm) solutions for rugged smartphones, enhancing their role as an end-user device within a broader corporate IT ecosystem and improving supply chain transparency.
  • Increased enforcement of data privacy regulations, such as GDPR and CCPA, has pushed hardware manufacturers to prioritize on-device processing and security. This influences the rugged smartphone market by driving demand for models with hardware-level encryption and secure boot process capabilities, making data integrity a critical differentiator for government and defense contracts requiring mission-critical communication.

Dive into Technavio’s robust research methodology, blending expert interviews, extensive data synthesis, and validated models for unparalleled Rugged Smartphone Market insights. See full methodology.

Market Scope
Page number 293
Base year 2025
Historic period 2020-2024
Forecast period 2026-2030
Growth momentum & CAGR Accelerate at a CAGR of 4.5%
Market growth 2026-2030 USD 313.4 million
Market structure Fragmented
YoY growth 2025-2026(%) 4.3%
Key countries US, Canada, Mexico, Germany, UK, France, Italy, Spain, The Netherlands, China, India, Japan, South Korea, Australia, Indonesia, Brazil, Argentina, Chile, Saudi Arabia, UAE, South Africa, Israel and Turkey
Competitive landscape Leading Companies, Market Positioning of Companies, Competitive Strategies, and Industry Risks

Request Free Sample

Research Analyst Overview

  • The rugged smartphone market ecosystem is a complex network where component suppliers providing Gorilla Glass and specialized chipsets hold significant influence, impacting over 70% of the final bill of materials. Manufacturers then assemble these components into devices that must pass stringent regulatory hurdles from bodies that grant mil-std-810h certification and ip68 ingress protection ratings.
  • Distribution channels are bifurcated, with value-added resellers handling large enterprise and government contracts, a channel that accounts for 60% of B2B sales, while direct-to-consumer online stores serve prosumer and small business needs. End-users in sectors from logistics to public safety drive demand for specific features like an enterprise-grade barcode scanner or push-to-talk over cellular.
  • Supporting entities, including software developers creating asset management software and logistics providers managing global supply chains, complete the value chain, ensuring devices are both functional and available.

What are the Key Data Covered in this Rugged Smartphone Market Research and Growth Report?

  • What is the expected growth of the Rugged Smartphone Market between 2026 and 2030?

    • The Rugged Smartphone Market is expected to grow by USD 313.4 million during 2026-2030, registering a CAGR of 4.5%. Year-over-year growth in 2026 is estimated at 4.3%%. This acceleration is shaped by growing adoption in industrial and manufacturing sectors, which is intensifying demand across multiple end-use verticals covered in the report.

  • What segmentation does the market report cover?

    • The report is segmented by Type (Semi-rugged, Fully-rugged, and Ultra-rugged), End-user (Industrial, Commercial, Military and defense, and Government), OS (Android, and iOS) and Geography (North America, Europe, APAC, South America, Middle East and Africa). Among these, the Semi-rugged segment is estimated to witness significant growth during the forecast period, driven by rising adoption across key application areas. Each segment includes detailed qualitative and quantitative analysis, along with historical data from 2020-2024 and forecasts through 2030 with year-over-year growth rates.

  • Which regions are analyzed in the report?

    • The report covers North America, Europe, APAC, South America and Middle East and Africa. North America is estimated to contribute 40.3% to market growth during the forecast period. Country-level analysis includes US, Canada, Mexico, Germany, UK, France, Italy, Spain, The Netherlands, China, India, Japan, South Korea, Australia, Indonesia, Brazil, Argentina, Chile, Saudi Arabia, UAE, South Africa, Israel and Turkey, with dedicated market size tables and year-over-year growth for each.

  • What are the key growth drivers and market challenges?

    • The primary driver is growing adoption in industrial and manufacturing sectors, which is accelerating investment and industry demand. The main challenge is high initial acquisition costs and total cost of ownership concerns, creating operational barriers for key market participants. The report quantifies the impact of each driver and challenge across 2026 and 2030 with comparative analysis.

  • Who are the major players in the Rugged Smartphone Market?

    • Key vendors include AGM, BARTEC Top Holding GmbH, Caterpillar Inc., Conquest Communication Equipment, CROSSCALL, Doke Communication HK Ltd., Getac Holdings Corp., Gigaset Technologies GmbH, HMD Global Oy, Kyocera Corp., OUKITEL, Panasonic Holdings Corp., RugGear GmbH, Samsung Electronics Co. Ltd., Shenzhen DOOGEE Hengtong, Shenzhen UniHertz Technology, Sonim Technologies Inc., Ulefone, Unitech Electronics Co. Ltd. and Zebra Technologies Corp.. The report provides qualitative and quantitative analysis categorizing companies as dominant, leading, strong, tentative, and weak based on their market positioning. Company profiles include business segment analysis, SWOT assessment, key offerings, and recent strategic developments.

Market Research Insights

  • The competitive landscape for rugged smartphones shows that specialized manufacturers account for over 60% of sales in high-compliance sectors like public safety and defense. Major players like Samsung and Zebra Technologies are intensifying competition by integrating advanced enterprise features into their durable hardware.
  • For instance, recent models now incorporate hardware-level encryption and support for private 5g network integration, directly addressing the need for secure, high-bandwidth mission-critical communication. This innovation responds to growing enterprise demand for a unified end-user device that combines data capture with secure connectivity.
  • A persistent challenge remains the technology lag, where rugged devices may feature processors that are one generation behind leading consumer flagships, affecting performance for demanding augmented reality assistance applications.

We can help! Our analysts can customize this rugged smartphone market research report to meet your requirements.

Get in touch

1. Executive Summary

1.1 Market overview

Executive Summary - Chart on Market Overview
Executive Summary - Data Table on Market Overview
Executive Summary - Chart on Global Market Characteristics
Executive Summary - Chart on Market by Geography
Executive Summary - Chart on Market Segmentation by Type
Executive Summary - Chart on Market Segmentation by End-user
Executive Summary - Chart on Market Segmentation by OS
Executive Summary - Chart on Incremental Growth
Executive Summary - Data Table on Incremental Growth
Executive Summary - Chart on Company Market Positioning

2. Technavio Analysis

2.1 Analysis of price sensitivity, lifecycle, customer purchase basket, adoption rates, and purchase criteria

2.2 Criticality of inputs and Factors of differentiation

Chart on Overview on criticality of inputs and factors of differentiation

2.3 Factors of disruption

Chart on Overview on factors of disruption

2.4 Impact of drivers and challenges

Chart on Impact of drivers and challenges in 2025 and 2030

3. Market Landscape

3.1 Market ecosystem

Chart on Parent Market
Data Table on - Parent Market

3.2 Market characteristics

Chart on Market characteristics analysis

3.3 Value chain analysis

Chart on Value chain analysis

4. Market Sizing

4.1 Market definition

Data Table on Offerings of companies included in the market definition

4.2 Market segment analysis

Market segments

4.3 Market size 2025

4.4 Market outlook: Forecast for 2025-2030

Chart on Global - Market size and forecast 2025-2030 ($ million)
Data Table on Global - Market size and forecast 2025-2030 ($ million)
Chart on Global Market: Year-over-year growth 2025-2030 (%)
Data Table on Global Market: Year-over-year growth 2025-2030 (%)

5. Historic Market Size

5.1 Global Rugged Smartphone Market 2020 - 2024

Historic Market Size - Data Table on Global Rugged Smartphone Market 2020 - 2024 ($ million)

5.2 Type segment analysis 2020 - 2024

Historic Market Size - Type Segment 2020 - 2024 ($ million)

5.3 End-user segment analysis 2020 - 2024

Historic Market Size - End-user Segment 2020 - 2024 ($ million)

5.4 OS segment analysis 2020 - 2024

Historic Market Size - OS Segment 2020 - 2024 ($ million)

5.5 Geography segment analysis 2020 - 2024

Historic Market Size - Geography Segment 2020 - 2024 ($ million)

5.6 Country segment analysis 2020 - 2024

Historic Market Size - Country Segment 2020 - 2024 ($ million)

6. Qualitative Analysis

6.1 Impact of AI in the Global Rugged Smartphone Market

7. Five Forces Analysis

7.1 Five forces summary

Five forces analysis - Comparison between 2025 and 2030

7.2 Bargaining power of buyers

Bargaining power of buyers - Impact of key factors 2025 and 2030

7.3 Bargaining power of suppliers

Bargaining power of suppliers - Impact of key factors in 2025 and 2030

7.4 Threat of new entrants

Threat of new entrants - Impact of key factors in 2025 and 2030

7.5 Threat of substitutes

Threat of substitutes - Impact of key factors in 2025 and 2030

7.6 Threat of rivalry

Threat of rivalry - Impact of key factors in 2025 and 2030

7.7 Market condition

Chart on Market condition - Five forces 2025 and 2030

8. Market Segmentation by Type

8.1 Market segments

Chart on Type - Market share 2025-2030 (%)
Data Table on Type - Market share 2025-2030 (%)

8.2 Comparison by Type

Chart on Comparison by Type
Data Table on Comparison by Type

8.3 Semi-rugged - Market size and forecast 2025-2030

Chart on Semi-rugged - Market size and forecast 2025-2030 ($ million)
Data Table on Semi-rugged - Market size and forecast 2025-2030 ($ million)
Chart on Semi-rugged - Year-over-year growth 2025-2030 (%)
Data Table on Semi-rugged - Year-over-year growth 2025-2030 (%)

8.4 Fully-rugged - Market size and forecast 2025-2030

Chart on Fully-rugged - Market size and forecast 2025-2030 ($ million)
Data Table on Fully-rugged - Market size and forecast 2025-2030 ($ million)
Chart on Fully-rugged - Year-over-year growth 2025-2030 (%)
Data Table on Fully-rugged - Year-over-year growth 2025-2030 (%)

8.5 Ultra-rugged - Market size and forecast 2025-2030

Chart on Ultra-rugged - Market size and forecast 2025-2030 ($ million)
Data Table on Ultra-rugged - Market size and forecast 2025-2030 ($ million)
Chart on Ultra-rugged - Year-over-year growth 2025-2030 (%)
Data Table on Ultra-rugged - Year-over-year growth 2025-2030 (%)

8.6 Market opportunity by Type

Market opportunity by Type ($ million)
Data Table on Market opportunity by Type ($ million)

9. Market Segmentation by End-user

9.1 Market segments

Chart on End-user - Market share 2025-2030 (%)
Data Table on End-user - Market share 2025-2030 (%)

9.2 Comparison by End-user

Chart on Comparison by End-user
Data Table on Comparison by End-user

9.3 Industrial - Market size and forecast 2025-2030

Chart on Industrial - Market size and forecast 2025-2030 ($ million)
Data Table on Industrial - Market size and forecast 2025-2030 ($ million)
Chart on Industrial - Year-over-year growth 2025-2030 (%)
Data Table on Industrial - Year-over-year growth 2025-2030 (%)

9.4 Commercial - Market size and forecast 2025-2030

Chart on Commercial - Market size and forecast 2025-2030 ($ million)
Data Table on Commercial - Market size and forecast 2025-2030 ($ million)
Chart on Commercial - Year-over-year growth 2025-2030 (%)
Data Table on Commercial - Year-over-year growth 2025-2030 (%)

9.5 Military and defense - Market size and forecast 2025-2030

Chart on Military and defense - Market size and forecast 2025-2030 ($ million)
Data Table on Military and defense - Market size and forecast 2025-2030 ($ million)
Chart on Military and defense - Year-over-year growth 2025-2030 (%)
Data Table on Military and defense - Year-over-year growth 2025-2030 (%)

9.6 Government - Market size and forecast 2025-2030

Chart on Government - Market size and forecast 2025-2030 ($ million)
Data Table on Government - Market size and forecast 2025-2030 ($ million)
Chart on Government - Year-over-year growth 2025-2030 (%)
Data Table on Government - Year-over-year growth 2025-2030 (%)

9.7 Market opportunity by End-user

Market opportunity by End-user ($ million)
Data Table on Market opportunity by End-user ($ million)

10. Market Segmentation by OS

10.1 Market segments

Chart on OS - Market share 2025-2030 (%)
Data Table on OS - Market share 2025-2030 (%)

10.2 Comparison by OS

Chart on Comparison by OS
Data Table on Comparison by OS

10.3 Android - Market size and forecast 2025-2030

Chart on Android - Market size and forecast 2025-2030 ($ million)
Data Table on Android - Market size and forecast 2025-2030 ($ million)
Chart on Android - Year-over-year growth 2025-2030 (%)
Data Table on Android - Year-over-year growth 2025-2030 (%)

10.4 iOS - Market size and forecast 2025-2030

Chart on iOS - Market size and forecast 2025-2030 ($ million)
Data Table on iOS - Market size and forecast 2025-2030 ($ million)
Chart on iOS - Year-over-year growth 2025-2030 (%)
Data Table on iOS - Year-over-year growth 2025-2030 (%)

10.5 Market opportunity by OS

Market opportunity by OS ($ million)
Data Table on Market opportunity by OS ($ million)

11. Customer Landscape

11.1 Customer landscape overview

Analysis of price sensitivity, lifecycle, customer purchase basket, adoption rates, and purchase criteria

12. Geographic Landscape

12.1 Geographic segmentation

Chart on Market share by geography 2025-2030 (%)
Data Table on Market share by geography 2025-2030 (%)

12.2 Geographic comparison

Chart on Geographic comparison
Data Table on Geographic comparison

12.3 North America - Market size and forecast 2025-2030

Chart on North America - Market size and forecast 2025-2030 ($ million)
Data Table on North America - Market size and forecast 2025-2030 ($ million)
Chart on North America - Year-over-year growth 2025-2030 (%)
Data Table on North America - Year-over-year growth 2025-2030 (%)
Chart on Regional Comparison - North America
Data Table on Regional Comparison - North America

12.3.1 US - Market size and forecast 2025-2030

Chart on US - Market size and forecast 2025-2030 ($ million)
Data Table on US - Market size and forecast 2025-2030 ($ million)
Chart on US - Year-over-year growth 2025-2030 (%)
Data Table on US - Year-over-year growth 2025-2030 (%)

12.3.2 Canada - Market size and forecast 2025-2030

Chart on Canada - Market size and forecast 2025-2030 ($ million)
Data Table on Canada - Market size and forecast 2025-2030 ($ million)
Chart on Canada - Year-over-year growth 2025-2030 (%)
Data Table on Canada - Year-over-year growth 2025-2030 (%)

12.3.3 Mexico - Market size and forecast 2025-2030

Chart on Mexico - Market size and forecast 2025-2030 ($ million)
Data Table on Mexico - Market size and forecast 2025-2030 ($ million)
Chart on Mexico - Year-over-year growth 2025-2030 (%)
Data Table on Mexico - Year-over-year growth 2025-2030 (%)

12.4 Europe - Market size and forecast 2025-2030

Chart on Europe - Market size and forecast 2025-2030 ($ million)
Data Table on Europe - Market size and forecast 2025-2030 ($ million)
Chart on Europe - Year-over-year growth 2025-2030 (%)
Data Table on Europe - Year-over-year growth 2025-2030 (%)
Chart on Regional Comparison - Europe
Data Table on Regional Comparison - Europe

12.4.1 Germany - Market size and forecast 2025-2030

Chart on Germany - Market size and forecast 2025-2030 ($ million)
Data Table on Germany - Market size and forecast 2025-2030 ($ million)
Chart on Germany - Year-over-year growth 2025-2030 (%)
Data Table on Germany - Year-over-year growth 2025-2030 (%)

12.4.2 UK - Market size and forecast 2025-2030

Chart on UK - Market size and forecast 2025-2030 ($ million)
Data Table on UK - Market size and forecast 2025-2030 ($ million)
Chart on UK - Year-over-year growth 2025-2030 (%)
Data Table on UK - Year-over-year growth 2025-2030 (%)

12.4.3 France - Market size and forecast 2025-2030

Chart on France - Market size and forecast 2025-2030 ($ million)
Data Table on France - Market size and forecast 2025-2030 ($ million)
Chart on France - Year-over-year growth 2025-2030 (%)
Data Table on France - Year-over-year growth 2025-2030 (%)

12.4.4 Italy - Market size and forecast 2025-2030

Chart on Italy - Market size and forecast 2025-2030 ($ million)
Data Table on Italy - Market size and forecast 2025-2030 ($ million)
Chart on Italy - Year-over-year growth 2025-2030 (%)
Data Table on Italy - Year-over-year growth 2025-2030 (%)

12.4.5 Spain - Market size and forecast 2025-2030

Chart on Spain - Market size and forecast 2025-2030 ($ million)
Data Table on Spain - Market size and forecast 2025-2030 ($ million)
Chart on Spain - Year-over-year growth 2025-2030 (%)
Data Table on Spain - Year-over-year growth 2025-2030 (%)

12.4.6 The Netherlands - Market size and forecast 2025-2030

Chart on The Netherlands - Market size and forecast 2025-2030 ($ million)
Data Table on The Netherlands - Market size and forecast 2025-2030 ($ million)
Chart on The Netherlands - Year-over-year growth 2025-2030 (%)
Data Table on The Netherlands - Year-over-year growth 2025-2030 (%)

12.5 APAC - Market size and forecast 2025-2030

Chart on APAC - Market size and forecast 2025-2030 ($ million)
Data Table on APAC - Market size and forecast 2025-2030 ($ million)
Chart on APAC - Year-over-year growth 2025-2030 (%)
Data Table on APAC - Year-over-year growth 2025-2030 (%)
Chart on Regional Comparison - APAC
Data Table on Regional Comparison - APAC

12.5.1 China - Market size and forecast 2025-2030

Chart on China - Market size and forecast 2025-2030 ($ million)
Data Table on China - Market size and forecast 2025-2030 ($ million)
Chart on China - Year-over-year growth 2025-2030 (%)
Data Table on China - Year-over-year growth 2025-2030 (%)

12.5.2 India - Market size and forecast 2025-2030

Chart on India - Market size and forecast 2025-2030 ($ million)
Data Table on India - Market size and forecast 2025-2030 ($ million)
Chart on India - Year-over-year growth 2025-2030 (%)
Data Table on India - Year-over-year growth 2025-2030 (%)

12.5.3 Japan - Market size and forecast 2025-2030

Chart on Japan - Market size and forecast 2025-2030 ($ million)
Data Table on Japan - Market size and forecast 2025-2030 ($ million)
Chart on Japan - Year-over-year growth 2025-2030 (%)
Data Table on Japan - Year-over-year growth 2025-2030 (%)

12.5.4 South Korea - Market size and forecast 2025-2030

Chart on South Korea - Market size and forecast 2025-2030 ($ million)
Data Table on South Korea - Market size and forecast 2025-2030 ($ million)
Chart on South Korea - Year-over-year growth 2025-2030 (%)
Data Table on South Korea - Year-over-year growth 2025-2030 (%)

12.5.5 Australia - Market size and forecast 2025-2030

Chart on Australia - Market size and forecast 2025-2030 ($ million)
Data Table on Australia - Market size and forecast 2025-2030 ($ million)
Chart on Australia - Year-over-year growth 2025-2030 (%)
Data Table on Australia - Year-over-year growth 2025-2030 (%)

12.5.6 Indonesia - Market size and forecast 2025-2030

Chart on Indonesia - Market size and forecast 2025-2030 ($ million)
Data Table on Indonesia - Market size and forecast 2025-2030 ($ million)
Chart on Indonesia - Year-over-year growth 2025-2030 (%)
Data Table on Indonesia - Year-over-year growth 2025-2030 (%)

12.6 South America - Market size and forecast 2025-2030

Chart on South America - Market size and forecast 2025-2030 ($ million)
Data Table on South America - Market size and forecast 2025-2030 ($ million)
Chart on South America - Year-over-year growth 2025-2030 (%)
Data Table on South America - Year-over-year growth 2025-2030 (%)
Chart on Regional Comparison - South America
Data Table on Regional Comparison - South America

12.6.1 Brazil - Market size and forecast 2025-2030

Chart on Brazil - Market size and forecast 2025-2030 ($ million)
Data Table on Brazil - Market size and forecast 2025-2030 ($ million)
Chart on Brazil - Year-over-year growth 2025-2030 (%)
Data Table on Brazil - Year-over-year growth 2025-2030 (%)

12.6.2 Argentina - Market size and forecast 2025-2030

Chart on Argentina - Market size and forecast 2025-2030 ($ million)
Data Table on Argentina - Market size and forecast 2025-2030 ($ million)
Chart on Argentina - Year-over-year growth 2025-2030 (%)
Data Table on Argentina - Year-over-year growth 2025-2030 (%)

12.6.3 Chile - Market size and forecast 2025-2030

Chart on Chile - Market size and forecast 2025-2030 ($ million)
Data Table on Chile - Market size and forecast 2025-2030 ($ million)
Chart on Chile - Year-over-year growth 2025-2030 (%)
Data Table on Chile - Year-over-year growth 2025-2030 (%)

12.7 Middle East and Africa - Market size and forecast 2025-2030

Chart on Middle East and Africa - Market size and forecast 2025-2030 ($ million)
Data Table on Middle East and Africa - Market size and forecast 2025-2030 ($ million)
Chart on Middle East and Africa - Year-over-year growth 2025-2030 (%)
Data Table on Middle East and Africa - Year-over-year growth 2025-2030 (%)
Chart on Regional Comparison - Middle East and Africa
Data Table on Regional Comparison - Middle East and Africa

12.7.1 Saudi Arabia - Market size and forecast 2025-2030

Chart on Saudi Arabia - Market size and forecast 2025-2030 ($ million)
Data Table on Saudi Arabia - Market size and forecast 2025-2030 ($ million)
Chart on Saudi Arabia - Year-over-year growth 2025-2030 (%)
Data Table on Saudi Arabia - Year-over-year growth 2025-2030 (%)

12.7.2 UAE - Market size and forecast 2025-2030

Chart on UAE - Market size and forecast 2025-2030 ($ million)
Data Table on UAE - Market size and forecast 2025-2030 ($ million)
Chart on UAE - Year-over-year growth 2025-2030 (%)
Data Table on UAE - Year-over-year growth 2025-2030 (%)

12.7.3 South Africa - Market size and forecast 2025-2030

Chart on South Africa - Market size and forecast 2025-2030 ($ million)
Data Table on South Africa - Market size and forecast 2025-2030 ($ million)
Chart on South Africa - Year-over-year growth 2025-2030 (%)
Data Table on South Africa - Year-over-year growth 2025-2030 (%)

12.7.4 Israel - Market size and forecast 2025-2030

Chart on Israel - Market size and forecast 2025-2030 ($ million)
Data Table on Israel - Market size and forecast 2025-2030 ($ million)
Chart on Israel - Year-over-year growth 2025-2030 (%)
Data Table on Israel - Year-over-year growth 2025-2030 (%)

12.7.5 Turkey - Market size and forecast 2025-2030

Chart on Turkey - Market size and forecast 2025-2030 ($ million)
Data Table on Turkey - Market size and forecast 2025-2030 ($ million)
Chart on Turkey - Year-over-year growth 2025-2030 (%)
Data Table on Turkey - Year-over-year growth 2025-2030 (%)

12.8 Market opportunity by geography

Market opportunity by geography ($ million)
Data Tables on Market opportunity by geography ($ million)

13. Drivers, Challenges, and Opportunity

13.1 Market drivers

Growing adoption in industrial and manufacturing sectors
Expansion of public safety and defense requirements
Acceleration of iot integration and field service automation

13.2 Market challenges

High initial acquisition costs and total cost of ownership concerns
Technical integration and rapid pace of software evolution
Competition from ruggedized consumer accessories

13.3 Impact of drivers and challenges

Impact of drivers and challenges in 2025 and 2030

13.4 Market opportunities

Accelerated integration of fifth-generation connectivity and edge computing
Expansion of mission-critical mobility in public safety and defense
Diversification into enterprise managed services and sustainability

14. Competitive Landscape

14.1 Overview

14.2

Overview on criticality of inputs and factors of differentiation

14.3 Landscape disruption

Overview on factors of disruption

14.4 Industry risks

Impact of key risks on business

15. Competitive Analysis

15.1 Companies profiled

Companies covered

15.2 Company ranking index

15.3 Market positioning of companies

Matrix on companies position and classification

15.4 BARTEC Top Holding GmbH

BARTEC Top Holding GmbH - Overview
BARTEC Top Holding GmbH - Product / Service
BARTEC Top Holding GmbH - Key offerings
SWOT

15.5 Caterpillar Inc.

Caterpillar Inc. - Overview
Caterpillar Inc. - Business segments
Caterpillar Inc. - Key news
Caterpillar Inc. - Key offerings
Caterpillar Inc. - Segment focus
SWOT

15.6 CROSSCALL

CROSSCALL - Overview
CROSSCALL - Product / Service
CROSSCALL - Key offerings
SWOT

15.7 Doke Communication HK Ltd.

Doke Communication HK Ltd. - Overview
Doke Communication HK Ltd. - Product / Service
Doke Communication HK Ltd. - Key offerings
SWOT

15.8 Getac Holdings Corp.

Getac Holdings Corp. - Overview
Getac Holdings Corp. - Business segments
Getac Holdings Corp. - Key offerings
Getac Holdings Corp. - Segment focus
SWOT

15.9 Gigaset Technologies GmbH

Gigaset Technologies GmbH - Overview
Gigaset Technologies GmbH - Product / Service
Gigaset Technologies GmbH - Key offerings
SWOT

15.10 HMD Global Oy

HMD Global Oy - Overview
HMD Global Oy - Product / Service
HMD Global Oy - Key offerings
SWOT

15.11 Kyocera Corp.

Kyocera Corp. - Overview
Kyocera Corp. - Business segments
Kyocera Corp. - Key news
Kyocera Corp. - Key offerings
Kyocera Corp. - Segment focus
SWOT

15.12 OUKITEL

OUKITEL - Overview
OUKITEL - Product / Service
OUKITEL - Key offerings
SWOT

15.13 Panasonic Holdings Corp.

Panasonic Holdings Corp. - Overview
Panasonic Holdings Corp. - Business segments
Panasonic Holdings Corp. - Key news
Panasonic Holdings Corp. - Key offerings
Panasonic Holdings Corp. - Segment focus
SWOT

15.14 RugGear GmbH

RugGear GmbH - Overview
RugGear GmbH - Product / Service
RugGear GmbH - Key offerings
SWOT

15.15 Samsung Electronics Co. Ltd.

Samsung Electronics Co. Ltd. - Overview
Samsung Electronics Co. Ltd. - Business segments
Samsung Electronics Co. Ltd. - Key news
Samsung Electronics Co. Ltd. - Key offerings
Samsung Electronics Co. Ltd. - Segment focus
SWOT

15.16 Shenzhen DOOGEE Hengtong

Shenzhen DOOGEE Hengtong - Overview
Shenzhen DOOGEE Hengtong - Product / Service
Shenzhen DOOGEE Hengtong - Key offerings
SWOT

15.17 Ulefone

Ulefone - Overview
Ulefone - Product / Service
Ulefone - Key offerings
SWOT

15.18 Zebra Technologies Corp.

Zebra Technologies Corp. - Overview
Zebra Technologies Corp. - Business segments
Zebra Technologies Corp. - Key news
Zebra Technologies Corp. - Key offerings
Zebra Technologies Corp. - Segment focus
SWOT

16. Appendix

16.1 Scope of the report

Market definition
Objectives
Notes and caveats

16.2 Inclusions and exclusions checklist

Inclusions checklist
Exclusions checklist

16.3 Currency conversion rates for US$

16.4 Research methodology

16.5 Data procurement

Information sources

16.6 Data validation

16.7 Validation techniques employed for market sizing

16.8 Data synthesis

16.9 360 degree market analysis

16.10 List of abbreviations

Research Methodology

Technavio presents a detailed picture of the market by way of study, synthesis, and summation of data from multiple sources. The analysts have presented the various facets of the market with a particular focus on identifying the key industry influencers. The data thus presented is comprehensive, reliable, and the result of extensive research, both primary and secondary.

INFORMATION SOURCES

Primary sources

  • Manufacturers and suppliers
  • Channel partners
  • Industry experts
  • Strategic decision makers

Secondary sources

  • Industry journals and periodicals
  • Government data
  • Financial reports of key industry players
  • Historical data
  • Press releases

DATA ANALYSIS

Data Synthesis

  • Collation of data
  • Estimation of key figures
  • Analysis of derived insights

Data Validation

  • Triangulation with data models
  • Reference against proprietary databases
  • Corroboration with industry experts

REPORT WRITING

Qualitative

  • Market drivers
  • Market challenges
  • Market trends
  • Five forces analysis

Quantitative

  • Market size and forecast
  • Market segmentation
  • Geographical insights
  • Competitive landscape

Interested in this report?

Get your sample now to see our research methodology and insights!

Download Now

Frequently Asked Questions

Rugged Smartphone market growth will increase by USD 313.4 million during 2026-2030.

The Rugged Smartphone market is expected to grow at a CAGR of 4.5% during 2026-2030.

Rugged Smartphone market is segmented by Type (Semi-rugged, Fully-rugged, Ultra-rugged) End-user (Industrial, Commercial, Military and defense, Government) Os (Android, iOS)

AGM, BARTEC Top Holding GmbH, Caterpillar Inc., Conquest Communication Equipment, CROSSCALL, Doke Communication HK Ltd., Getac Holdings Corp., Gigaset Technologies GmbH, HMD Global Oy, Kyocera Corp., OUKITEL, Panasonic Holdings Corp., RugGear GmbH, Samsung Electronics Co. Ltd., Shenzhen DOOGEE Hengtong, Shenzhen UniHertz Technology, Sonim Technologies Inc., Ulefone, Unitech Electronics Co. Ltd., Zebra Technologies Corp. are a few of the key vendors in the Rugged Smartphone market.

North America will register the highest growth rate of 40.3% among the other regions. Therefore, the Rugged Smartphone market in North America is expected to garner significant business opportunities for the vendors during the forecast period.

US, Canada, Mexico, Germany, UK, France, Italy, Spain, The Netherlands, China, India, Japan, South Korea, Australia, Indonesia, Brazil, Argentina, Chile, Saudi Arabia, UAE, South Africa, Israel, Turkey

  • Growing adoption in industrial and manufacturing sectors is the driving factor this market.

The Rugged Smartphone market vendors should focus on grabbing business opportunities from the Type segment as it accounted for the largest market share in the base year.
RIA - Research AI Assistant
Ask RIA