Screenless Display Market Analysis North America, Europe, APAC, Middle East and Africa, South America - US, Germany, Canada, China, UK - Size and Forecast 2024-2028

Screenless Display Market Analysis North America, Europe, APAC, Middle East and Africa, South America - US, Germany, Canada, China, UK - Size and Forecast 2024-2028

Published: Jul 2024 157 Pages SKU: IRTNTR76191

Market Overview at a Glance

$14.87 B
Market Opportunity
46.02%
CAGR
32.79
YoY growth 2023-2024(%)

Screenless Display Market Size 2024-2028 

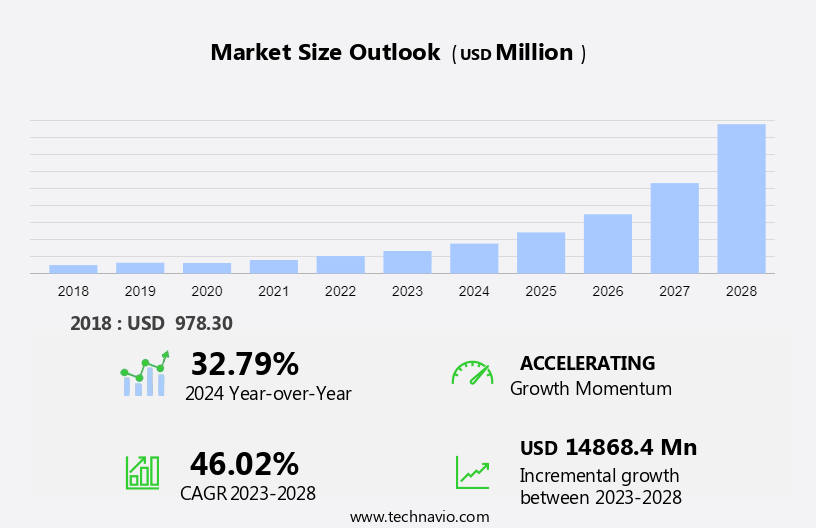
The screenless display market size is forecast to increase by USD 14.87 billion at a CAGR of 46.02% between 2023 and 2028. The market is experiencing significant advancements in visual display technology, with a focus on next-generation holographic solutions and 3D projection. The increasing demand for more convenient and portable display options, as well as growing interest in holographic displays, are driving market growth. However, the high cost of screenless display devices remains a challenge. Privacy and security concerns are also emerging as important factors, as these technologies may raise questions regarding data protection and potential misuse. To stay competitive, market participants must continue investing in research and development to address these challenges and offer innovative, cost-effective solutions.

Screenless Display Market Size

 Request Free Sample

The screenless display market is poised for significant growth, driven by innovations in visual image screen less display systems. These advanced solutions, including Laser Valve Video Projectors and Internet Glasses, offer experiences without the limitations of traditional screens. With low power and space requirements, they are ideal for diverse applications in the manufacturing field and transportation system. Multi touch capabilities enhance user interaction, while tools like CUBIT and micro vision are revolutionizing how we visualize data. The emergence of 3D scope animations and the EYE file format further enrich the user experience. Additionally, the aerospace & defense sectors are exploring hologram projection for enhanced operational efficiency, solidifying the importance of screen less TV technology in various industries. The development of screen less displays, such as laser valve video projector and multi-touch interfaces, is transforming machines in various sectors, including transportation and aerospace, by offering low power & space requirements while enhancing operational efficiency.

Market Segmentation

The market research report provides comprehensive data (region-wise segment analysis), with forecasts and estimates in "USD million" for the period 2024-2028, as well as historical data from 2018-2022 for the following segments.
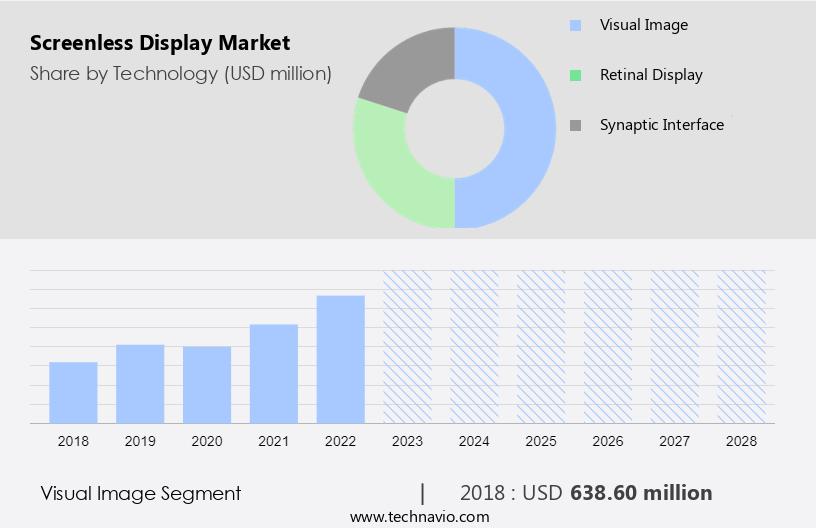
  • Technology
    • Visual image
    • Retinal display
    • Synaptic interface
  • Application
    • Automotive
    • Consumer electronics
    • Aerospace and defense
    • Healthcare
    • Commercial
  • Geography
    • North America
      • Canada
      • US
    • Europe
      • Germany
      • UK
    • APAC
      • China
    • Middle East and Africa
    • South America

By Technology Insights

The visual image segment is estimated to witness significant growth during the forecast period. Visual image technology, which includes patents on holograms, retinal displays, and synaptic interfaces, is transforming the way businesses connect with their audiences. This technology projects high-definition images directly onto surfaces, eliminating the need for traditional LCD panels. The engaging experience offered by visual image technology is particularly appealing in advertising and marketing, where companies seek innovative methods to captivate consumers. From projecting images on buildings and vehicles to implementing retinal displays and holograms, this technology provides a unique and attention-grabbing platform for communicating messages and promoting products or services.

Screenless Display Market Size

Get a glance at the market share of various segments Request Free Sample

The visual image segment accounted for USD 638.60 million in 2018 and showed a gradual increase during the forecast period.

Regional Insights

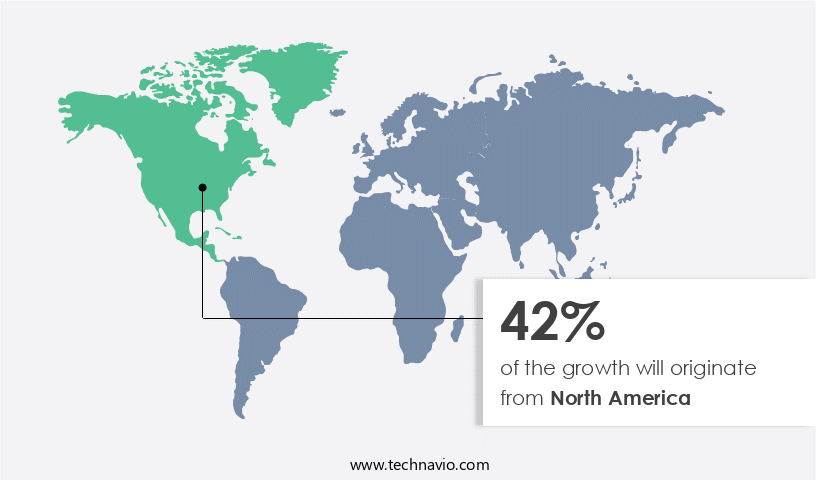
North America is estimated to contribute 42% to the growth of the global market during the forecast period. Technavio's analysts have elaborately explained the regional trends and drivers that shape the market during the forecast period.

Screenless Display Market Share by Geography

For more insights on the market share of various regions Request Free Sample

In North America, the market is experiencing significant growth due to several key factors. The region's expanding population and rising living standards have led to an increasing demand for advanced and innovative visual image display technologies. One of the primary drivers of this market's growth in North America is the presence of technologically advanced hubs, such as Silicon Valley in California. This region is renowned for its thriving tech industry, attracting major players in the field of display technologies.

For instance, Magic Leap, an American company based in Florida, has pioneered an augmented reality display called Magic Leap One, which utilizes Retinal Direct display technology. Further, pico projectors and Virtual Retinal Display are other screenless display technologies gaining popularity in the region. The market is further bolstered by the medical field's adoption of these technologies for various applications.

Our researchers analyzed the data with 2023 as the base year, along with the key drivers, trends, and challenges. A holistic analysis of drivers will help companies refine their marketing strategies to gain a competitive advantage.

Market Driver

Rising demand for more convenient and portable display solutions is the key driver of the market. The market in the United States is experiencing notable growth due to the escalating requirement for more portable and convenient display solutions. This trend is fueled by several factors, including the escalating popularity of wearable technology, the increasing preference for entertainment experiences, and the necessity of sophisticated visualization solutions in sectors such as healthcare and transportation. One of the primary drivers is the burgeoning demand for wearable technology. With the emergence of smartwatches, fitness trackers, and augmented reality glasses, consumers are increasingly relying on screenless displays to access information and engage with devices in a hassle-free manner. For example, smartwatches enable users to view notifications, make calls, and monitor their fitness metrics without the need for a conventional screen.

Furthermore, advancements in mobile technology and laptops have led to the development of screenless displays for hands-free use, enhancing productivity and convenience. In industries such as healthcare and transportation, screenless displays offer significant advantages, such as real-time data visualization and improved safety.

Market Trends

Growing interest in holographic displays is the upcoming trend in the market. Holographic displays represent an intriguing development in the market, offering the ability to generate three-dimensional visual images without conventional screens. This technology holds significant potential for delivering a more captivating experience for consumers. One notable application of holographic displays is in retail, where businesses can replace traditional product displays with holographic projections.

For example, a fashion retailer might project holographic models showcasing their latest designs, enabling customers to view clothing from various angles without even trying them on. However, the high cost and limited availability of these technologies, coupled with a lack of widespread awareness, hinder their broader adoption. Smart infrastructure solutions may eventually address these challenges, making holographic displays a more accessible and viable option for businesses.

Market Challenge

The high cost of screenless display devices is a key challenge affecting the market growth. Screenless display technology, such as 3D projection and next-generation holographic solutions, have garnered significant interest in various industries due to their ability to present visual information without the need for traditional displays. These advancements in visual display technology hold potential applications in sectors like automotive, aerospace, gaming, healthcare, and entertainment. However, the high cost of screenless display devices remains a significant barrier to their widespread adoption. For instance, the automotive industry has been investigating the implementation of augmented reality (AR) head-up displays (HUDs) to improve the driving experience. These AR HUDs project essential data, such as speed, navigation, and traffic alerts, directly onto the windshield, enabling drivers to maintain focus on the road.

Despite their advantages, the substantial investment required for these devices has restricted their usage. Privacy and security concerns associated with screenless display technology are also under scrutiny and require further research and development to ensure their implementation in a secure and confidential manner.

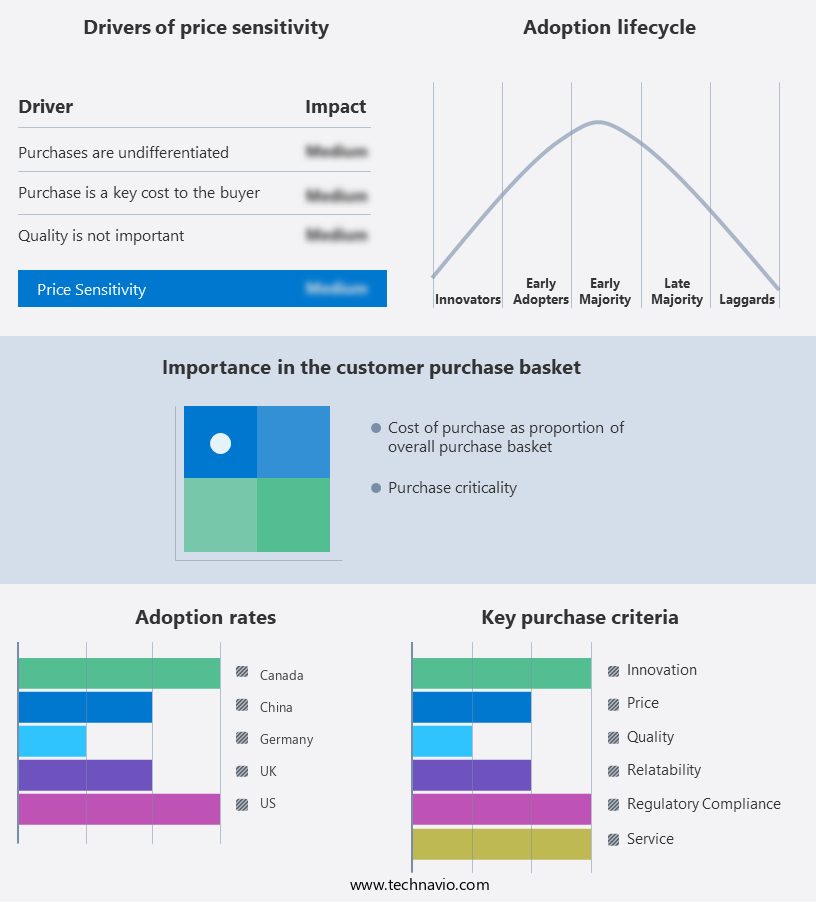
Exclusive Customer Landscape

The market forecasting report includes the adoption lifecycle of the market, covering from the innovator's stage to the laggard's stage. It focuses on adoption rates in different regions based on penetration. Furthermore, the report also includes key purchase criteria and drivers of price sensitivity to help companies evaluate and develop their market growth analysis strategies.

Screenless Display Market Share by Geography

 Customer Landscape

Key Companies & Market Insights

Companies are implementing various strategies, such as strategic alliances, partnerships, mergers and acquisitions, geographical expansion, and product/service launches, to enhance their presence in the market.

  • Sony Group Corp.: The company offers a cylindrical transparent screen display, namely Holographic optical element screen.

The market research and growth report includes detailed analyses of the competitive landscape of the market and information about key companies, including:

  • Avegant Corp.
  • BAE Systems Plc
  • Eon Reality Inc.
  • Holoxica Ltd.
  • Leia Display System
  • Magic Leap Inc.
  • Microsoft Corp.
  • RealView Imaging Ltd.
  • Robert Bosch GmbH
  • SeeReal Technologies SA

Qualitative and quantitative analysis of companies has been conducted to help clients understand the wider business environment as well as the strengths and weaknesses of key market players. Data is qualitatively analyzed to categorize companies as pure play, category-focused, industry-focused, and diversified; it is quantitatively analyzed to categorize companies as dominant, leading, strong, tentative, and weak.

Research Analyst Overview

Screenless display technology is revolutionizing the way we consume visual content, offering experiences without the need for traditional LCD panels or CRT monitors. This innovation encompasses various technologies such as holograms, retinal displays, synaptic interfaces, and visual image displays. Holograms, utilizing laser technology and electron beam lithography, create 3D projections in mid-air, providing a captivating viewing experience. Retinal displays, on the other hand, project visual images directly onto the retina, offering a more personalized experience. Advancements in technologies like synaptic interfaces, intelligent glasses, and voice recognition enable more interactive and intuitive user experiences. Holographic projections in the medical field offer enhanced visualization for surgeries and training, while in manufacturing, they facilitate better product design and quality control.

Further, in transportation systems, screenless displays can provide real-time information and enhance safety. However, high costs and limited availability hinder the widespread adoption of screenless display technology. Privacy and security concerns also arise due to the potential for intrusive holographic projections. The lack of awareness and understanding about this technology further hinders its growth. Despite these challenges, next-generation holographic solutions continue to advance, offering exciting possibilities in mobile technology, laptops, and even aerospace and defense applications.

Market Scope

Report Coverage

Details

Page number

157

Base year

2023

Historic period

2018-2022

Forecast period

2024-2028

Growth momentum & CAGR

Accelerate at a CAGR of 46.02%

Market Growth 2024-2028

USD 14.87 billion

Market structure

Concentrated

YoY growth 2023-2024(%)

32.79

Regional analysis

North America, Europe, APAC, Middle East and Africa, and South America

Performing market contribution

North America at 42%

Key countries

US, Germany, Canada, China, and UK

Competitive landscape

Leading Companies, Market Positioning of Companies, Competitive Strategies, and Industry Risks

Key companies profiled

Avegant Corp., BAE Systems Plc, Eon Reality Inc., Holoxica Ltd., Leia Display System, Magic Leap Inc., Microsoft Corp., RealView Imaging Ltd., Robert Bosch GmbH, SeeReal Technologies SA, and Sony Group Corp.

Market dynamics

Parent market analysis, market growth inducers and obstacles, market forecast, fast-growing and slow-growing segment analysis, COVID-19 impact and recovery analysis and future consumer dynamics, market condition analysis for the forecast period

Customization purview

If our market report has not included the data that you are looking for, you can reach out to our analysts and get segments customized.

Request Free Sample

What are the Key Data Covered in this Market Research and Growth Report?

  • CAGR of the market during the forecast period
  • Detailed information on factors that will drive the market growth and forecasting between 2024 and 2028
  • Precise estimation of the size of the market  and its contribution of the market in focus to the parent market
  • Accurate predictions about upcoming market growth and trends and changes in consumer behaviour
  • Growth of the market across North America, Europe, APAC, Middle East and Africa, and South America
  • Thorough analysis of the market's competitive landscape and detailed information about companies
  • Comprehensive analysis of factors that will challenge the growth of market companies

We can help! Our analysts can customize this market research report to meet your requirements. Get in touch

1 Executive Summary

  • 1.1 Market overview
    • Executive Summary - Chart on Market Overview
    • Executive Summary - Data Table on Market Overview
    • Executive Summary - Chart on Global Market Characteristics
    • Executive Summary - Chart on Market by Geography
    • Executive Summary - Chart on Market Segmentation by Technology
    • Executive Summary - Chart on Market Segmentation by Application
    • Executive Summary - Chart on Incremental Growth
    • Executive Summary - Data Table on Incremental Growth
    • Executive Summary - Chart on Company Market Positioning

2 Market Landscape

  • 2.1 Market ecosystem
    • Parent Market
    • Data Table on - Parent Market
  • 2.2 Market characteristics
    • Market characteristics analysis
  • 2.3 Value chain analysis
    • Value Chain Analysis

3 Market Sizing

  • 3.1 Market definition
    • Offerings of companies included in the market definition
  • 3.2 Market segment analysis
    • Market segments
  • 3.3 Market size 2023
    • 3.4 Market outlook: Forecast for 2023-2028
      • Chart on Global - Market size and forecast 2023-2028 ($ million)
      • Data Table on Global - Market size and forecast 2023-2028 ($ million)
      • Chart on Global Market: Year-over-year growth 2023-2028 (%)
      • Data Table on Global Market: Year-over-year growth 2023-2028 (%)

    4 Historic Market Size

    • 4.1 Global Screenless Display Market 2018 - 2022
      • Historic Market Size - Data Table on Global Screenless Display Market 2018 - 2022 ($ million)
    • 4.2 Technology segment analysis 2018 - 2022
      • Historic Market Size - Technology Segment 2018 - 2022 ($ million)
    • 4.3 Application segment analysis 2018 - 2022
      • Historic Market Size - Application Segment 2018 - 2022 ($ million)
    • 4.4 Geography segment analysis 2018 - 2022
      • Historic Market Size - Geography Segment 2018 - 2022 ($ million)
    • 4.5 Country segment analysis 2018 - 2022
      • Historic Market Size - Country Segment 2018 - 2022 ($ million)

    5 Five Forces Analysis

    • 5.1 Five forces summary
      • Five forces analysis - Comparison between 2023 and 2028
    • 5.2 Bargaining power of buyers
      • Bargaining power of buyers - Impact of key factors 2023 and 2028
    • 5.3 Bargaining power of suppliers
      • Bargaining power of suppliers - Impact of key factors in 2023 and 2028
    • 5.4 Threat of new entrants
      • Threat of new entrants - Impact of key factors in 2023 and 2028
    • 5.5 Threat of substitutes
      • Threat of substitutes - Impact of key factors in 2023 and 2028
    • 5.6 Threat of rivalry
      • Threat of rivalry - Impact of key factors in 2023 and 2028
    • 5.7 Market condition
      • Chart on Market condition - Five forces 2023 and 2028

    6 Market Segmentation by Technology

    • 6.1 Market segments
      • Chart on Technology - Market share 2023-2028 (%)
      • Data Table on Technology - Market share 2023-2028 (%)
    • 6.2 Comparison by Technology
      • Chart on Comparison by Technology
      • Data Table on Comparison by Technology
    • 6.3 Visual image - Market size and forecast 2023-2028
      • Chart on Visual image - Market size and forecast 2023-2028 ($ million)
      • Data Table on Visual image - Market size and forecast 2023-2028 ($ million)
      • Chart on Visual image - Year-over-year growth 2023-2028 (%)
      • Data Table on Visual image - Year-over-year growth 2023-2028 (%)
    • 6.4 Retinal display - Market size and forecast 2023-2028
      • Chart on Retinal display - Market size and forecast 2023-2028 ($ million)
      • Data Table on Retinal display - Market size and forecast 2023-2028 ($ million)
      • Chart on Retinal display - Year-over-year growth 2023-2028 (%)
      • Data Table on Retinal display - Year-over-year growth 2023-2028 (%)
    • 6.5 Synaptic interface - Market size and forecast 2023-2028
      • Chart on Synaptic interface - Market size and forecast 2023-2028 ($ million)
      • Data Table on Synaptic interface - Market size and forecast 2023-2028 ($ million)
      • Chart on Synaptic interface - Year-over-year growth 2023-2028 (%)
      • Data Table on Synaptic interface - Year-over-year growth 2023-2028 (%)
    • 6.6 Market opportunity by Technology
      • Market opportunity by Technology ($ million)
      • Data Table on Market opportunity by Technology ($ million)

    7 Market Segmentation by Application

    • 7.1 Market segments
      • Chart on Application - Market share 2023-2028 (%)
      • Data Table on Application - Market share 2023-2028 (%)
    • 7.2 Comparison by Application
      • Chart on Comparison by Application
      • Data Table on Comparison by Application
    • 7.3 Automotive - Market size and forecast 2023-2028
      • Chart on Automotive - Market size and forecast 2023-2028 ($ million)
      • Data Table on Automotive - Market size and forecast 2023-2028 ($ million)
      • Chart on Automotive - Year-over-year growth 2023-2028 (%)
      • Data Table on Automotive - Year-over-year growth 2023-2028 (%)
    • 7.4 Consumer electronics - Market size and forecast 2023-2028
      • Chart on Consumer electronics - Market size and forecast 2023-2028 ($ million)
      • Data Table on Consumer electronics - Market size and forecast 2023-2028 ($ million)
      • Chart on Consumer electronics - Year-over-year growth 2023-2028 (%)
      • Data Table on Consumer electronics - Year-over-year growth 2023-2028 (%)
    • 7.5 Aerospace and defense - Market size and forecast 2023-2028
      • Chart on Aerospace and defense - Market size and forecast 2023-2028 ($ million)
      • Data Table on Aerospace and defense - Market size and forecast 2023-2028 ($ million)
      • Chart on Aerospace and defense - Year-over-year growth 2023-2028 (%)
      • Data Table on Aerospace and defense - Year-over-year growth 2023-2028 (%)
    • 7.6 Healthcare - Market size and forecast 2023-2028
      • Chart on Healthcare - Market size and forecast 2023-2028 ($ million)
      • Data Table on Healthcare - Market size and forecast 2023-2028 ($ million)
      • Chart on Healthcare - Year-over-year growth 2023-2028 (%)
      • Data Table on Healthcare - Year-over-year growth 2023-2028 (%)
    • 7.7 Commercial - Market size and forecast 2023-2028
      • Chart on Commercial - Market size and forecast 2023-2028 ($ million)
      • Data Table on Commercial - Market size and forecast 2023-2028 ($ million)
      • Chart on Commercial - Year-over-year growth 2023-2028 (%)
      • Data Table on Commercial - Year-over-year growth 2023-2028 (%)
    • 7.8 Market opportunity by Application
      • Market opportunity by Application ($ million)
      • Data Table on Market opportunity by Application ($ million)

    8 Customer Landscape

    • 8.1 Customer landscape overview
      • Analysis of price sensitivity, lifecycle, customer purchase basket, adoption rates, and purchase criteria

    9 Geographic Landscape

    • 9.1 Geographic segmentation
      • Chart on Market share by geography 2023-2028 (%)
      • Data Table on Market share by geography 2023-2028 (%)
    • 9.2 Geographic comparison
      • Chart on Geographic comparison
      • Data Table on Geographic comparison
    • 9.3 North America - Market size and forecast 2023-2028
      • Chart on North America - Market size and forecast 2023-2028 ($ million)
      • Data Table on North America - Market size and forecast 2023-2028 ($ million)
      • Chart on North America - Year-over-year growth 2023-2028 (%)
      • Data Table on North America - Year-over-year growth 2023-2028 (%)
    • 9.4 Europe - Market size and forecast 2023-2028
      • Chart on Europe - Market size and forecast 2023-2028 ($ million)
      • Data Table on Europe - Market size and forecast 2023-2028 ($ million)
      • Chart on Europe - Year-over-year growth 2023-2028 (%)
      • Data Table on Europe - Year-over-year growth 2023-2028 (%)
    • 9.5 APAC - Market size and forecast 2023-2028
      • Chart on APAC - Market size and forecast 2023-2028 ($ million)
      • Data Table on APAC - Market size and forecast 2023-2028 ($ million)
      • Chart on APAC - Year-over-year growth 2023-2028 (%)
      • Data Table on APAC - Year-over-year growth 2023-2028 (%)
    • 9.6 Middle East and Africa - Market size and forecast 2023-2028
      • Chart on Middle East and Africa - Market size and forecast 2023-2028 ($ million)
      • Data Table on Middle East and Africa - Market size and forecast 2023-2028 ($ million)
      • Chart on Middle East and Africa - Year-over-year growth 2023-2028 (%)
      • Data Table on Middle East and Africa - Year-over-year growth 2023-2028 (%)
    • 9.7 South America - Market size and forecast 2023-2028
      • Chart on South America - Market size and forecast 2023-2028 ($ million)
      • Data Table on South America - Market size and forecast 2023-2028 ($ million)
      • Chart on South America - Year-over-year growth 2023-2028 (%)
      • Data Table on South America - Year-over-year growth 2023-2028 (%)
    • 9.8 US - Market size and forecast 2023-2028
      • Chart on US - Market size and forecast 2023-2028 ($ million)
      • Data Table on US - Market size and forecast 2023-2028 ($ million)
      • Chart on US - Year-over-year growth 2023-2028 (%)
      • Data Table on US - Year-over-year growth 2023-2028 (%)
    • 9.9 Germany - Market size and forecast 2023-2028
      • Chart on Germany - Market size and forecast 2023-2028 ($ million)
      • Data Table on Germany - Market size and forecast 2023-2028 ($ million)
      • Chart on Germany - Year-over-year growth 2023-2028 (%)
      • Data Table on Germany - Year-over-year growth 2023-2028 (%)
    • 9.10 Canada - Market size and forecast 2023-2028
      • Chart on Canada - Market size and forecast 2023-2028 ($ million)
      • Data Table on Canada - Market size and forecast 2023-2028 ($ million)
      • Chart on Canada - Year-over-year growth 2023-2028 (%)
      • Data Table on Canada - Year-over-year growth 2023-2028 (%)
    • 9.11 China - Market size and forecast 2023-2028
      • Chart on China - Market size and forecast 2023-2028 ($ million)
      • Data Table on China - Market size and forecast 2023-2028 ($ million)
      • Chart on China - Year-over-year growth 2023-2028 (%)
      • Data Table on China - Year-over-year growth 2023-2028 (%)
    • 9.12 UK - Market size and forecast 2023-2028
      • Chart on UK - Market size and forecast 2023-2028 ($ million)
      • Data Table on UK - Market size and forecast 2023-2028 ($ million)
      • Chart on UK - Year-over-year growth 2023-2028 (%)
      • Data Table on UK - Year-over-year growth 2023-2028 (%)
    • 9.13 Market opportunity by geography
      • Market opportunity by geography ($ million)
      • Data Tables on Market opportunity by geography ($ million)

    10 Drivers, Challenges, and Opportunity/Restraints

    • 10.1 Market drivers
      • 10.2 Market challenges
        • 10.3 Impact of drivers and challenges
          • Impact of drivers and challenges in 2023 and 2028
        • 10.4 Market opportunities/restraints

          11 Competitive Landscape

          • 11.1 Overview
            • 11.2 Competitive Landscape
              • Overview on criticality of inputs and factors of differentiation
            • 11.3 Landscape disruption
              • Overview on factors of disruption
            • 11.4 Industry risks
              • Impact of key risks on business

            12 Competitive Analysis

            • 12.1 Companies profiled
              • Companies covered
            • 12.2 Market positioning of companies
              • Matrix on companies position and classification
            • 12.3 Avegant Corp.
              • Avegant Corp. - Overview
              • Avegant Corp. - Product / Service
              • Avegant Corp. - Key offerings
            • 12.4 BAE Systems Plc
              • BAE Systems Plc - Overview
              • BAE Systems Plc - Business segments
              • BAE Systems Plc - Key news
              • BAE Systems Plc - Key offerings
              • BAE Systems Plc - Segment focus
            • 12.5 Eon Reality Inc.
              • Eon Reality Inc. - Overview
              • Eon Reality Inc. - Product / Service
              • Eon Reality Inc. - Key offerings
            • 12.6 Holoxica Ltd.
              • Holoxica Ltd. - Overview
              • Holoxica Ltd. - Product / Service
              • Holoxica Ltd. - Key offerings
            • 12.7 Leia Display System
              • Leia Display System - Overview
              • Leia Display System - Product / Service
              • Leia Display System - Key offerings
            • 12.8 Magic Leap Inc.
              • Magic Leap Inc. - Overview
              • Magic Leap Inc. - Product / Service
              • Magic Leap Inc. - Key offerings
            • 12.9 Microsoft Corp.
              • Microsoft Corp. - Overview
              • Microsoft Corp. - Business segments
              • Microsoft Corp. - Key news
              • Microsoft Corp. - Key offerings
              • Microsoft Corp. - Segment focus
            • 12.10 RealView Imaging Ltd.
              • RealView Imaging Ltd. - Overview
              • RealView Imaging Ltd. - Product / Service
              • RealView Imaging Ltd. - Key offerings
            • 12.11 Robert Bosch GmbH
              • Robert Bosch GmbH - Overview
              • Robert Bosch GmbH - Product / Service
              • Robert Bosch GmbH - Key news
              • Robert Bosch GmbH - Key offerings
            • 12.12 SeeReal Technologies SA
              • SeeReal Technologies SA - Overview
              • SeeReal Technologies SA - Product / Service
              • SeeReal Technologies SA - Key offerings
            • 12.13 Sony Group Corp.
              • Sony Group Corp. - Overview
              • Sony Group Corp. - Business segments
              • Sony Group Corp. - Key news
              • Sony Group Corp. - Key offerings
              • Sony Group Corp. - Segment focus

            13 Appendix

            • 13.1 Scope of the report
              • 13.2 Inclusions and exclusions checklist
                • Inclusions checklist
                • Exclusions checklist
              • 13.3 Currency conversion rates for US$
                • Currency conversion rates for US$
              • 13.4 Research methodology
                • Research methodology
              • 13.5 Data procurement
                • Information sources
              • 13.6 Data validation
                • Data validation
              • 13.7 Validation techniques employed for market sizing
                • Validation techniques employed for market sizing
              • 13.8 Data synthesis
                • Data synthesis
              • 13.9 360 degree market analysis
                • 360 degree market analysis
              • 13.10 List of abbreviations
                • List of abbreviations

              Research Methodology

              Technavio presents a detailed picture of the market by way of study, synthesis, and summation of data from multiple sources. The analysts have presented the various facets of the market with a particular focus on identifying the key industry influencers. The data thus presented is comprehensive, reliable, and the result of extensive research, both primary and secondary.

              INFORMATION SOURCES

              Primary sources

              • Manufacturers and suppliers
              • Channel partners
              • Industry experts
              • Strategic decision makers

              Secondary sources

              • Industry journals and periodicals
              • Government data
              • Financial reports of key industry players
              • Historical data
              • Press releases

              DATA ANALYSIS

              Data Synthesis

              • Collation of data
              • Estimation of key figures
              • Analysis of derived insights

              Data Validation

              • Triangulation with data models
              • Reference against proprietary databases
              • Corroboration with industry experts

              REPORT WRITING

              Qualitative

              • Market drivers
              • Market challenges
              • Market trends
              • Five forces analysis

              Quantitative

              • Market size and forecast
              • Market segmentation
              • Geographical insights
              • Competitive landscape

              Interested in this report?

              Get your sample now to see our research methodology and insights!

              Download Now

              Frequently Asked Questions

              Screenless Display market growth will increase by $ 14868.4 mn during 2024-2028.

              The Screenless Display market is expected to grow at a CAGR of 46.02% during 2024-2028.

              Screenless Display market is segmented by Technology( Visual image, Retinal display, Synaptic interface) Application( Automotive, Consumer electronics, Aerospace and defense, Healthcare, Commercial)

              Avegant Corp., BAE Systems Plc, Eon Reality Inc., Holoxica Ltd., Leia Display System, Magic Leap Inc., Microsoft Corp., RealView Imaging Ltd., Robert Bosch GmbH, SeeReal Technologies SA, Sony Group Corp. are a few of the key vendors in the Screenless Display market.

              North America will register the highest growth rate of 42% among the other regions. Therefore, the Screenless Display market in North America is expected to garner significant business opportunities for the vendors during the forecast period.

              US, Germany, Canada, China, UK

              • Rising demand for more convenient and portable display solutionsThe global screenless display market is witnessing a significant increase in demand due to the rising need for more convenient and portable display solutions. This trend is driven by various factors is the driving factor this market.
              • such as the increasing popularity of wearable technology is the driving factor this market.
              • the growing preference for immersive entertainment experiences is the driving factor this market.
              • and the need for advanced visualization solutions in industries such as healthcare and automotive. One of the major factors is the rising demand for wearable technology. With the advent of smartwatches is the driving factor this market.
              • fitness trackers is the driving factor this market.
              • and AR glasses is the driving factor this market.
              • consumers are relying more on screenless displays to conveniently access information and interact with devices. For instance is the driving factor this market.
              • smartwatches offer users the ability to check notifications is the driving factor this market.
              • make calls is the driving factor this market.
              • and track their fitness activities without the need for a traditional screen. This allows for greater portability and ease of use is the driving factor this market.
              • making screenless displays a preferred choice for many consumers. In addition to wearable technology is the driving factor this market.
              • the demand for screenless displays is also driven by the desire for immersive entertainment experiences. Virtual reality (VR) headsets is the driving factor this market.
              • which utilize screenless display technology is the driving factor this market.
              • provide users with a more immersive and interactive gaming and entertainment experience. By eliminating the need for a physical screen is the driving factor this market.
              • VR headsets allow users to feel fully immersed in a virtual environment is the driving factor this market.
              • enhancing the overall entertainment experience. This has led to a surge in demand for VR headsets and other screenless display solutions among gaming enthusiasts and entertainment seekers. Furthermore is the driving factor this market.
              • various industries is the driving factor this market.
              • such as healthcare and automotive is the driving factor this market.
              • are increasingly adopting screenless display solutions to enhance visualization and improve productivity. In the healthcare sector is the driving factor this market.
              • screenless displays are used for medical imaging and surgical visualization is the driving factor this market.
              • allowing doctors to view patient data and perform complex procedures with precision and efficiency. Similarly is the driving factor this market.
              • in the automotive industry is the driving factor this market.
              • screenless HUD systems are used to project essential information such as speed is the driving factor this market.
              • navigation directions is the driving factor this market.
              • and vehicle status onto the windshield is the driving factor this market.
              • eliminating the need for drivers to take their eyes off the road. This improves safety and convenience for drivers is the driving factor this market.
              • leading to a rising demand for screenless HUDs in the automotive industry. Thus is the driving factor this market.
              • the above-mentioned factors are expected to increase the demand for screenless displays is the driving factor this market.
              • which will propel the growth of the global screenless display market during the forecast period. is the driving factor this market.

              The Screenless Display market vendors should focus on grabbing business opportunities from the Visual image segment as it accounted for the largest market share in the base year.
              RIA - Research AI Assistant
              Ask RIA