Secondary Tickets Market Analysis, Size, and Forecast 2026-2030: North America (US, Canada, and Mexico), APAC (China, India, and Japan), Europe (UK, Germany, and France), South America (Brazil and Argentina), Middle East and Africa (Saudi Arabia, UAE, and South Africa), and Rest of World (ROW)

Secondary Tickets Market Analysis, Size, and Forecast 2026-2030:
North America (US, Canada, and Mexico), APAC (China, India, and Japan), Europe (UK, Germany, and France), South America (Brazil and Argentina), Middle East and Africa (Saudi Arabia, UAE, and South Africa), and Rest of World (ROW)

Published: May 2026 291 Pages SKU: IRTNTR40016

Market Overview at a Glance

$172.47 B
Market Opportunity
30.7%
CAGR 2025 - 2030
52.5%
North America Growth
$24.77 B
Sports events segment 2024

Secondary Tickets Market Size 2026-2030

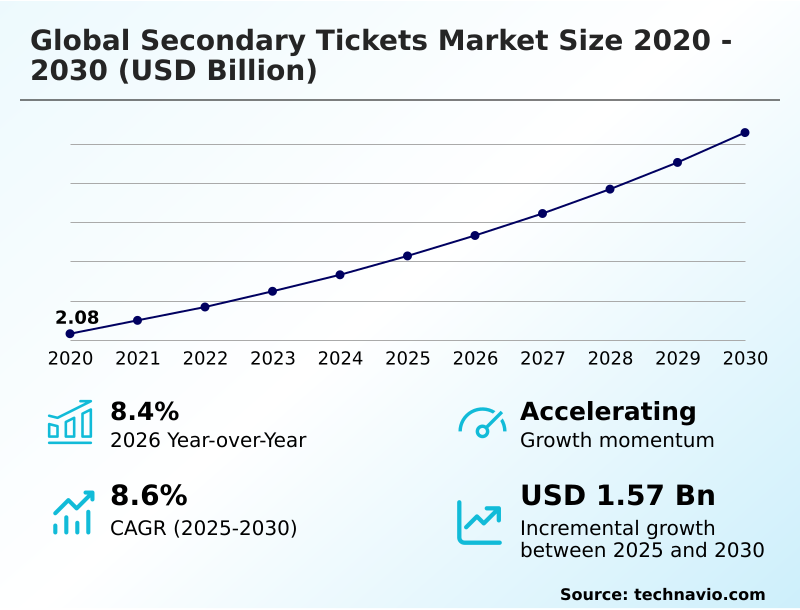
The secondary tickets market size is valued to increase by USD 172.47 billion, at a CAGR of 30.7% from 2025 to 2030. Proliferation of online and mobile ticketing platforms will drive the secondary tickets market.

Major Market Trends & Insights

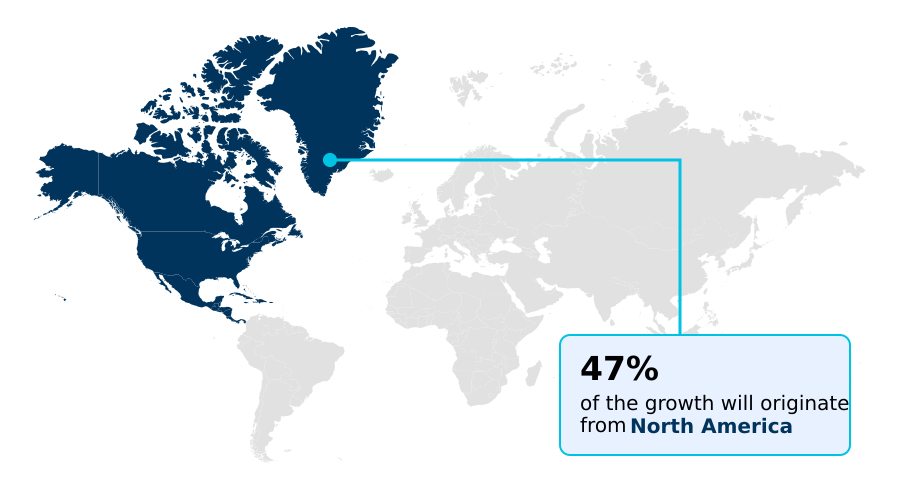
  • North America dominated the market and accounted for a 52.5% growth during the forecast period.
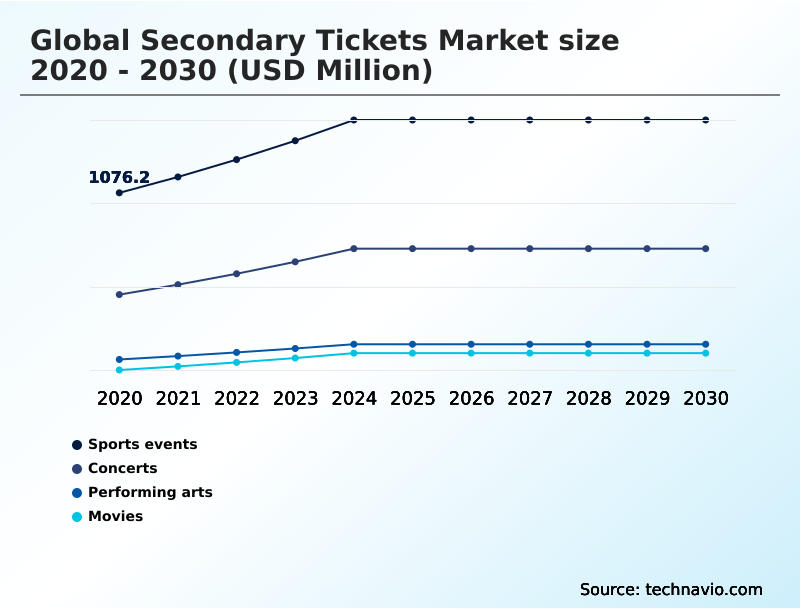
  • By Type - Sports events segment was valued at USD 24.77 billion in 2024
  • By Mode of Booking - Online segment accounted for the largest market revenue share in 2024

Market Size & Forecast

  • Market Opportunities: USD 225.67 billion
  • Market Future Opportunities: USD 172.47 billion
  • CAGR from 2025 to 2030 : 30.7%

Market Summary

  • The Secondary Tickets Market operates on the core principles of supply and demand, facilitated by a digital transformation that has shifted transactions to sophisticated online platforms. This evolution is driven by a strong consumer preference for experiential consumption, where access to high-demand events is paramount.
  • A key trend shaping the industry is the integration of advanced technologies to enhance security and transparency. For instance, the use of blockchain ticketing and non-fungible tokens (NFTs) is gaining traction to combat counterfeit tickets and provide verifiable ticket lifecycle management. A primary challenge remains the activity of ticket-buying bots that distort the primary market.
  • In a common business scenario, a platform leverages AI for ticket demand forecasting to anticipate bot activity for a major concert tour. It then deploys dynamic pricing models and real-time adjustments, while ensuring compliance with consumer protection mandates in various jurisdictions.
  • This data-driven approach allows the platform to optimize inventory, maintain market efficiency, and build consumer trust in a highly competitive environment where regulatory oversight is intensifying.

What will be the Size of the Secondary Tickets Market during the forecast period?

Get Key Insights on Market Forecast (PDF) Request Free Sample

How is the Secondary Tickets Market Segmented?

The secondary tickets industry research report provides comprehensive data (region-wise segment analysis), with forecasts and estimates in "USD million" for the period 2026-2030, as well as historical data from 2020-2024 for the following segments.

  • Type
    • Sports events
    • Concerts
    • Performing arts
    • Movies
  • Mode of booking
    • Online
    • Offline
  • Product type
    • Reserved seating
    • General admission
    • VIP tickets
  • Geography
    • North America
      • US
      • Canada
      • Mexico
    • APAC
      • China
      • India
      • Japan
    • Europe
      • UK
      • Germany
      • France
    • South America
      • Brazil
      • Argentina
    • Middle East and Africa
      • Saudi Arabia
      • UAE
      • South Africa
    • Rest of World (ROW)

By Type Insights

The sports events segment is estimated to witness significant growth during the forecast period.

The sports events segment thrives on high-demand events, where the value of an undifferentiated product is dictated by market variables. In this space, dynamic pricing algorithms are critical for navigating price transparency and fan fairness and transparency.

The market is defined by intense consumer passion, where over 70% of tickets for major league games are transacted in the secondary market, creating a persistent challenge with ticket scalping.

Efforts to implement consumer protection mandates, such as a resale price cap, contend with the fan desire for exclusive access.

Technologies like dynamic QR codes are being deployed to manage entry and combat unauthorized resale, balancing the principles of the primary market with the realities of the secondary market, and distinguishing from virtual reality experiences.

Request Free Sample

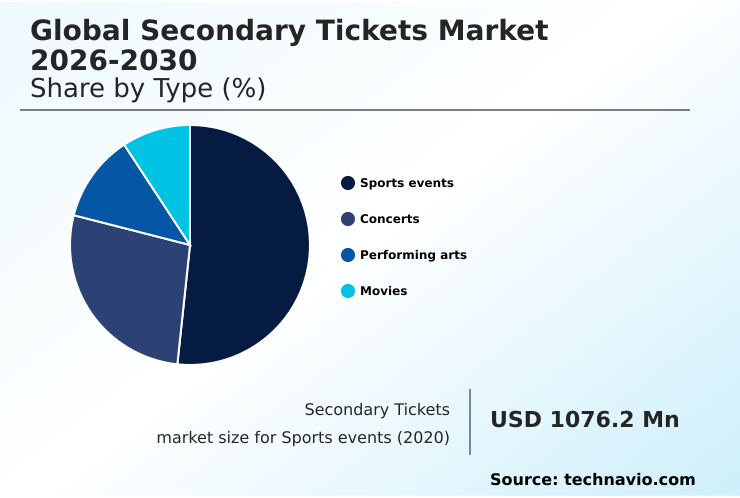
The Sports events segment was valued at USD 24.77 billion in 2024 and showed a gradual increase during the forecast period.

Request Free Sample

Regional Analysis

North America is estimated to contribute 52.5% to the growth of the global market during the forecast period.Technavio’s analysts have elaborately explained the regional trends and drivers that shape the market during the forecast period.

See How Secondary Tickets Market Demand is Rising in North America Request Free Sample

The geographic distribution of the market is characterized by North America's dominance, which accounts for over 52% of the incremental growth, and APAC's position as the fastest-growing region.

This expansion is fueled by event-driven tourism and a strong live event culture. In mature markets, platforms leverage network effects and verified fan programs to manage secondary market inventory for premium seating and VIP packages.

A key strategy to combat speculative ticketing is the adoption of real-name registration systems, which have reduced unauthorized listings by up to 40% in pilot programs. Concurrently, the move toward all-in pricing enhances ticket lifecycle management.

The success of fan-to-fan exchanges, which see 25% higher user satisfaction than open marketplaces, highlights a shift toward community-focused and transparent resale models.

Market Dynamics

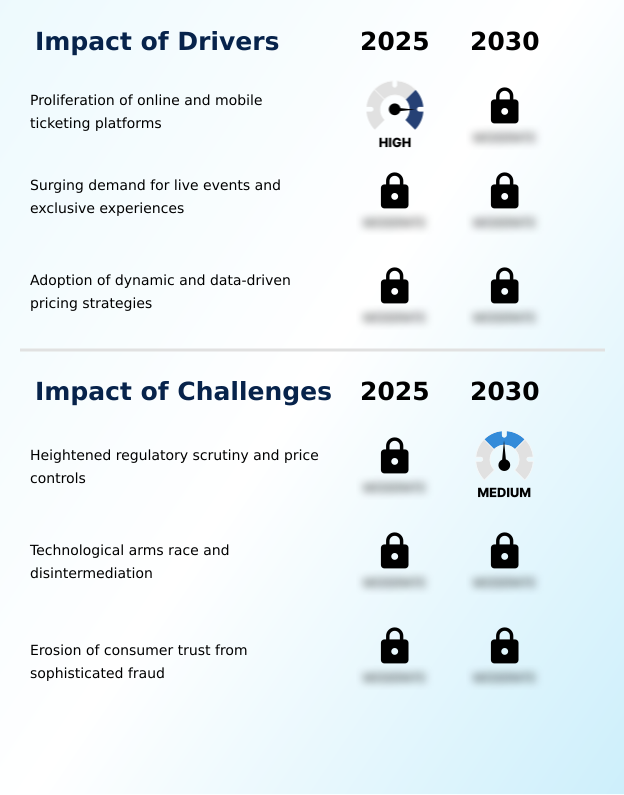
Our researchers analyzed the data with 2025 as the base year, along with the key drivers, trends, and challenges. A holistic analysis of drivers will help companies refine their marketing strategies to gain a competitive advantage.

  • The evolution of the secondary tickets market is increasingly defined by a technological arms race focused on security and transparency. The adoption of blockchain technology for ticket security is fundamental, with platforms preventing fraud with NFT tickets to create verifiable, unique assets. This is complemented by secure QR code ticket verification at venues.
  • Pricing dynamics are being reshaped by the sophisticated use of dynamic pricing for live events, often leveraging AI for ticket demand forecasting and analyzing real-time social media sentiment. This data-driven approach directly conflicts with the growing trend of regulating secondary ticket resale prices, where the impact of price caps on resellers is a major concern.
  • The legal framework for ticket scalping is tightening globally, with a focus on the impact of bots on ticket sales and navigating state-level BOTS Act enforcement. Fan-to-fan resale platform benefits, such as lower fees and enhanced community trust, offer a compelling alternative to traditional models.
  • Firms are now managing ticket inventory with AI, a method that has proven to be 20% more efficient than manual processes. The distinction between online vs offline ticket booking is becoming starker, with the role of social media in ticket resale adding complexity.
  • Furthermore, the challenges of mobile-only ticketing are being addressed by authenticating tickets with smart contracts, ensuring transparency in secondary ticket pricing and secure VIP package resale authentication, thereby improving consumer protection in ticket resale.

What are the key market drivers leading to the rise in the adoption of Secondary Tickets Industry?

  • The proliferation of online and mobile ticketing platforms serves as a key driver, expanding market accessibility and streamlining transactions for consumers worldwide.

  • Market growth is significantly driven by the proliferation of digital platforms and a cultural shift towards experiential consumption.
  • The convenience of the online marketplace, featuring secure payment gateways and interactive seat maps, has dramatically improved market accessibility and the overall user experience. This digital ecosystem supports robust ticket inventory management and facilitates seamless digital ticket transfer.
  • Mobile-only tickets are increasingly popular, with platforms reporting a 30% higher engagement rate on mobile compared to desktop. This is fueled by a strong live event culture and rising consumer spending on unique experiences.
  • The resulting supply and demand dynamics in a global, accessible marketplace continue to propel expansion, with digital marketplaces solidifying their role as the primary channel for transactions.

What are the market trends shaping the Secondary Tickets Industry?

  • The increasing integration of artificial intelligence and sophisticated dynamic pricing models is a primary trend. This is fundamentally reshaping how tickets are valued and transacted in the secondary market.

  • Key market trends revolve around the adoption of advanced technologies to enhance security and market efficiency. The integration of blockchain ticketing and non-fungible tokens (NFTs) is a significant development, creating a unique digital asset for each entry that builds consumer trust. In pilot programs, this technology has reduced fraudulent ticket incidents by over 95%.
  • AI-driven fraud detection systems, employing advanced algorithms, are becoming standard on authorized resale platforms, further bolstering security. Additionally, predictive pricing tools are empowering a more tech-savvy consumer base to make informed purchasing decisions, while smart contracts are enabling functionalities like automated face-value resale.
  • These innovations create a more transparent environment, improving market efficiency and offering a viable alternative to less secure live streaming services.

What challenges does the Secondary Tickets Industry face during its growth?

  • Heightened regulatory scrutiny and the implementation of price controls present a significant challenge, impacting the operational models and profitability of the secondary ticketing industry.

  • The market faces significant challenges from heightened regulatory scrutiny and the persistent threat of fraud. Governments are increasingly targeting ticket-buying bots and implementing rules that challenge the high profit margins of resellers. These regulations, combined with the efforts of primary ticket issuers and event organizers to establish closed-loop systems, threaten to disintermediate traditional platforms.
  • In response, platforms are investing heavily in buyer guarantee programs and money-back guarantees to build brand awareness and counter the risk of counterfeit tickets prevalent in informal resale channels.
  • The operational costs of compliance and fraud prevention have increased by over 20% in heavily regulated regions, squeezing profitability and forcing innovation in business models to stay competitive against less secure in-person exchanges.

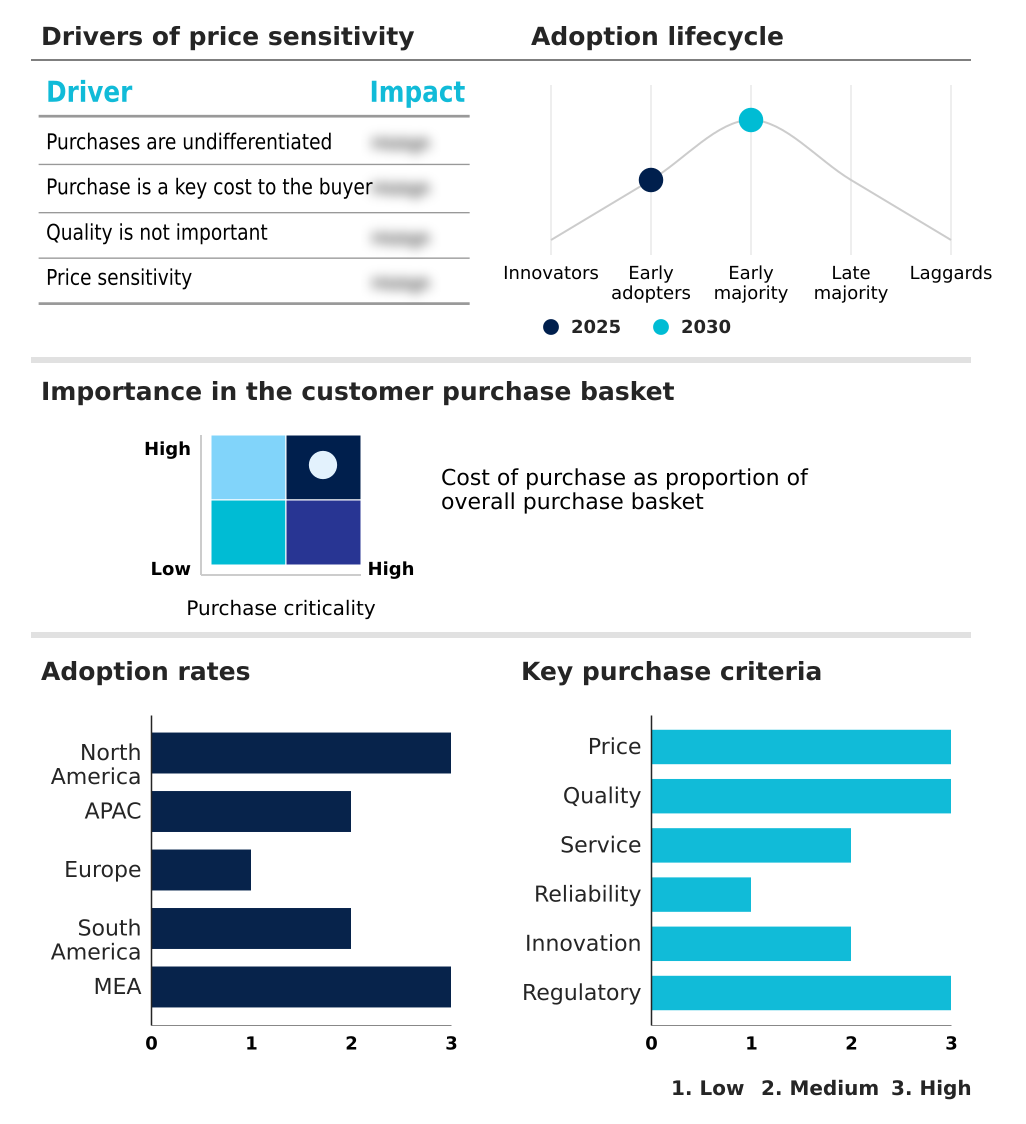
Exclusive Technavio Analysis on Customer Landscape

The secondary tickets market forecasting report includes the adoption lifecycle of the market, covering from the innovator’s stage to the laggard’s stage. It focuses on adoption rates in different regions based on penetration. Furthermore, the secondary tickets market report also includes key purchase criteria and drivers of price sensitivity to help companies evaluate and develop their market growth analysis strategies.

Customer Landscape of Secondary Tickets Industry

Competitive Landscape

Companies are implementing various strategies, such as strategic alliances, secondary tickets market forecast, partnerships, mergers and acquisitions, geographical expansion, and product/service launches, to enhance their presence in the industry.

Ace Ticket LLC - Provides reliable access to in-demand sports, concert, and theater events through a marketplace built on local expertise and guaranteed fulfillment.

The industry research and growth report includes detailed analyses of the competitive landscape of the market and information about key companies, including:

  • Ace Ticket LLC
  • AEG Worldwide
  • eBay Inc.
  • Eventbee Inc.
  • Eventbrite Inc.
  • Live Nation
  • On Location Events LLC
  • SeatGeek Inc.
  • StubHub Holdings Inc.
  • Ticket City Inc.
  • TicketNetwork Inc.
  • TickPick LLC
  • TiqIQ LLC
  • Twickets Ltd.
  • Viagogo Entertainment Inc.
  • Vivid Seats Inc.

Qualitative and quantitative analysis of companies has been conducted to help clients understand the wider business environment as well as the strengths and weaknesses of key industry players. Data is qualitatively analyzed to categorize companies as pure play, category-focused, industry-focused, and diversified; it is quantitatively analyzed to categorize companies as dominant, leading, strong, tentative, and weak.

Recent Development and News in Secondary tickets market

  • In May, 2025, SeatGeek announced it would display all-in prices, including fees, by default for all events on its platform, a strategic shift aimed at improving price transparency for consumers.
  • In April, 2025, a coalition of city officials and local venues in Washington D.C. announced the RESALE Amendment Act of 2025, proposing new limitations including price caps and registration requirements for high-volume sellers on the secondary market.
  • In March, 2025, a United States Presidential Executive Order was signed directing the Federal Trade Commission to intensify its enforcement of the Better Online Ticket Sales (BOTS) Act, signaling a federal crackdown on the use of automated software to acquire tickets for resale.
  • In February, 2025, lawmakers in South Korea proposed amendments to the Public Performance Act, aiming to criminalize ticket scalping for profit regardless of whether automated bots were used, expanding previous regulations.

Dive into Technavio’s robust research methodology, blending expert interviews, extensive data synthesis, and validated models for unparalleled Secondary Tickets Market insights. See full methodology.

Market Scope
Page number 291
Base year 2025
Historic period 2020-2024
Forecast period 2026-2030
Growth momentum & CAGR Accelerate at a CAGR of 30.7%
Market growth 2026-2030 USD 172465.5 million
Market structure Fragmented
YoY growth 2025-2026(%) 26.6%
Key countries US, Canada, Mexico, China, India, Japan, Australia, South Korea, Indonesia, UK, Germany, France, Spain, Italy, The Netherlands, Brazil, Argentina, Chile, Saudi Arabia, UAE, South Africa, Egypt and Turkey
Competitive landscape Leading Companies, Market Positioning of Companies, Competitive Strategies, and Industry Risks

Request Free Sample

Research Analyst Overview

  • The secondary tickets market is evolving from a simple transactional space into a technologically sophisticated ecosystem. The core of this transformation involves a continuous battle against ticket scalping and counterfeit tickets, addressed by integrating technologies like blockchain ticketing, identity-linked digital tickets, and holographic verification.
  • The use of dynamic pricing algorithms and predictive pricing tools has become standard for ticket inventory management, allowing platforms to react to market signals for high-demand events. In a notable shift, platforms adopting all-in pricing have seen a 10% uplift in customer conversion rates, underscoring the market's demand for price transparency.
  • Concurrently, heightened regulatory scrutiny is forcing a move toward greater fan fairness and transparency through consumer protection mandates and mechanisms like fan-to-fan exchanges and face-value resale options. This is compelling event organizers to re-evaluate their control over the ticket lifecycle management, balancing it against the open market facilitated by peer-to-peer resale.
  • The adoption of smart contracts and real-name registration systems further aims to regulate digital ticket transfers, creating a more secure user experience within the online marketplace.

What are the Key Data Covered in this Secondary Tickets Market Research and Growth Report?

  • What is the expected growth of the Secondary Tickets Market between 2026 and 2030?

    • USD 172.47 billion, at a CAGR of 30.7%

  • What segmentation does the market report cover?

    • The report is segmented by Type (Sports events, Concerts, Performing arts, and Movies), Mode of Booking (Online, and Offline), Product Type (Reserved seating, General admission, and VIP tickets) and Geography (North America, APAC, Europe, South America, Middle East and Africa)

  • Which regions are analyzed in the report?

    • North America, APAC, Europe, South America and Middle East and Africa

  • What are the key growth drivers and market challenges?

    • Proliferation of online and mobile ticketing platforms, Heightened regulatory scrutiny and price controls

  • Who are the major players in the Secondary Tickets Market?

    • Ace Ticket LLC, AEG Worldwide, eBay Inc., Eventbee Inc., Eventbrite Inc., Live Nation, On Location Events LLC, SeatGeek Inc., StubHub Holdings Inc., Ticket City Inc., TicketNetwork Inc., TickPick LLC, TiqIQ LLC, Twickets Ltd., Viagogo Entertainment Inc. and Vivid Seats Inc.

Market Research Insights

  • The secondary tickets market is shaped by intense supply and demand dynamics, where market accessibility and consumer trust are pivotal. The rise of digital marketplaces has been instrumental, with online channels accounting for 86% of all transactions. This digital shift supports experiential consumption by providing access to high-demand events.
  • However, building brand awareness and ensuring fan fairness and transparency are crucial for sustained success. Platforms implementing comprehensive buyer guarantee programs have reported a 15% increase in repeat customer transactions. Moreover, an emphasis on price transparency, a key component of consumer protection mandates, has been shown to improve conversion rates by eliminating hidden fees.
  • The market's future relies on balancing high profit margins with robust security and a positive user experience, especially as informal resale channels continue to present competition and risk.

We can help! Our analysts can customize this secondary tickets market research report to meet your requirements.

Get in touch

1. Executive Summary

1.1 Market overview

Executive Summary - Chart on Market Overview
Executive Summary - Data Table on Market Overview
Executive Summary - Chart on Global Market Characteristics
Executive Summary - Chart on Market by Geography
Executive Summary - Chart on Market Segmentation by Type
Executive Summary - Chart on Market Segmentation by Mode of Booking
Executive Summary - Chart on Market Segmentation by Product Type
Executive Summary - Chart on Incremental Growth
Executive Summary - Data Table on Incremental Growth
Executive Summary - Chart on Company Market Positioning

2. Technavio Analysis

2.1 Analysis of price sensitivity, lifecycle, customer purchase basket, adoption rates, and purchase criteria

2.2 Criticality of inputs and Factors of differentiation

Chart on Overview on criticality of inputs and factors of differentiation

2.3 Factors of disruption

Chart on Overview on factors of disruption

2.4 Impact of drivers and challenges

Chart on Impact of drivers and challenges in 2025 and 2030

3. Market Landscape

3.1 Market ecosystem

Chart on Parent Market
Data Table on - Parent Market

3.2 Market characteristics

Chart on Market characteristics analysis

3.3 Value chain analysis

Chart on Value chain analysis

4. Market Sizing

4.1 Market definition

Data Table on Offerings of companies included in the market definition

4.2 Market segment analysis

Market segments

4.3 Market size 2025

4.4 Market outlook: Forecast for 2025-2030

Chart on Global - Market size and forecast 2025-2030 ($ million)
Data Table on Global - Market size and forecast 2025-2030 ($ million)
Chart on Global Market: Year-over-year growth 2025-2030 (%)
Data Table on Global Market: Year-over-year growth 2025-2030 (%)

5. Historic Market Size

5.1 Global Secondary Tickets Market 2020 - 2024

Historic Market Size - Data Table on Global Secondary Tickets Market 2020 - 2024 ($ million)

5.2 Type segment analysis 2020 - 2024

Historic Market Size - Type Segment 2020 - 2024 ($ million)

5.3 Mode of Booking segment analysis 2020 - 2024

Historic Market Size - Mode of Booking Segment 2020 - 2024 ($ million)

5.4 Product Type segment analysis 2020 - 2024

Historic Market Size - Product Type Segment 2020 - 2024 ($ million)

5.5 Geography segment analysis 2020 - 2024

Historic Market Size - Geography Segment 2020 - 2024 ($ million)

5.6 Country segment analysis 2020 - 2024

Historic Market Size - Country Segment 2020 - 2024 ($ million)

6. Qualitative Analysis

6.1 Impact of AI in Global Secondary Tickets Market

6.2 Impact of Geopolitical Conflicts on Global Secondary Tickets Market

7. Five Forces Analysis

7.1 Five forces summary

Five forces analysis - Comparison between 2025 and 2030

7.2 Bargaining power of buyers

Bargaining power of buyers - Impact of key factors 2025 and 2030

7.3 Bargaining power of suppliers

Bargaining power of suppliers - Impact of key factors in 2025 and 2030

7.4 Threat of new entrants

Threat of new entrants - Impact of key factors in 2025 and 2030

7.5 Threat of substitutes

Threat of substitutes - Impact of key factors in 2025 and 2030

7.6 Threat of rivalry

Threat of rivalry - Impact of key factors in 2025 and 2030

7.7 Market condition

Chart on Market condition - Five forces 2025 and 2030

8. Market Segmentation by Type

8.1 Market segments

Chart on Type - Market share 2025-2030 (%)
Data Table on Type - Market share 2025-2030 (%)

8.2 Comparison by Type

Chart on Comparison by Type
Data Table on Comparison by Type

8.3 Sports events - Market size and forecast 2025-2030

Chart on Sports events - Market size and forecast 2025-2030 ($ million)
Data Table on Sports events - Market size and forecast 2025-2030 ($ million)
Chart on Sports events - Year-over-year growth 2025-2030 (%)
Data Table on Sports events - Year-over-year growth 2025-2030 (%)

8.4 Concerts - Market size and forecast 2025-2030

Chart on Concerts - Market size and forecast 2025-2030 ($ million)
Data Table on Concerts - Market size and forecast 2025-2030 ($ million)
Chart on Concerts - Year-over-year growth 2025-2030 (%)
Data Table on Concerts - Year-over-year growth 2025-2030 (%)

8.5 Performing arts - Market size and forecast 2025-2030

Chart on Performing arts - Market size and forecast 2025-2030 ($ million)
Data Table on Performing arts - Market size and forecast 2025-2030 ($ million)
Chart on Performing arts - Year-over-year growth 2025-2030 (%)
Data Table on Performing arts - Year-over-year growth 2025-2030 (%)

8.6 Movies - Market size and forecast 2025-2030

Chart on Movies - Market size and forecast 2025-2030 ($ million)
Data Table on Movies - Market size and forecast 2025-2030 ($ million)
Chart on Movies - Year-over-year growth 2025-2030 (%)
Data Table on Movies - Year-over-year growth 2025-2030 (%)

8.7 Market opportunity by Type

Market opportunity by Type ($ million)
Data Table on Market opportunity by Type ($ million)

9. Market Segmentation by Mode of Booking

9.1 Market segments

Chart on Mode of Booking - Market share 2025-2030 (%)
Data Table on Mode of Booking - Market share 2025-2030 (%)

9.2 Comparison by Mode of Booking

Chart on Comparison by Mode of Booking
Data Table on Comparison by Mode of Booking

9.3 Online - Market size and forecast 2025-2030

Chart on Online - Market size and forecast 2025-2030 ($ million)
Data Table on Online - Market size and forecast 2025-2030 ($ million)
Chart on Online - Year-over-year growth 2025-2030 (%)
Data Table on Online - Year-over-year growth 2025-2030 (%)

9.4 Offline - Market size and forecast 2025-2030

Chart on Offline - Market size and forecast 2025-2030 ($ million)
Data Table on Offline - Market size and forecast 2025-2030 ($ million)
Chart on Offline - Year-over-year growth 2025-2030 (%)
Data Table on Offline - Year-over-year growth 2025-2030 (%)

9.5 Market opportunity by Mode of Booking

Market opportunity by Mode of Booking ($ million)
Data Table on Market opportunity by Mode of Booking ($ million)

10. Market Segmentation by Product Type

10.1 Market segments

Chart on Product Type - Market share 2025-2030 (%)
Data Table on Product Type - Market share 2025-2030 (%)

10.2 Comparison by Product Type

Chart on Comparison by Product Type
Data Table on Comparison by Product Type

10.3 Reserved seating - Market size and forecast 2025-2030

Chart on Reserved seating - Market size and forecast 2025-2030 ($ million)
Data Table on Reserved seating - Market size and forecast 2025-2030 ($ million)
Chart on Reserved seating - Year-over-year growth 2025-2030 (%)
Data Table on Reserved seating - Year-over-year growth 2025-2030 (%)

10.4 General admission - Market size and forecast 2025-2030

Chart on General admission - Market size and forecast 2025-2030 ($ million)
Data Table on General admission - Market size and forecast 2025-2030 ($ million)
Chart on General admission - Year-over-year growth 2025-2030 (%)
Data Table on General admission - Year-over-year growth 2025-2030 (%)

10.5 VIP tickets - Market size and forecast 2025-2030

Chart on VIP tickets - Market size and forecast 2025-2030 ($ million)
Data Table on VIP tickets - Market size and forecast 2025-2030 ($ million)
Chart on VIP tickets - Year-over-year growth 2025-2030 (%)
Data Table on VIP tickets - Year-over-year growth 2025-2030 (%)

10.6 Market opportunity by Product Type

Market opportunity by Product Type ($ million)
Data Table on Market opportunity by Product Type ($ million)

11. Customer Landscape

11.1 Customer landscape overview

Analysis of price sensitivity, lifecycle, customer purchase basket, adoption rates, and purchase criteria

12. Geographic Landscape

12.1 Geographic segmentation

Chart on Market share by geography 2025-2030 (%)
Data Table on Market share by geography 2025-2030 (%)

12.2 Geographic comparison

Chart on Geographic comparison
Data Table on Geographic comparison

12.3 North America - Market size and forecast 2025-2030

Chart on North America - Market size and forecast 2025-2030 ($ million)
Data Table on North America - Market size and forecast 2025-2030 ($ million)
Chart on North America - Year-over-year growth 2025-2030 (%)
Data Table on North America - Year-over-year growth 2025-2030 (%)
Chart on Regional Comparison - North America
Data Table on Regional Comparison - North America

12.3.1 US - Market size and forecast 2025-2030

Chart on US - Market size and forecast 2025-2030 ($ million)
Data Table on US - Market size and forecast 2025-2030 ($ million)
Chart on US - Year-over-year growth 2025-2030 (%)
Data Table on US - Year-over-year growth 2025-2030 (%)

12.3.2 Canada - Market size and forecast 2025-2030

Chart on Canada - Market size and forecast 2025-2030 ($ million)
Data Table on Canada - Market size and forecast 2025-2030 ($ million)
Chart on Canada - Year-over-year growth 2025-2030 (%)
Data Table on Canada - Year-over-year growth 2025-2030 (%)

12.3.3 Mexico - Market size and forecast 2025-2030

Chart on Mexico - Market size and forecast 2025-2030 ($ million)
Data Table on Mexico - Market size and forecast 2025-2030 ($ million)
Chart on Mexico - Year-over-year growth 2025-2030 (%)
Data Table on Mexico - Year-over-year growth 2025-2030 (%)

12.4 APAC - Market size and forecast 2025-2030

Chart on APAC - Market size and forecast 2025-2030 ($ million)
Data Table on APAC - Market size and forecast 2025-2030 ($ million)
Chart on APAC - Year-over-year growth 2025-2030 (%)
Data Table on APAC - Year-over-year growth 2025-2030 (%)
Chart on Regional Comparison - APAC
Data Table on Regional Comparison - APAC

12.4.1 China - Market size and forecast 2025-2030

Chart on China - Market size and forecast 2025-2030 ($ million)
Data Table on China - Market size and forecast 2025-2030 ($ million)
Chart on China - Year-over-year growth 2025-2030 (%)
Data Table on China - Year-over-year growth 2025-2030 (%)

12.4.2 India - Market size and forecast 2025-2030

Chart on India - Market size and forecast 2025-2030 ($ million)
Data Table on India - Market size and forecast 2025-2030 ($ million)
Chart on India - Year-over-year growth 2025-2030 (%)
Data Table on India - Year-over-year growth 2025-2030 (%)

12.4.3 Japan - Market size and forecast 2025-2030

Chart on Japan - Market size and forecast 2025-2030 ($ million)
Data Table on Japan - Market size and forecast 2025-2030 ($ million)
Chart on Japan - Year-over-year growth 2025-2030 (%)
Data Table on Japan - Year-over-year growth 2025-2030 (%)

12.4.4 Australia - Market size and forecast 2025-2030

Chart on Australia - Market size and forecast 2025-2030 ($ million)
Data Table on Australia - Market size and forecast 2025-2030 ($ million)
Chart on Australia - Year-over-year growth 2025-2030 (%)
Data Table on Australia - Year-over-year growth 2025-2030 (%)

12.4.5 South Korea - Market size and forecast 2025-2030

Chart on South Korea - Market size and forecast 2025-2030 ($ million)
Data Table on South Korea - Market size and forecast 2025-2030 ($ million)
Chart on South Korea - Year-over-year growth 2025-2030 (%)
Data Table on South Korea - Year-over-year growth 2025-2030 (%)

12.4.6 Indonesia - Market size and forecast 2025-2030

Chart on Indonesia - Market size and forecast 2025-2030 ($ million)
Data Table on Indonesia - Market size and forecast 2025-2030 ($ million)
Chart on Indonesia - Year-over-year growth 2025-2030 (%)
Data Table on Indonesia - Year-over-year growth 2025-2030 (%)

12.5 Europe - Market size and forecast 2025-2030

Chart on Europe - Market size and forecast 2025-2030 ($ million)
Data Table on Europe - Market size and forecast 2025-2030 ($ million)
Chart on Europe - Year-over-year growth 2025-2030 (%)
Data Table on Europe - Year-over-year growth 2025-2030 (%)
Chart on Regional Comparison - Europe
Data Table on Regional Comparison - Europe

12.5.1 UK - Market size and forecast 2025-2030

Chart on UK - Market size and forecast 2025-2030 ($ million)
Data Table on UK - Market size and forecast 2025-2030 ($ million)
Chart on UK - Year-over-year growth 2025-2030 (%)
Data Table on UK - Year-over-year growth 2025-2030 (%)

12.5.2 Germany - Market size and forecast 2025-2030

Chart on Germany - Market size and forecast 2025-2030 ($ million)
Data Table on Germany - Market size and forecast 2025-2030 ($ million)
Chart on Germany - Year-over-year growth 2025-2030 (%)
Data Table on Germany - Year-over-year growth 2025-2030 (%)

12.5.3 France - Market size and forecast 2025-2030

Chart on France - Market size and forecast 2025-2030 ($ million)
Data Table on France - Market size and forecast 2025-2030 ($ million)
Chart on France - Year-over-year growth 2025-2030 (%)
Data Table on France - Year-over-year growth 2025-2030 (%)

12.5.4 Spain - Market size and forecast 2025-2030

Chart on Spain - Market size and forecast 2025-2030 ($ million)
Data Table on Spain - Market size and forecast 2025-2030 ($ million)
Chart on Spain - Year-over-year growth 2025-2030 (%)
Data Table on Spain - Year-over-year growth 2025-2030 (%)

12.5.5 Italy - Market size and forecast 2025-2030

Chart on Italy - Market size and forecast 2025-2030 ($ million)
Data Table on Italy - Market size and forecast 2025-2030 ($ million)
Chart on Italy - Year-over-year growth 2025-2030 (%)
Data Table on Italy - Year-over-year growth 2025-2030 (%)

12.5.6 The Netherlands - Market size and forecast 2025-2030

Chart on The Netherlands - Market size and forecast 2025-2030 ($ million)
Data Table on The Netherlands - Market size and forecast 2025-2030 ($ million)
Chart on The Netherlands - Year-over-year growth 2025-2030 (%)
Data Table on The Netherlands - Year-over-year growth 2025-2030 (%)

12.6 South America - Market size and forecast 2025-2030

Chart on South America - Market size and forecast 2025-2030 ($ million)
Data Table on South America - Market size and forecast 2025-2030 ($ million)
Chart on South America - Year-over-year growth 2025-2030 (%)
Data Table on South America - Year-over-year growth 2025-2030 (%)
Chart on Regional Comparison - South America
Data Table on Regional Comparison - South America

12.6.1 Brazil - Market size and forecast 2025-2030

Chart on Brazil - Market size and forecast 2025-2030 ($ million)
Data Table on Brazil - Market size and forecast 2025-2030 ($ million)
Chart on Brazil - Year-over-year growth 2025-2030 (%)
Data Table on Brazil - Year-over-year growth 2025-2030 (%)

12.6.2 Argentina - Market size and forecast 2025-2030

Chart on Argentina - Market size and forecast 2025-2030 ($ million)
Data Table on Argentina - Market size and forecast 2025-2030 ($ million)
Chart on Argentina - Year-over-year growth 2025-2030 (%)
Data Table on Argentina - Year-over-year growth 2025-2030 (%)

12.6.3 Chile - Market size and forecast 2025-2030

Chart on Chile - Market size and forecast 2025-2030 ($ million)
Data Table on Chile - Market size and forecast 2025-2030 ($ million)
Chart on Chile - Year-over-year growth 2025-2030 (%)
Data Table on Chile - Year-over-year growth 2025-2030 (%)

12.7 Middle East and Africa - Market size and forecast 2025-2030

Chart on Middle East and Africa - Market size and forecast 2025-2030 ($ million)
Data Table on Middle East and Africa - Market size and forecast 2025-2030 ($ million)
Chart on Middle East and Africa - Year-over-year growth 2025-2030 (%)
Data Table on Middle East and Africa - Year-over-year growth 2025-2030 (%)
Chart on Regional Comparison - Middle East and Africa
Data Table on Regional Comparison - Middle East and Africa

12.7.1 Saudi Arabia - Market size and forecast 2025-2030

Chart on Saudi Arabia - Market size and forecast 2025-2030 ($ million)
Data Table on Saudi Arabia - Market size and forecast 2025-2030 ($ million)
Chart on Saudi Arabia - Year-over-year growth 2025-2030 (%)
Data Table on Saudi Arabia - Year-over-year growth 2025-2030 (%)

12.7.2 UAE - Market size and forecast 2025-2030

Chart on UAE - Market size and forecast 2025-2030 ($ million)
Data Table on UAE - Market size and forecast 2025-2030 ($ million)
Chart on UAE - Year-over-year growth 2025-2030 (%)
Data Table on UAE - Year-over-year growth 2025-2030 (%)

12.7.3 South Africa - Market size and forecast 2025-2030

Chart on South Africa - Market size and forecast 2025-2030 ($ million)
Data Table on South Africa - Market size and forecast 2025-2030 ($ million)
Chart on South Africa - Year-over-year growth 2025-2030 (%)
Data Table on South Africa - Year-over-year growth 2025-2030 (%)

12.7.4 Egypt - Market size and forecast 2025-2030

Chart on Egypt - Market size and forecast 2025-2030 ($ million)
Data Table on Egypt - Market size and forecast 2025-2030 ($ million)
Chart on Egypt - Year-over-year growth 2025-2030 (%)
Data Table on Egypt - Year-over-year growth 2025-2030 (%)

12.7.5 Turkey - Market size and forecast 2025-2030

Chart on Turkey - Market size and forecast 2025-2030 ($ million)
Data Table on Turkey - Market size and forecast 2025-2030 ($ million)
Chart on Turkey - Year-over-year growth 2025-2030 (%)
Data Table on Turkey - Year-over-year growth 2025-2030 (%)

12.8 Market opportunity by geography

Market opportunity by geography ($ million)
Data Tables on Market opportunity by geography ($ million)

13. Drivers, Challenges, and Opportunity

13.1 Market drivers

Proliferation of online and mobile ticketing platforms
Surging demand for live events and exclusive experiences
Adoption of dynamic and data-driven pricing strategies

13.2 Market challenges

Heightened regulatory scrutiny and price controls
Disintermediation of traditional resale platforms by making tickets non-transferable
Continuous threat of fraud, which significantly erodes consumer trust

13.3 Impact of drivers and challenges

Impact of drivers and challenges in 2025 and 2030

13.4 Market opportunities

Ascendancy of artificial intelligence and dynamic pricing
Intensified oversight and consumer protection mandates
Proliferation of blockchain and NFT ticketing for security

14. Competitive Landscape

14.1 Overview

14.2

Overview on criticality of inputs and factors of differentiation

14.3 Landscape disruption

Overview on factors of disruption

14.4 Industry risks

Impact of key risks on business

15. Competitive Analysis

15.1 Companies profiled

Companies covered

15.2 Company ranking index

15.3 Market positioning of companies

Matrix on companies position and classification

15.4 Ace Ticket LLC

Ace Ticket LLC - Overview
Ace Ticket LLC - Product / Service
Ace Ticket LLC - Key offerings
SWOT

15.5 AEG Worldwide

AEG Worldwide - Overview
AEG Worldwide - Product / Service
AEG Worldwide - Key offerings
SWOT

15.6 eBay Inc.

eBay Inc. - Overview
eBay Inc. - Product / Service
eBay Inc. - Key offerings
SWOT

15.7 Eventbee Inc.

Eventbee Inc. - Overview
Eventbee Inc. - Product / Service
Eventbee Inc. - Key offerings
SWOT

15.8 Eventbrite Inc.

Eventbrite Inc. - Overview
Eventbrite Inc. - Product / Service
Eventbrite Inc. - Key offerings
SWOT

15.9 Live Nation

Live Nation - Overview
Live Nation - Product / Service
Live Nation - Key offerings
SWOT

15.10 On Location Events LLC

On Location Events LLC - Overview
On Location Events LLC - Product / Service
On Location Events LLC - Key offerings
SWOT

15.11 SeatGeek Inc.

SeatGeek Inc. - Overview
SeatGeek Inc. - Product / Service
SeatGeek Inc. - Key offerings
SWOT

15.12 StubHub Holdings Inc.

StubHub Holdings Inc. - Overview
StubHub Holdings Inc. - Product / Service
StubHub Holdings Inc. - Key offerings
SWOT

15.13 Ticket City Inc.

Ticket City Inc. - Overview
Ticket City Inc. - Product / Service
Ticket City Inc. - Key offerings
SWOT

15.14 TicketNetwork Inc.

TicketNetwork Inc. - Overview
TicketNetwork Inc. - Product / Service
TicketNetwork Inc. - Key offerings
SWOT

15.15 TickPick LLC

TickPick LLC - Overview
TickPick LLC - Product / Service
TickPick LLC - Key offerings
SWOT

15.16 TiqIQ LLC

TiqIQ LLC - Overview
TiqIQ LLC - Product / Service
TiqIQ LLC - Key offerings
SWOT

15.17 Twickets Ltd.

Twickets Ltd. - Overview
Twickets Ltd. - Product / Service
Twickets Ltd. - Key offerings
SWOT

15.18 Viagogo Entertainment Inc.

Viagogo Entertainment Inc. - Overview
Viagogo Entertainment Inc. - Product / Service
Viagogo Entertainment Inc. - Key offerings
SWOT

16. Appendix

16.1 Scope of the report

Market definition
Objectives
Notes and caveats

16.2 Inclusions and exclusions checklist

Inclusions checklist
Exclusions checklist

16.3 Currency conversion rates for US$

16.4 Research methodology

16.5 Data procurement

Information sources

16.6 Data validation

16.7 Validation techniques employed for market sizing

16.8 Data synthesis

16.9 360 degree market analysis

16.10 List of abbreviations

Research Methodology

Technavio presents a detailed picture of the market by way of study, synthesis, and summation of data from multiple sources. The analysts have presented the various facets of the market with a particular focus on identifying the key industry influencers. The data thus presented is comprehensive, reliable, and the result of extensive research, both primary and secondary.

INFORMATION SOURCES

Primary sources

  • Manufacturers and suppliers
  • Channel partners
  • Industry experts
  • Strategic decision makers

Secondary sources

  • Industry journals and periodicals
  • Government data
  • Financial reports of key industry players
  • Historical data
  • Press releases

DATA ANALYSIS

Data Synthesis

  • Collation of data
  • Estimation of key figures
  • Analysis of derived insights

Data Validation

  • Triangulation with data models
  • Reference against proprietary databases
  • Corroboration with industry experts

REPORT WRITING

Qualitative

  • Market drivers
  • Market challenges
  • Market trends
  • Five forces analysis

Quantitative

  • Market size and forecast
  • Market segmentation
  • Geographical insights
  • Competitive landscape

Interested in this report?

Get your sample now to see our research methodology and insights!

Download Now

Frequently Asked Questions

Secondary Tickets market growth will increase by USD 172465.5 million during 2026-2030.

The Secondary Tickets market is expected to grow at a CAGR of 30.7% during 2026-2030.

Secondary Tickets market is segmented by Type (Sports events, Concerts, Performing arts, Movies) Mode of booking (Online, Offline) Product type (Reserved seating, General admission, VIP tickets)

Ace Ticket LLC, AEG Worldwide, eBay Inc., Eventbee Inc., Eventbrite Inc., Live Nation, On Location Events LLC, SeatGeek Inc., StubHub Holdings Inc., Ticket City Inc., TicketNetwork Inc., TickPick LLC, TiqIQ LLC, Twickets Ltd., Viagogo Entertainment Inc., Vivid Seats Inc. are a few of the key vendors in the Secondary Tickets market.

North America will register the highest growth rate of 52.5% among the other regions. Therefore, the Secondary Tickets market in North America is expected to garner significant business opportunities for the vendors during the forecast period.

US, Canada, Mexico, China, India, Japan, Australia, South Korea, Indonesia, UK, Germany, France, Spain, Italy, The Netherlands, Brazil, Argentina, Chile, Saudi Arabia, UAE, South Africa, Egypt, Turkey

  • Proliferation of online and mobile ticketing platforms is the driving factor this market.

The Secondary Tickets market vendors should focus on grabbing business opportunities from the Type segment as it accounted for the largest market share in the base year.
RIA - Research AI Assistant
Ask RIA