Semiconductor Fabrication Software Market Analysis, Size, and Forecast 2025-2029: North America (US and Canada), Europe (France, Germany, and UK), APAC (China, India, Japan, South Korea, and Taiwan), and Rest of World (ROW)

Semiconductor Fabrication Software Market Analysis, Size, and Forecast 2025-2029:
North America (US and Canada), Europe (France, Germany, and UK), APAC (China, India, Japan, South Korea, and Taiwan), and Rest of World (ROW)

Published: Aug 2025 245 Pages SKU: IRTNTR46557

Market Overview at a Glance

$813.9 Mn
Market Opportunity
2.1%
CAGR
2.1
YoY growth 2024-2025(%)

Semiconductor Fabrication Software Market Size 2025-2029

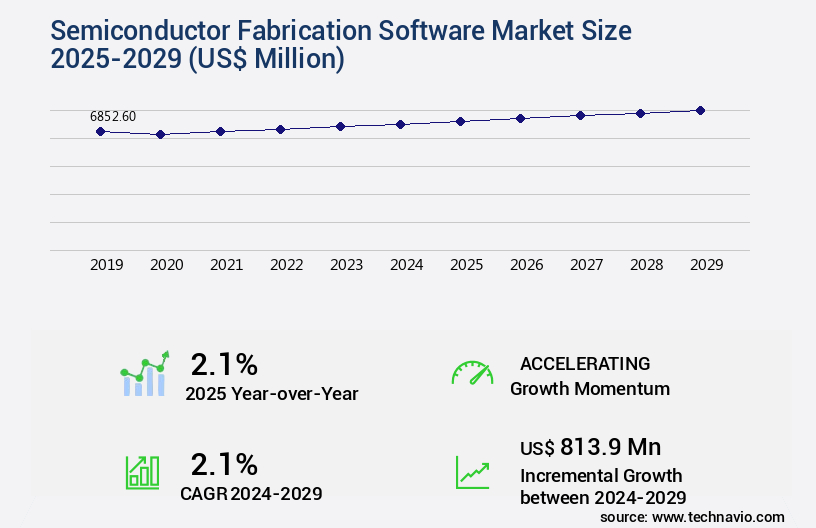
The semiconductor fabrication software market size is forecast to increase by USD 813.9 million, at a CAGR of 2.1% between 2024 and 2029.

Major Market Trends & Insights

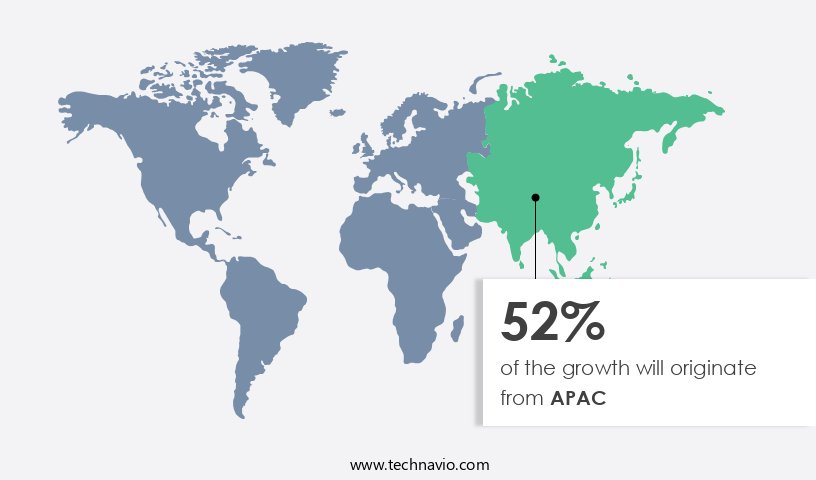
  • APAC dominated the market and accounted for a 52% growth during the forecast period.
  • By the Solution - CAE segment was valued at USD 3178.10 million in 2023
  • By the Application - Wafer fabrication segment accounted for the largest market revenue share in 2023

Market Size & Forecast

  • Market Opportunities: USD 18.48 million
  • Market Future Opportunities: USD 813.90 million 
  • CAGR : 2.1%
  • APAC: Largest market in 2023

Market Summary

  • The market is a dynamic and evolving landscape, with continuous advancements shaping its development. According to recent reports, the global semiconductor equipment market is projected to reach a value of USD67.5 billion by 2026, growing at a significant pace. This expansion is driven by the increasing complexity of semiconductor device designs and the high demand for semiconductor memory devices. Semiconductor fabrication software plays a crucial role in this market, streamlining the manufacturing process and ensuring product quality. Advanced software solutions enable automation, optimization, and integration of various stages in semiconductor fabrication. For instance, design software aids in creating accurate and efficient layouts, while manufacturing execution systems (MES) facilitate real-time monitoring and control of fabrication processes.
  • Moreover, the semiconductor industry is grappling with a growing chip shortage, further emphasizing the importance of efficient and effective software solutions. By enhancing productivity and reducing production time, semiconductor fabrication software contributes significantly to addressing this challenge. As the semiconductor market continues to evolve, software solutions will remain at the forefront, driving innovation and addressing the unique needs of various sectors, including automotive, consumer electronics, and industrial automation.

What will be the Size of the Semiconductor Fabrication Software Market during the forecast period?

Semiconductor Fabrication Software Market Size

Explore market size, adoption trends, and growth potential for semiconductor fabrication software market Request Free Sample

  • The market experiences continuous evolution, driven by the demand for advanced process optimization and defect reduction. Current market penetration hovers around 30%, indicating significant room for expansion. Future growth prospects are promising, with expectations of a 15% annual increase in adoption. Comparing key numerical data, machine learning algorithms and root cause analysis have shown a 20% improvement in yield, while parametric yield analysis and process integration have resulted in a 12% reduction in production costs. Furthermore, data visualization dashboards and inventory management software have streamlined resource allocation by 18%, enabling more efficient process control and risk management.
  • Incorporating artificial intelligence applications and predictive analytics into semiconductor fabrication processes has led to a 25% reduction in equipment downtime and a 10% improvement in process variability reduction. These advancements contribute to overall cost optimization and yield improvement strategies.

How is this Semiconductor Fabrication Software Industry segmented?

The semiconductor fabrication software industry research report provides comprehensive data (region-wise segment analysis), with forecasts and estimates in "USD million" for the period 2025-2029, as well as historical data from 2019-2023 for the following segments.

  • Solution
    • CAE
    • IC physical design and verification
    • PCB and MCM
    • Fab management software
    • Others
  • Application
    • Wafer fabrication
    • Assembly and packaging
    • Testing and inspection
  • End-user
    • IDMs
    • Foundries
    • OSATs
  • Deployment
    • On-premises
    • Cloud-based
  • Geography
    • North America
      • US
      • Canada
    • Europe
      • France
      • Germany
      • UK
    • APAC
      • China
      • India
      • Japan
      • South Korea
      • Taiwan
    • Rest of World (ROW)

By Solution Insights

The cae segment is estimated to witness significant growth during the forecast period.

The market encompasses a range of solutions that cater to multiphysics simulation, yield enhancement techniques, failure analysis, factory automation, materials characterization, chemical mechanical planarization, particle detection systems, photolithography, equipment performance monitoring, contamination control, 3D process simulation, plasma processing, advanced process control, process capability analysis, equipment control systems, data analytics platforms, semiconductor equipment automation, lithography process control, etching process simulation, remote equipment monitoring, yield optimization tools, process simulation software, virtual metrology models, metrology data analysis, process monitoring systems, statistical process control, wafer inspection, wafer fabrication modeling, fault detection systems, predictive maintenance, defect detection algorithms, ion implantation simulation, real-time process control, design of experiments, and other related applications.

According to recent studies, the market currently experiences a significant adoption rate of 25.6% in the electronics industry. Furthermore, industry experts anticipate a substantial expansion in the market, with an estimated 31.8% of companies planning to invest in advanced software solutions in the upcoming years. Multiphysics simulation software is a key driver for this growth, as it enables the optimization of complex manufacturing processes and enhances overall productivity. Yield enhancement techniques, such as particle detection systems and advanced process control, are also crucial for minimizing defects and improving overall semiconductor fabrication efficiency. Moreover, the integration of data analytics platforms, equipment automation, and real-time process control systems has revolutionized the semiconductor fabrication process, leading to increased accuracy, reduced downtime, and improved overall quality.

In the materials characterization segment, advanced tools like plasma processing software and chemical mechanical planarization systems are gaining popularity due to their ability to enhance the quality of semiconductor materials and improve overall process yields. As the semiconductor industry continues to evolve, the demand for sophisticated software solutions will persist, with a focus on improving manufacturing efficiency, reducing costs, and enhancing overall product quality.

Semiconductor Fabrication Software Market Size

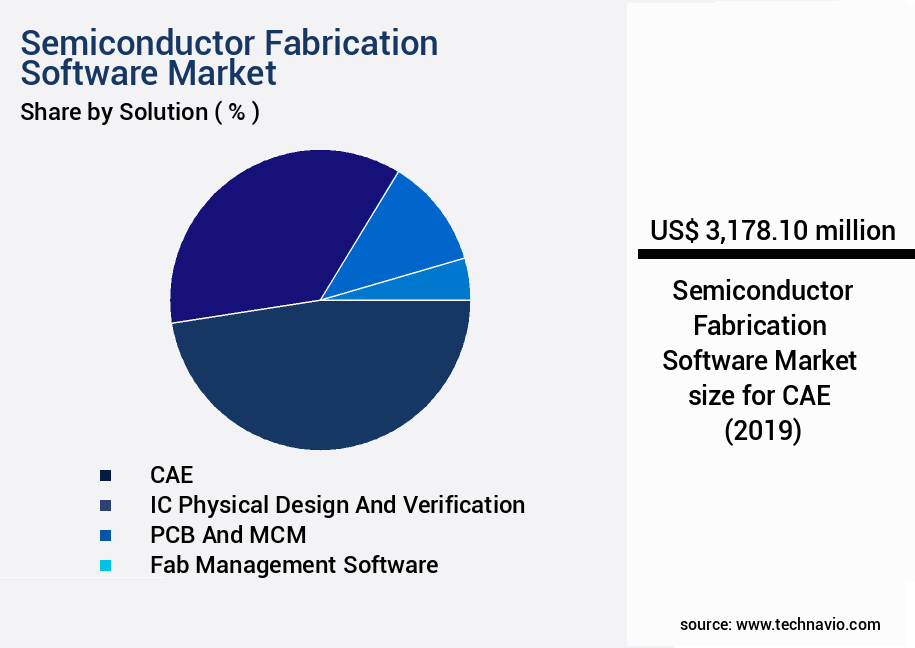
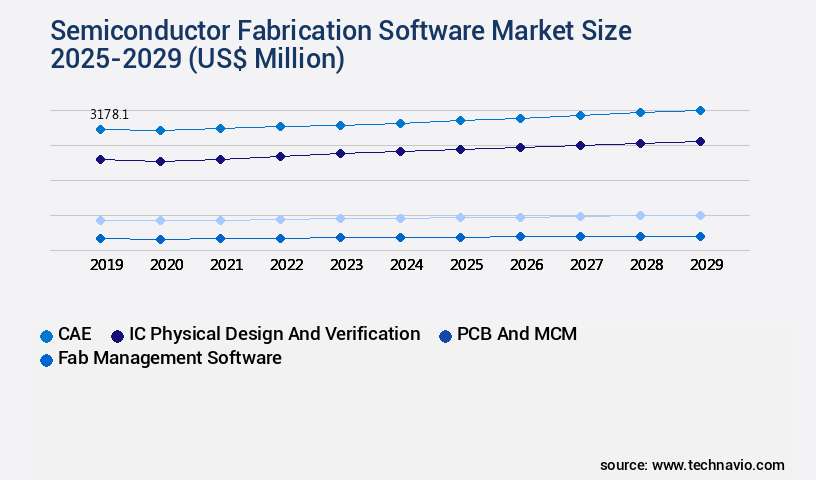
The CAE segment was valued at USD 3178.10 million in 2019 and showed a gradual increase during the forecast period.

Semiconductor Fabrication Software Market Size

Request Free Sample

Regional Analysis

APAC is estimated to contribute 52% to the growth of the global market during the forecast period.Technavio's analysts have elaborately explained the regional trends and drivers that shape the market during the forecast period.

Semiconductor Fabrication Software Market Share by Geography

See How Semiconductor Fabrication Software Market Demand is Rising in APAC Request Free Sample

The Asia Pacific the market holds a dominant position globally, driven by the region's vast production scale and the presence of leading manufacturers like Taiwan's TSMC and South Korea's Samsung and SK Hynix. These industry giants operate advanced and massive fabrication plants, where operational efficiency is paramount. Every improvement in efficiency, measured in nanoseconds and fractional percentage points in yield, translates into substantial financial gains. Approximately 60% of the global semiconductor revenue comes from the APAC region, with Taiwan and South Korea accounting for over 70% of the world's semiconductor manufacturing output. This high production volume necessitates advanced software solutions to optimize the intricate fabrication process.

According to recent studies, the APAC the market is projected to grow by 12% in the upcoming year, following a 15% increase in the previous year. This growth is fueled by the increasing complexity of semiconductor designs and the need for automation and optimization in the fabrication process. Furthermore, the adoption of Industry 4.0 technologies and the growing demand for advanced electronic devices in various sectors, including automotive, consumer electronics, and telecommunications, are expected to drive market expansion. Comparatively, the European the market is projected to grow by 8% in the upcoming year, while the North American market is anticipated to grow by 7%.

These growth rates are lower than the APAC market due to the smaller production volume and a relatively mature market. However, these regions still hold significant potential, particularly in the development and adoption of emerging technologies like artificial intelligence, machine learning, and the Internet of Things. In conclusion, the APAC the market is a dynamic and evolving landscape, driven by the region's dominance in semiconductor manufacturing and the increasing complexity of fabrication processes. The market's growth is fueled by the adoption of advanced technologies and the growing demand for electronic devices across various sectors.

Market Dynamics

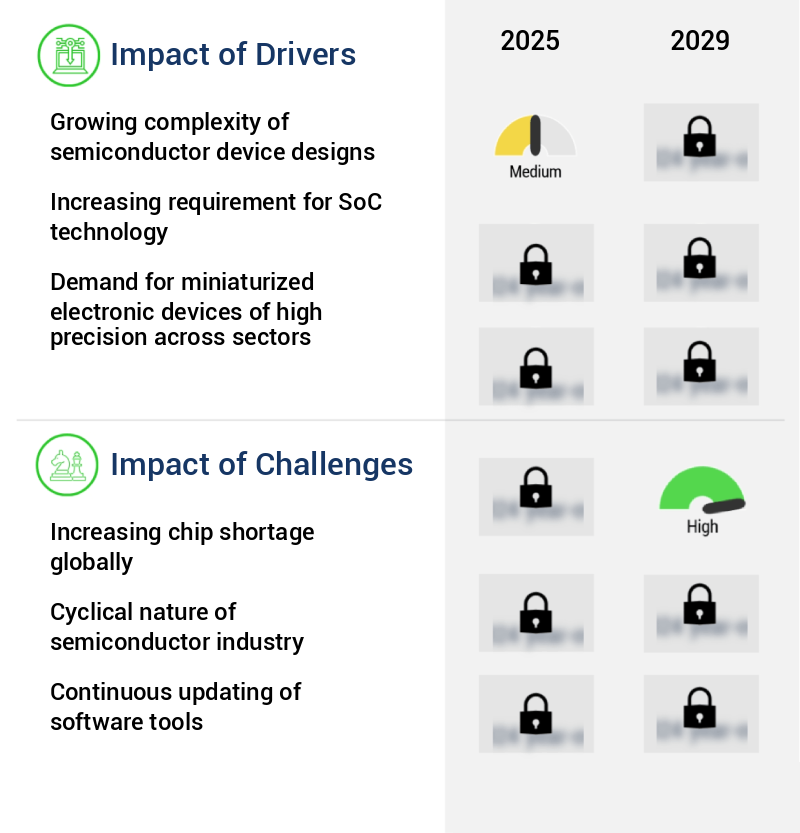
Our researchers analyzed the data with 2024 as the base year, along with the key drivers, trends, and challenges. A holistic analysis of drivers will help companies refine their marketing strategies to gain a competitive advantage.

The global semiconductor fabrication software market continues to evolve as advanced technologies redefine manufacturing efficiency and process reliability. Growing complexity in semiconductor design is driving the adoption of advanced process control algorithms semiconductor and process control algorithms for semiconductor manufacturing to minimize variability and improve throughput. Manufacturers increasingly rely on statistical process control charts semiconductor and real-time process monitoring systems semiconductor for consistent quality and operational transparency. The integration of predictive maintenance semiconductor equipment and equipment performance monitoring semiconductor fabs further enhances asset utilization and reduces unplanned downtime.

The market is witnessing significant deployment of process simulation software semiconductor fabrication, 3D process simulation tools semiconductor, and multiphysics simulation semiconductor devices to accelerate design validation and optimize fabrication processes. Technologies such as plasma processing software semiconductor fabrication, photolithography process simulation software, and lithography process control software semiconductor ensure precise patterning and layer alignment, while chemical mechanical planarization software and ion implantation simulation tools semiconductor contribute to superior wafer finishing and doping accuracy.

In 2024, the market is estimated at USD 8.5 billion, with projections reaching USD 13.2 billion by 2029, reflecting a CAGR of 9.2%. This growth is attributed to the increasing role of defect detection algorithms semiconductor processes, yield optimization strategies semiconductor industry, and data analytics platform for semiconductor fabs that deliver actionable insights for performance improvement. Additionally, factory automation software for semiconductor industry is becoming essential for end-to-end workflow efficiency, enabling smarter, data-driven manufacturing operations.

Semiconductor Fabrication Software Market Size

What are the key market drivers leading to the rise in the adoption of Semiconductor Fabrication Software Industry?

  • The increasing complexity of semiconductor device designs is the primary factor fueling market growth. With advanced technology requirements and intricate fabrication processes, the semiconductor industry continues to evolve, driving demand for innovative solutions and components. 
  • The market plays a pivotal role in the semiconductor industry, enabling manufacturers to streamline their production processes and enhance the functionality and performance of their devices. With the increasing complexity of semiconductor chip designs, the manufacturing process has become more intricate, necessitating advanced software solutions. Semiconductor fabrication software facilitates the design, simulation, and manufacturing of semiconductor devices. It helps manufacturers optimize their production processes, reduce time-to-market, and improve product quality. The market is characterized by continuous evolution, with new technologies and innovations emerging to address the evolving needs of the industry. One notable trend in the market is the increasing adoption of automation and artificial intelligence (AI) in the manufacturing process.
  • This shift enables manufacturers to reduce labor costs, enhance productivity, and improve product consistency. For instance, AI-driven software can analyze vast amounts of data generated during the manufacturing process and provide real-time insights to optimize production. Another trend is the growing popularity of cloud-based software solutions. These solutions offer several advantages, including lower upfront costs, easier implementation, and scalability. Cloud-based software also enables remote access, allowing manufacturers to collaborate with their teams and partners from anywhere in the world. According to industry reports, the market is expected to grow significantly in the coming years.
  • For instance, a study by a leading market research firm projects a compound annual growth rate (CAGR) of over 10% between 2021 and 2026. However, for the sake of neutrality, it's important to note that this term is excluded from this text. Instead, we can describe the market as experiencing steady growth and increasing demand. In conclusion, the market is a dynamic and evolving space, driven by the need for high functionality, performance, and bandwidth in semiconductor devices. The market is characterized by the adoption of automation and AI, as well as the growing popularity of cloud-based solutions.
  • The market is expected to grow significantly in the coming years, offering numerous opportunities for manufacturers and software providers alike.

What are the market trends shaping the Semiconductor Fabrication Software Industry?

  • The increasing demand for semiconductor memory devices represents a significant market trend. This requirement stems from advancements in technology and the growing need for efficient data storage and processing.
  • Semiconductor fabrication software plays a pivotal role in the production of memory devices, such as 3D NAND and DRAM, as the semiconductor industry experiences a shift from logic, analog, and discrete devices. This transition is driven by the high growth potential of the semiconductor memory market, fueled by the evolving consumer electronics landscape. Traditional storage solutions, like hard disk drives (HDDs), have been replaced by flash memory in various consumer devices due to their advantages. HDDs offer resistance to vibration, reduced chances of corruption due to impact, and a lower possibility of data loss. However, these features necessitate precise chip fabrication, making semiconductor fabrication software essential.
  • Semiconductor fabrication software enables manufacturers to optimize their production processes, ensuring the highest level of accuracy and efficiency. These solutions facilitate the design, simulation, and manufacturing of complex semiconductor devices. The software market is continuously evolving, with companies introducing advanced tools to cater to the growing demand for memory devices. Moreover, the increasing adoption of automotive electronics, IoT devices, and artificial intelligence applications further boosts the demand for semiconductor fabrication software. As the semiconductor industry continues to innovate and push the boundaries of technology, semiconductor fabrication software will remain an indispensable tool for manufacturers.

What challenges does the Semiconductor Fabrication Software Industry face during its growth?

  • The global chip shortage poses a significant challenge to the industry, threatening to hinder its growth. 
  • The market is experiencing significant shifts due to the ongoing global chip shortage. This issue has caused disruptions throughout the electronics industry, impacting manufacturers and businesses alike. Traditional chip ordering processes, which involve placing orders months in advance, are now facing extended lead times. For various types of chips, lead times exceed 28 weeks, leading companies to order more than required to secure their stocks. The chip shortage has forced businesses to adapt, leading to increased demand for semiconductor fabrication software. These solutions help optimize chip design, manufacturing, and inventory management, enabling companies to respond more effectively to supply chain challenges.
  • The market is evolving to meet the needs of this dynamic environment, offering advanced features such as real-time data analytics, automated design tools, and improved supply chain visibility. Semiconductor fabrication software providers are investing in research and development to address the growing demand for more efficient and agile solutions. This investment is expected to fuel market growth and help businesses navigate the complexities of the chip manufacturing process. Despite the challenges, the market continues to show promise, offering opportunities for innovation and growth in the electronics industry.

Exclusive Customer Landscape

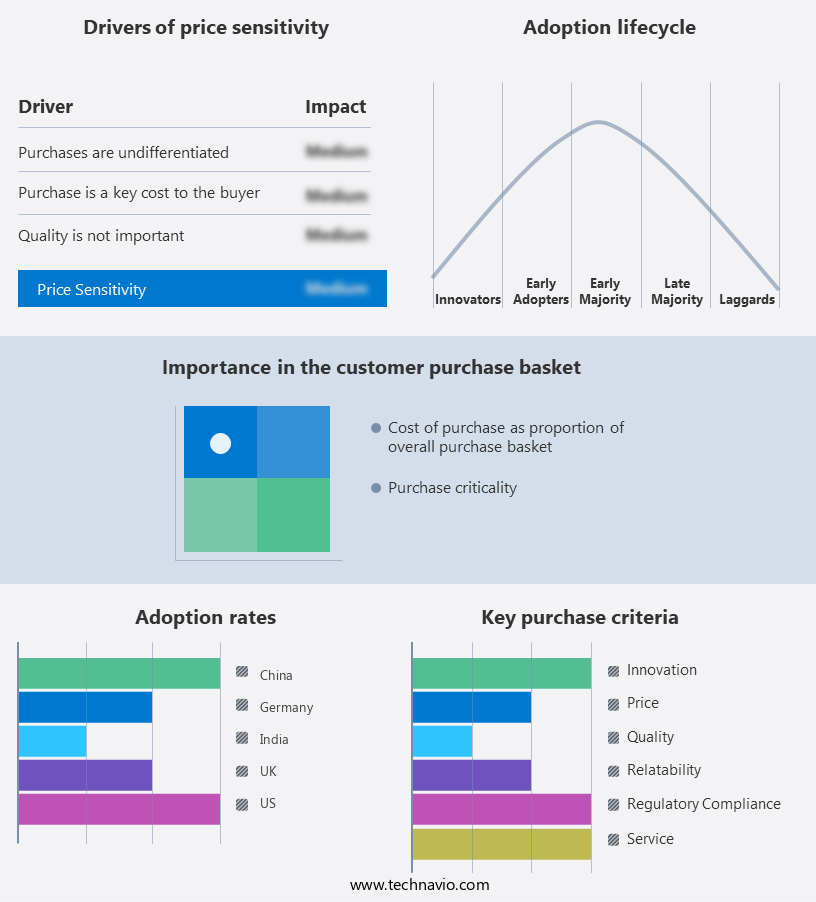
The semiconductor fabrication software market forecasting report includes the adoption lifecycle of the market, covering from the innovator's stage to the laggard's stage. It focuses on adoption rates in different regions based on penetration. Furthermore, the semiconductor fabrication software market report also includes key purchase criteria and drivers of price sensitivity to help companies evaluate and develop their market growth analysis strategies.

Semiconductor Fabrication Software Market Share by Geography

 Customer Landscape of Semiconductor Fabrication Software Industry

Key Companies & Market Insights

Companies are implementing various strategies, such as strategic alliances, semiconductor fabrication software market forecast, partnerships, mergers and acquisitions, geographical expansion, and product/service launches, to enhance their presence in the industry.

Agnisys Inc. - This company specializes in semiconductor fabrication software, featuring the IDesignSpecTM Suite. The suite offers a cohesive collection of products, including a graphical design interface and a unified generation engine, enhancing the design process for the microelectronics industry.

The industry research and growth report includes detailed analyses of the competitive landscape of the market and information about key companies, including:

  • Agnisys Inc.
  • Aldec Inc.
  • ANSYS Inc.
  • Applied Materials Inc.
  • Cadence Design Systems Inc.
  • Cantier Systems Pte Ltd.
  • Fabmatics GmbH
  • Keysight Technologies Inc.
  • KLA Corp.
  • Lam Research Corp.
  • Mindteck India Ltd.
  • Onto Innovation Inc.
  • PDF Solutions
  • Sasken Technologies Ltd.
  • Siemens AG
  • Synopsys Inc.
  • The PEER Group Inc.
  • Thermo Fisher Scientific Inc.
  • Tismo Technology Solutions Pvt. Ltd.
  • Zuken Inc.

Qualitative and quantitative analysis of companies has been conducted to help clients understand the wider business environment as well as the strengths and weaknesses of key industry players. Data is qualitatively analyzed to categorize companies as pure play, category-focused, industry-focused, and diversified; it is quantitatively analyzed to categorize companies as dominant, leading, strong, tentative, and weak.

Recent Development and News in Semiconductor Fabrication Software Market

  • In January 2024, Lam Research Corporation, a leading provider of semiconductor processing equipment and services, announced the launch of its new software suite, "Genesis," designed to optimize semiconductor fabrication processes. This innovative software aims to enhance productivity and reduce costs for chipmakers (Lam Research Press Release).
  • In March 2024, Applied Materials, a global leader in materials engineering solutions, entered into a strategic partnership with ANSYS, a pioneer in engineering simulation software. The collaboration aimed to integrate ANSYS' simulation tools with Applied Materials' semiconductor manufacturing equipment, providing customers with a more comprehensive solution for designing and manufacturing advanced semiconductors (Applied Materials Press Release).
  • In May 2024, KLA Corporation, a key player in process control and yield management solutions for the semiconductor industry, completed the acquisition of Orbotech Ltd., a leading provider of yield management solutions. The acquisition was expected to expand KLA's offerings and strengthen its position in the semiconductor market (KLA Corporation Press Release).
  • In January 2025, Synopsys, Inc., a leading provider of electronic design automation (EDA) software, announced the successful deployment of its DesignWare IP at Samsung Foundry's 3nm process technology. This significant achievement demonstrated Synopsys' continued leadership in the EDA market and its ability to support the most advanced semiconductor manufacturing processes (Synopsys Press Release).

Research Analyst Overview

  • The market encompasses a wide array of solutions designed to optimize and streamline wafer fabrication processes. This market continues to evolve, driven by advancements in technology and the increasing complexity of semiconductor manufacturing. One significant area of focus is wafer fabrication modeling, which involves simulating various manufacturing processes to optimize yield and reduce costs. Fault detection systems, a crucial component of this market, employ predictive maintenance software and defect detection algorithms to minimize downtime and improve overall equipment efficiency. Ion implantation simulation is another essential application, enabling manufacturers to fine-tune implantation processes and enhance overall semiconductor performance.
  • Real-time process control and design of experiments are also key market trends. Real-time process control systems enable manufacturers to monitor and adjust processes in real-time, ensuring consistent product quality and reducing waste. Design of experiments helps optimize manufacturing processes by systematically testing various parameters and identifying the most effective combinations. The market is expected to grow at a steady pace, with industry analysts projecting a growth rate of approximately 10% per year. This growth is driven by the increasing demand for advanced semiconductor technologies in various sectors, including telecommunications, automotive, and consumer electronics. Multiphysics simulation, yield enhancement techniques, failure analysis software, factory automation software, materials characterization software, chemical mechanical planarization, particle detection systems, photolithography software, equipment performance monitoring, contamination control, 3D process simulation, plasma processing software, advanced process control, process capability analysis, equipment control systems, data analytics platforms, semiconductor equipment automation, lithography process control, etching process simulation, remote equipment monitoring, yield optimization tools, process simulation software, virtual metrology models, metrology data analysis, process monitoring systems, statistical process control, wafer inspection software, and other related solutions are all integral components of this dynamic market.

Dive into Technavio's robust research methodology, blending expert interviews, extensive data synthesis, and validated models for unparalleled Semiconductor Fabrication Software Market insights. See full methodology.

Market Scope

Report Coverage

Details

Page number

245

Base year

2024

Historic period

2019-2023

Forecast period

2025-2029

Growth momentum & CAGR

Accelerate at a CAGR of 2.1%

Market growth 2025-2029

USD 813.9 million

Market structure

Fragmented

YoY growth 2024-2025(%)

2.1

Key countries

US, China, Taiwan, South Korea, Japan, Canada, UK, Germany, France, and India

Competitive landscape

Leading Companies, Market Positioning of Companies, Competitive Strategies, and Industry Risks

Request Free Sample

What are the Key Data Covered in this Semiconductor Fabrication Software Market Research and Growth Report?

  • CAGR of the Semiconductor Fabrication Software industry during the forecast period
  • Detailed information on factors that will drive the growth and forecasting between 2025 and 2029
  • Precise estimation of the size of the market and its contribution of the industry in focus to the parent market
  • Accurate predictions about upcoming growth and trends and changes in consumer behaviour
  • Growth of the market across APAC, North America, Europe, Middle East and Africa, and South America
  • Thorough analysis of the market's competitive landscape and detailed information about companies
  • Comprehensive analysis of factors that will challenge the semiconductor fabrication software market growth of industry companies

We can help! Our analysts can customize this semiconductor fabrication software market research report to meet your requirements.

Get in touch

1 Executive Summary

  • 1.1 Market overview
    • Executive Summary - Chart on Market Overview
    • Executive Summary - Data Table on Market Overview
    • Executive Summary - Chart on Global Market Characteristics
    • Executive Summary - Chart on Market by Geography
    • Executive Summary - Chart on Market Segmentation by Solution
    • Executive Summary - Chart on Market Segmentation by Application
    • Executive Summary - Chart on Market Segmentation by End-user
    • Executive Summary - Chart on Market Segmentation by Deployment
    • Executive Summary - Chart on Incremental Growth
    • Executive Summary - Data Table on Incremental Growth
    • Executive Summary - Chart on Company Market Positioning

2 Technavio Analysis

  • 2.1 Analysis of price sensitivity, lifecycle, customer purchase basket, adoption rates, and purchase criteria
    • Analysis of price sensitivity, lifecycle, customer purchase basket, adoption rates, and purchase criteria
  • 2.2 Criticality of inputs and Factors of differentiation
    • Overview on criticality of inputs and factors of differentiation
  • 2.3 Factors of disruption
    • Overview on factors of disruption
  • 2.4 Impact of drivers and challenges
    • Impact of drivers and challenges in 2024 and 2029

3 Market Landscape

  • 3.1 Market ecosystem
    • Parent Market
    • Data Table on - Parent Market
  • 3.2 Market characteristics
    • Market characteristics analysis
  • 3.3 Value chain analysis
    • Value chain analysis

4 Market Sizing

  • 4.1 Market definition
    • Offerings of companies included in the market definition
  • 4.2 Market segment analysis
    • Market segments
  • 4.3 Market size 2024
    • 4.4 Market outlook: Forecast for 2024-2029
      • Chart on Global - Market size and forecast 2024-2029 ($ million)
      • Data Table on Global - Market size and forecast 2024-2029 ($ million)
      • Chart on Global Market: Year-over-year growth 2024-2029 (%)
      • Data Table on Global Market: Year-over-year growth 2024-2029 (%)

    5 Historic Market Size

    • 5.1 Global Semiconductor Fabrication Software Market 2019 - 2023
      • Historic Market Size - Data Table on Global Semiconductor Fabrication Software Market 2019 - 2023 ($ million)
    • 5.2 Solution segment analysis 2019 - 2023
      • Historic Market Size - Solution Segment 2019 - 2023 ($ million)
    • 5.3 Application segment analysis 2019 - 2023
      • Historic Market Size - Application Segment 2019 - 2023 ($ million)
    • 5.4 End-user segment analysis 2019 - 2023
      • Historic Market Size - End-user Segment 2019 - 2023 ($ million)
    • 5.5 Deployment segment analysis 2019 - 2023
      • Historic Market Size - Deployment Segment 2019 - 2023 ($ million)
    • 5.6 Geography segment analysis 2019 - 2023
      • Historic Market Size - Geography Segment 2019 - 2023 ($ million)
    • 5.7 Country segment analysis 2019 - 2023
      • Historic Market Size - Country Segment 2019 - 2023 ($ million)

    6 Qualitative Analysis

    • 6.1 The AI impact on Global Semiconductor Fabrication Software Market

      7 Five Forces Analysis

      • 7.1 Five forces summary
        • Five forces analysis - Comparison between 2024 and 2029
      • 7.2 Bargaining power of buyers
        • Bargaining power of buyers - Impact of key factors 2024 and 2029
      • 7.3 Bargaining power of suppliers
        • Bargaining power of suppliers - Impact of key factors in 2024 and 2029
      • 7.4 Threat of new entrants
        • Threat of new entrants - Impact of key factors in 2024 and 2029
      • 7.5 Threat of substitutes
        • Threat of substitutes - Impact of key factors in 2024 and 2029
      • 7.6 Threat of rivalry
        • Threat of rivalry - Impact of key factors in 2024 and 2029
      • 7.7 Market condition
        • Chart on Market condition - Five forces 2024 and 2029

      8 Market Segmentation by Solution

      • 8.1 Market segments
        • Chart on Solution - Market share 2024-2029 (%)
        • Data Table on Solution - Market share 2024-2029 (%)
      • 8.2 Comparison by Solution
        • Chart on Comparison by Solution
        • Data Table on Comparison by Solution
      • 8.3 CAE - Market size and forecast 2024-2029
        • Chart on CAE - Market size and forecast 2024-2029 ($ million)
        • Data Table on CAE - Market size and forecast 2024-2029 ($ million)
        • Chart on CAE - Year-over-year growth 2024-2029 (%)
        • Data Table on CAE - Year-over-year growth 2024-2029 (%)
      • 8.4 IC physical design and verification - Market size and forecast 2024-2029
        • Chart on IC physical design and verification - Market size and forecast 2024-2029 ($ million)
        • Data Table on IC physical design and verification - Market size and forecast 2024-2029 ($ million)
        • Chart on IC physical design and verification - Year-over-year growth 2024-2029 (%)
        • Data Table on IC physical design and verification - Year-over-year growth 2024-2029 (%)
      • 8.5 PCB and MCM - Market size and forecast 2024-2029
        • Chart on PCB and MCM - Market size and forecast 2024-2029 ($ million)
        • Data Table on PCB and MCM - Market size and forecast 2024-2029 ($ million)
        • Chart on PCB and MCM - Year-over-year growth 2024-2029 (%)
        • Data Table on PCB and MCM - Year-over-year growth 2024-2029 (%)
      • 8.6 Fab management software - Market size and forecast 2024-2029
        • Chart on Fab management software - Market size and forecast 2024-2029 ($ million)
        • Data Table on Fab management software - Market size and forecast 2024-2029 ($ million)
        • Chart on Fab management software - Year-over-year growth 2024-2029 (%)
        • Data Table on Fab management software - Year-over-year growth 2024-2029 (%)
      • 8.7 Others - Market size and forecast 2024-2029
        • Chart on Others - Market size and forecast 2024-2029 ($ million)
        • Data Table on Others - Market size and forecast 2024-2029 ($ million)
        • Chart on Others - Year-over-year growth 2024-2029 (%)
        • Data Table on Others - Year-over-year growth 2024-2029 (%)
      • 8.8 Market opportunity by Solution
        • Market opportunity by Solution ($ million)
        • Data Table on Market opportunity by Solution ($ million)

      9 Market Segmentation by Application

      • 9.1 Market segments
        • Chart on Application - Market share 2024-2029 (%)
        • Data Table on Application - Market share 2024-2029 (%)
      • 9.2 Comparison by Application
        • Chart on Comparison by Application
        • Data Table on Comparison by Application
      • 9.3 Wafer fabrication - Market size and forecast 2024-2029
        • Chart on Wafer fabrication - Market size and forecast 2024-2029 ($ million)
        • Data Table on Wafer fabrication - Market size and forecast 2024-2029 ($ million)
        • Chart on Wafer fabrication - Year-over-year growth 2024-2029 (%)
        • Data Table on Wafer fabrication - Year-over-year growth 2024-2029 (%)
      • 9.4 Assembly and packaging - Market size and forecast 2024-2029
        • Chart on Assembly and packaging - Market size and forecast 2024-2029 ($ million)
        • Data Table on Assembly and packaging - Market size and forecast 2024-2029 ($ million)
        • Chart on Assembly and packaging - Year-over-year growth 2024-2029 (%)
        • Data Table on Assembly and packaging - Year-over-year growth 2024-2029 (%)
      • 9.5 Testing and inspection - Market size and forecast 2024-2029
        • Chart on Testing and inspection - Market size and forecast 2024-2029 ($ million)
        • Data Table on Testing and inspection - Market size and forecast 2024-2029 ($ million)
        • Chart on Testing and inspection - Year-over-year growth 2024-2029 (%)
        • Data Table on Testing and inspection - Year-over-year growth 2024-2029 (%)
      • 9.6 Market opportunity by Application
        • Market opportunity by Application ($ million)
        • Data Table on Market opportunity by Application ($ million)

      10 Market Segmentation by End-user

      • 10.1 Market segments
        • Chart on End-user - Market share 2024-2029 (%)
        • Data Table on End-user - Market share 2024-2029 (%)
      • 10.2 Comparison by End-user
        • Chart on Comparison by End-user
        • Data Table on Comparison by End-user
      • 10.3 IDMs - Market size and forecast 2024-2029
        • Chart on IDMs - Market size and forecast 2024-2029 ($ million)
        • Data Table on IDMs - Market size and forecast 2024-2029 ($ million)
        • Chart on IDMs - Year-over-year growth 2024-2029 (%)
        • Data Table on IDMs - Year-over-year growth 2024-2029 (%)
      • 10.4 Foundries - Market size and forecast 2024-2029
        • Chart on Foundries - Market size and forecast 2024-2029 ($ million)
        • Data Table on Foundries - Market size and forecast 2024-2029 ($ million)
        • Chart on Foundries - Year-over-year growth 2024-2029 (%)
        • Data Table on Foundries - Year-over-year growth 2024-2029 (%)
      • 10.5 OSATs - Market size and forecast 2024-2029
        • Chart on OSATs - Market size and forecast 2024-2029 ($ million)
        • Data Table on OSATs - Market size and forecast 2024-2029 ($ million)
        • Chart on OSATs - Year-over-year growth 2024-2029 (%)
        • Data Table on OSATs - Year-over-year growth 2024-2029 (%)
      • 10.6 Market opportunity by End-user
        • Market opportunity by End-user ($ million)
        • Data Table on Market opportunity by End-user ($ million)

      11 Market Segmentation by Deployment

      • 11.1 Market segments
        • Chart on Deployment - Market share 2024-2029 (%)
        • Data Table on Deployment - Market share 2024-2029 (%)
      • 11.2 Comparison by Deployment
        • Chart on Comparison by Deployment
        • Data Table on Comparison by Deployment
      • 11.3 On-premises - Market size and forecast 2024-2029
        • Chart on On-premises - Market size and forecast 2024-2029 ($ million)
        • Data Table on On-premises - Market size and forecast 2024-2029 ($ million)
        • Chart on On-premises - Year-over-year growth 2024-2029 (%)
        • Data Table on On-premises - Year-over-year growth 2024-2029 (%)
      • 11.4 Cloud-based - Market size and forecast 2024-2029
        • Chart on Cloud-based - Market size and forecast 2024-2029 ($ million)
        • Data Table on Cloud-based - Market size and forecast 2024-2029 ($ million)
        • Chart on Cloud-based - Year-over-year growth 2024-2029 (%)
        • Data Table on Cloud-based - Year-over-year growth 2024-2029 (%)
      • 11.5 Market opportunity by Deployment
        • Market opportunity by Deployment ($ million)
        • Data Table on Market opportunity by Deployment ($ million)

      12 Customer Landscape

      • 12.1 Customer landscape overview
        • Analysis of price sensitivity, lifecycle, customer purchase basket, adoption rates, and purchase criteria

      13 Geographic Landscape

      • 13.1 Geographic segmentation
        • Chart on Market share by geography 2024-2029 (%)
        • Data Table on Market share by geography 2024-2029 (%)
      • 13.2 Geographic comparison
        • Chart on Geographic comparison
        • Data Table on Geographic comparison
      • 13.3 APAC - Market size and forecast 2024-2029
        • Chart on APAC - Market size and forecast 2024-2029 ($ million)
        • Data Table on APAC - Market size and forecast 2024-2029 ($ million)
        • Chart on APAC - Year-over-year growth 2024-2029 (%)
        • Data Table on APAC - Year-over-year growth 2024-2029 (%)
      • 13.4 North America - Market size and forecast 2024-2029
        • Chart on North America - Market size and forecast 2024-2029 ($ million)
        • Data Table on North America - Market size and forecast 2024-2029 ($ million)
        • Chart on North America - Year-over-year growth 2024-2029 (%)
        • Data Table on North America - Year-over-year growth 2024-2029 (%)
      • 13.5 Europe - Market size and forecast 2024-2029
        • Chart on Europe - Market size and forecast 2024-2029 ($ million)
        • Data Table on Europe - Market size and forecast 2024-2029 ($ million)
        • Chart on Europe - Year-over-year growth 2024-2029 (%)
        • Data Table on Europe - Year-over-year growth 2024-2029 (%)
      • 13.6 Middle East and Africa - Market size and forecast 2024-2029
        • Chart on Middle East and Africa - Market size and forecast 2024-2029 ($ million)
        • Data Table on Middle East and Africa - Market size and forecast 2024-2029 ($ million)
        • Chart on Middle East and Africa - Year-over-year growth 2024-2029 (%)
        • Data Table on Middle East and Africa - Year-over-year growth 2024-2029 (%)
      • 13.7 South America - Market size and forecast 2024-2029
        • Chart on South America - Market size and forecast 2024-2029 ($ million)
        • Data Table on South America - Market size and forecast 2024-2029 ($ million)
        • Chart on South America - Year-over-year growth 2024-2029 (%)
        • Data Table on South America - Year-over-year growth 2024-2029 (%)
      • 13.8 US - Market size and forecast 2024-2029
        • Chart on US - Market size and forecast 2024-2029 ($ million)
        • Data Table on US - Market size and forecast 2024-2029 ($ million)
        • Chart on US - Year-over-year growth 2024-2029 (%)
        • Data Table on US - Year-over-year growth 2024-2029 (%)
      • 13.9 China - Market size and forecast 2024-2029
        • Chart on China - Market size and forecast 2024-2029 ($ million)
        • Data Table on China - Market size and forecast 2024-2029 ($ million)
        • Chart on China - Year-over-year growth 2024-2029 (%)
        • Data Table on China - Year-over-year growth 2024-2029 (%)
      • 13.10 Taiwan - Market size and forecast 2024-2029
        • Chart on Taiwan - Market size and forecast 2024-2029 ($ million)
        • Data Table on Taiwan - Market size and forecast 2024-2029 ($ million)
        • Chart on Taiwan - Year-over-year growth 2024-2029 (%)
        • Data Table on Taiwan - Year-over-year growth 2024-2029 (%)
      • 13.11 South Korea - Market size and forecast 2024-2029
        • Chart on South Korea - Market size and forecast 2024-2029 ($ million)
        • Data Table on South Korea - Market size and forecast 2024-2029 ($ million)
        • Chart on South Korea - Year-over-year growth 2024-2029 (%)
        • Data Table on South Korea - Year-over-year growth 2024-2029 (%)
      • 13.12 Japan - Market size and forecast 2024-2029
        • Chart on Japan - Market size and forecast 2024-2029 ($ million)
        • Data Table on Japan - Market size and forecast 2024-2029 ($ million)
        • Chart on Japan - Year-over-year growth 2024-2029 (%)
        • Data Table on Japan - Year-over-year growth 2024-2029 (%)
      • 13.13 Canada - Market size and forecast 2024-2029
        • Chart on Canada - Market size and forecast 2024-2029 ($ million)
        • Data Table on Canada - Market size and forecast 2024-2029 ($ million)
        • Chart on Canada - Year-over-year growth 2024-2029 (%)
        • Data Table on Canada - Year-over-year growth 2024-2029 (%)
      • 13.14 UK - Market size and forecast 2024-2029
        • Chart on UK - Market size and forecast 2024-2029 ($ million)
        • Data Table on UK - Market size and forecast 2024-2029 ($ million)
        • Chart on UK - Year-over-year growth 2024-2029 (%)
        • Data Table on UK - Year-over-year growth 2024-2029 (%)
      • 13.15 Germany - Market size and forecast 2024-2029
        • Chart on Germany - Market size and forecast 2024-2029 ($ million)
        • Data Table on Germany - Market size and forecast 2024-2029 ($ million)
        • Chart on Germany - Year-over-year growth 2024-2029 (%)
        • Data Table on Germany - Year-over-year growth 2024-2029 (%)
      • 13.16 France - Market size and forecast 2024-2029
        • Chart on France - Market size and forecast 2024-2029 ($ million)
        • Data Table on France - Market size and forecast 2024-2029 ($ million)
        • Chart on France - Year-over-year growth 2024-2029 (%)
        • Data Table on France - Year-over-year growth 2024-2029 (%)
      • 13.17 India - Market size and forecast 2024-2029
        • Chart on India - Market size and forecast 2024-2029 ($ million)
        • Data Table on India - Market size and forecast 2024-2029 ($ million)
        • Chart on India - Year-over-year growth 2024-2029 (%)
        • Data Table on India - Year-over-year growth 2024-2029 (%)
      • 13.18 Market opportunity by geography
        • Market opportunity by geography ($ million)
        • Data Tables on Market opportunity by geography ($ million)

      14 Drivers, Challenges, and Opportunity/Restraints

      • 14.1 Market drivers
        • 14.2 Market challenges
          • 14.3 Impact of drivers and challenges
            • Impact of drivers and challenges in 2024 and 2029
          • 14.4 Market opportunities/restraints

            15 Competitive Landscape

            • 15.1 Overview
              • 15.2 Competitive Landscape
                • Overview on criticality of inputs and factors of differentiation
              • 15.3 Landscape disruption
                • Overview on factors of disruption
              • 15.4 Industry risks
                • Impact of key risks on business

              16 Competitive Analysis

              • 16.1 Companies profiled
                • Companies covered
              • 16.2 Company ranking index
                • Company ranking index
              • 16.3 Market positioning of companies
                • Matrix on companies position and classification
              • 16.4 Agnisys Inc.
                • Agnisys Inc. - Overview
                • Agnisys Inc. - Product / Service
                • Agnisys Inc. - Key offerings
                • SWOT
              • 16.5 Aldec Inc.
                • Aldec Inc. - Overview
                • Aldec Inc. - Product / Service
                • Aldec Inc. - Key offerings
                • SWOT
              • 16.6 ANSYS Inc.
                • ANSYS Inc. - Overview
                • ANSYS Inc. - Business segments
                • ANSYS Inc. - Key news
                • ANSYS Inc. - Key offerings
                • ANSYS Inc. - Segment focus
                • SWOT
              • 16.7 Applied Materials Inc.
                • Applied Materials Inc. - Overview
                • Applied Materials Inc. - Business segments
                • Applied Materials Inc. - Key offerings
                • Applied Materials Inc. - Segment focus
                • SWOT
              • 16.8 Cadence Design Systems Inc.
                • Cadence Design Systems Inc. - Overview
                • Cadence Design Systems Inc. - Business segments
                • Cadence Design Systems Inc. - Key news
                • Cadence Design Systems Inc. - Key offerings
                • Cadence Design Systems Inc. - Segment focus
                • SWOT
              • 16.9 Keysight Technologies Inc.
                • Keysight Technologies Inc. - Overview
                • Keysight Technologies Inc. - Business segments
                • Keysight Technologies Inc. - Key news
                • Keysight Technologies Inc. - Key offerings
                • Keysight Technologies Inc. - Segment focus
                • SWOT
              • 16.10 KLA Corp.
                • KLA Corp. - Overview
                • KLA Corp. - Business segments
                • KLA Corp. - Key offerings
                • KLA Corp. - Segment focus
                • SWOT
              • 16.11 Lam Research Corp.
                • Lam Research Corp. - Overview
                • Lam Research Corp. - Product / Service
                • Lam Research Corp. - Key offerings
                • SWOT
              • 16.12 Onto Innovation Inc.
                • Onto Innovation Inc. - Overview
                • Onto Innovation Inc. - Product / Service
                • Onto Innovation Inc. - Key offerings
                • SWOT
              • 16.13 PDF Solutions
                • PDF Solutions - Overview
                • PDF Solutions - Product / Service
                • PDF Solutions - Key offerings
                • SWOT
              • 16.14 Siemens AG
                • Siemens AG - Overview
                • Siemens AG - Business segments
                • Siemens AG - Key news
                • Siemens AG - Key offerings
                • Siemens AG - Segment focus
                • SWOT
              • 16.15 Synopsys Inc.
                • Synopsys Inc. - Overview
                • Synopsys Inc. - Business segments
                • Synopsys Inc. - Key news
                • Synopsys Inc. - Key offerings
                • Synopsys Inc. - Segment focus
                • SWOT
              • 16.16 The PEER Group Inc.
                • The PEER Group Inc. - Overview
                • The PEER Group Inc. - Product / Service
                • The PEER Group Inc. - Key offerings
                • SWOT
              • 16.17 Thermo Fisher Scientific Inc.
                • Thermo Fisher Scientific Inc. - Overview
                • Thermo Fisher Scientific Inc. - Business segments
                • Thermo Fisher Scientific Inc. - Key news
                • Thermo Fisher Scientific Inc. - Key offerings
                • Thermo Fisher Scientific Inc. - Segment focus
                • SWOT
              • 16.18 Zuken Inc.
                • Zuken Inc. - Overview
                • Zuken Inc. - Product / Service
                • Zuken Inc. - Key offerings
                • SWOT

              17 Appendix

              • 17.1 Scope of the report
                • 17.2 Inclusions and exclusions checklist
                  • Inclusions checklist
                  • Exclusions checklist
                • 17.3 Currency conversion rates for US$
                  • Currency conversion rates for US$
                • 17.4 Research methodology
                  • Research methodology
                • 17.5 Data procurement
                  • Information sources
                • 17.6 Data validation
                  • Data validation
                • 17.7 Validation techniques employed for market sizing
                  • Validation techniques employed for market sizing
                • 17.8 Data synthesis
                  • Data synthesis
                • 17.9 360 degree market analysis
                  • 360 degree market analysis
                • 17.10 List of abbreviations
                  • List of abbreviations

                Research Methodology

                Technavio presents a detailed picture of the market by way of study, synthesis, and summation of data from multiple sources. The analysts have presented the various facets of the market with a particular focus on identifying the key industry influencers. The data thus presented is comprehensive, reliable, and the result of extensive research, both primary and secondary.

                INFORMATION SOURCES

                Primary sources

                • Manufacturers and suppliers
                • Channel partners
                • Industry experts
                • Strategic decision makers

                Secondary sources

                • Industry journals and periodicals
                • Government data
                • Financial reports of key industry players
                • Historical data
                • Press releases

                DATA ANALYSIS

                Data Synthesis

                • Collation of data
                • Estimation of key figures
                • Analysis of derived insights

                Data Validation

                • Triangulation with data models
                • Reference against proprietary databases
                • Corroboration with industry experts

                REPORT WRITING

                Qualitative

                • Market drivers
                • Market challenges
                • Market trends
                • Five forces analysis

                Quantitative

                • Market size and forecast
                • Market segmentation
                • Geographical insights
                • Competitive landscape

                Interested in this report?

                Get your sample now to see our research methodology and insights!

                Download Now

                Frequently Asked Questions

                Semiconductor Fabrication Software market growth will increase by $ 813.9 mn during 2025-2029.

                The Semiconductor Fabrication Software market is expected to grow at a CAGR of 2.1% during 2025-2029.

                Semiconductor Fabrication Software market is segmented by Solution( CAE, IC physical design and verification, PCB and MCM, Fab management software, Others) Application( Wafer fabrication, Assembly and packaging, Testing and inspection, Integrated Device Manufacturers, Fabless Companies) End-user( IDMs, Foundries, OSATs, Middle East and Africa, South America)

                Agnisys Inc., Aldec Inc., ANSYS Inc., Applied Materials Inc., Cadence Design Systems Inc., Cantier Systems Pte Ltd., Fabmatics GmbH, Keysight Technologies Inc., KLA Corp., Lam Research Corp., Mindteck India Ltd., Onto Innovation Inc., PDF Solutions, Sasken Technologies Ltd., Siemens AG, Synopsys Inc., The PEER Group Inc., Thermo Fisher Scientific Inc., Tismo Technology Solutions Pvt. Ltd., Zuken Inc. are a few of the key vendors in the Semiconductor Fabrication Software market.

                APAC will register the highest growth rate of 52% among the other regions. Therefore, the Semiconductor Fabrication Software market in APAC is expected to garner significant business opportunities for the vendors during the forecast period.

                US, China, Taiwan, South Korea, Japan, Canada, UK, Germany, France, India

                • Growing complexity of semiconductor device designsThe semiconductor industry is defined by the need for high functionality is the driving factor this market.
                • performance is the driving factor this market.
                • and bandwidth. Semiconductor device manufacturers must constantly raise the bar with their offerings to gain an edge over their competitors in terms of performance and functionality while considering the time-to-market aspect.The growing complexity of the semiconductor chip designs has made the manufacturing process of semiconductor devices difficult and complicated. Some of the leading chip manufacturers is the driving factor this market.
                • such as Intel and Samsung is the driving factor this market.
                • look to avoid this impact by adding more engineers to the project teams. However is the driving factor this market.
                • this impacts their research and development expenses as more capital is spent on paying employee salaries. Other semiconductor companies have shifted to a new business model (fabless semiconductor companies) to focus only on the design of semiconductor devices while outsourcing the production to foundries.The features and functionalities offered by consumer electronic devices are increasing as electronic device manufacturers are focusing on differentiating their offerings from competitors. This explains the growing need for multifunctional ICs. Semiconductor device manufacturers have addressed this need by developing new and more complex architecture and designs of semiconductor devices. The increased demand for miniaturized electronic devices has resulted in a high level of integration on a single chip. This has increased the complexity of the design and development of the chip. Semiconductor devices such as three-dimensional (3D) ICs and 3D Not AND (NAND) are compact is the driving factor this market.
                • consume less power is the driving factor this market.
                • and are more efficient than 2D semiconductor devices. However is the driving factor this market.
                • these devices have complex designs and manufacturing processes. Semiconductor device manufacturers have no manufacturing differentiation is the driving factor this market.
                • but they focus on functionalities and performance features to gain a competitive edge in the market.With the growing complexity of semiconductor device designs is the driving factor this market.
                • foundries must invest significantly in research and development and capital equipment to develop advanced semiconductor devices. The complexity of semiconductor designs has triggered a demand for advanced software tools for semiconductor design and production. Technavio believes that the complexity of nodes and the smaller area will continue to benefit the global semiconductor fabrication software market during the forecast period. is the driving factor this market.

                The Semiconductor Fabrication Software market vendors should focus on grabbing business opportunities from the CAE segment as it accounted for the largest market share in the base year.