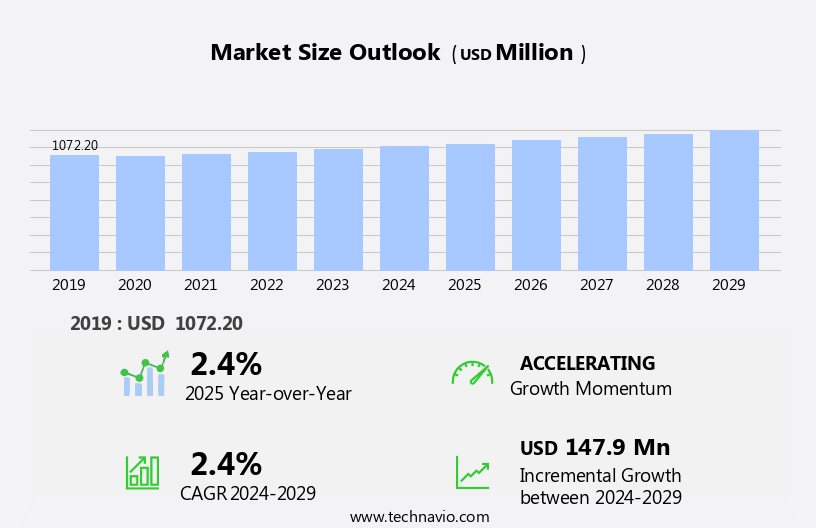
Shark Meat Market Size 2025-2029
The shark meat market size is forecast to increase by USD 147.9 million, at a CAGR of 2.4% between 2024 and 2029.
- The market is driven by the high nutritional value of shark meat, making it a sought-after delicacy in various culinary traditions. This demand is further fueled by the expanding applications of shark body parts, such as fins, cartilage, and liver oil, in diverse industries, including food, pharmaceuticals, and cosmetics. However, this market faces significant challenges. Community involvement programs, bycatch reduction devices, and ocean conservation initiatives further strengthen the market's sustainability efforts. Shark meat is rich in essential nutrients such as omega-3 fatty acids, vitamins, and minerals, making it a desirable option for consumers seeking healthy protein sources.
- Companies must navigate this complex landscape by implementing sustainable fishing practices, investing in research and development for alternative sources, and collaborating with regulatory bodies to ensure the long-term viability of the market. Climate change impacts and traditional fishing equipment practices necessitate international cooperation and public awareness campaigns. Overexploitation and depletion of shark populations pose a major threat, as unsustainable fishing practices continue to endanger numerous shark species. The consequences of these practices extend beyond ecological concerns, as the long-term sustainability of the shark meat industry is at stake.
What will be the Size of the Shark Meat Market during the forecast period?
Explore in-depth regional segment analysis with market size data - historical 2019-2023 and forecasts 2025-2029 - in the full report.
Request Free Sample
The market exhibits a dynamic and evolving nature, with ongoing activities and patterns shaping its landscape. Sustainable fishing practices are increasingly prioritized to ensure the long-term health of shark populations and marine ecosystems. Population dynamics modeling and habitat protection measures are integral components of fishery management, ensuring the maintenance of healthy shark populations. Bycatch mitigation strategies, such as selective fishing techniques and fishing gear selectivity, minimize the incidental capture of non-target species. Marine ecosystem health is a critical consideration, with environmental impact studies and fish stock assessments guiding sustainable harvesting methods. Shark finning reduction initiatives aim to eliminate the wasteful practice of removing shark fins and discarding the carcasses, contributing to the depletion of shark populations.
Species distribution mapping provides valuable insights into the distribution patterns of various shark species, informing fishing quota management and aquaculture sustainability efforts. Food safety regulations play a crucial role in ensuring the safety and quality of shark meat products. Shark meat is a highly sought-after nutritious seafood due to its rich content of vitamins, minerals, and healthy fats. Fishery management regulations, community involvement programs, and bycatch reduction devices are essential tools for promoting sustainable fishing practices and reducing the impact of fishing on the marine environment. Market price fluctuation and supply chain transparency are also key factors influencing the market, with ongoing efforts to improve transparency and traceability throughout the supply chain.
Processing techniques continue to evolve, with a focus on minimizing waste and maximizing efficiency. Ongoing research and innovation in areas such as waste management solutions, marine protected areas, and ocean conservation initiatives contribute to the sustainability of the market. The continuous unfolding of market activities and evolving patterns underscores the importance of a proactive and adaptive approach to shark meat production and consumption. Shark genomics and marine biology contribute to unraveling the mysteries of shark behavior and sensory systems.
How is this Shark Meat Industry segmented?
The shark meat industry research report provides comprehensive data (region-wise segment analysis), with forecasts and estimates in "USD million" for the period 2025-2029, as well as historical data from 2019-2023 for the following segments.
- Product
- Shark meat
- Shark fin
- End-user
- Commercial
- Residential
- Type
- Frozen meat
- Fresh meat
- Canned meat
- Dried meat
- Smoked meat
- Geography
- North America
- US
- Canada
- Europe
- Portugal
- Spain
- APAC
- China
- India
- Indonesia
- Japan
- South Korea
- South America
- Brazil
- Rest of World (ROW)
- North America
By Product Insights
The Shark meat segment is estimated to witness significant growth during the forecast period. The market is an intricate blend of cultural traditions, economic requirements, and escalating conservation issues. In numerous coastal communities, shark meat is a vital protein source, deeply ingrained in local culinary practices and economies, predominantly in Asian, African, and Latin American regions. Consumption patterns vary from fresh fillets to dried, salted, or smoked preparations, primarily influenced by affordability and accessibility. However, this segment is under growing scrutiny due to overfishing and the ecological consequences of dwindling shark populations, which are essential for maintaining marine ecosystem equilibrium. Regulatory initiatives and international accords aim to mitigate unsustainable practices, but enforcement remains inconsistent.
Shark meat's nutritional composition, selective fishing techniques, and fishing gear selectivity are crucial elements of sustainable harvesting methods. Environmental impact studies, fish stock assessments, and fishing quota management are integral to ensuring long-term viability. Waste management solutions, aquaculture sustainability, and sustainable fishing practices are also vital in minimizing the segment's environmental footprint. Bycatch mitigation strategies, population dynamics modeling, and habitat protection measures are essential to preserving marine ecosystem health. Shark finning reduction, species distribution mapping, food safety regulations, and fishery management regulations are integral to market transparency and consumer trust.
Market price fluctuations and supply chain transparency are crucial factors influencing market dynamics. Processing techniques play a significant role in enhancing product quality and market appeal.
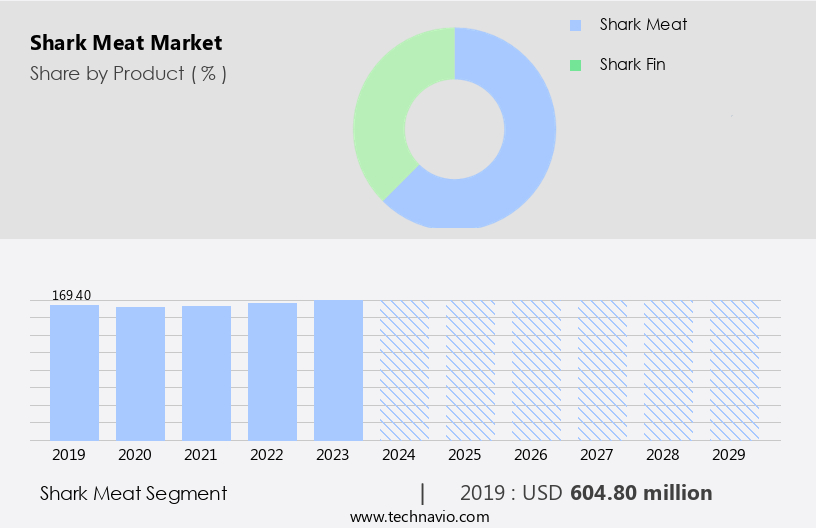
The Shark meat segment was valued at USD 604.80 million in 2019 and showed a gradual increase during the forecast period.
The Shark Meat Market is shaped by sustainable practices and growing consumer awareness. Central to supply is capture fisheries, which rely on regulated quotas and eco-conscious harvesting to maintain shark populations. Accurate species identification plays a critical role in differentiating between edible and protected varieties, ensuring legal compliance. Emphasis on water quality management in breeding and processing zones safeguards product integrity and environmental balance. Researchers support the market through shark lifecycle studies, aiding conservation efforts and responsible catch cycles. Additionally, robust crew training programs elevate operational standards, teaching ethical handling, safety, and regulatory adherence.
Regional Analysis
APAC is estimated to contribute 53% to the growth of the global market during the forecast period. Technavio’s analysts have elaborately explained the regional trends and drivers that shape the market during the forecast period.

In the market, predator-prey relationships play a significant role in maintaining marine ecosystem health. However, overfishing and illegal fishing practices pose threats to shark populations, necessitating impact assessments. Consumption patterns vary across regions, with shark meat being a staple in some Asian countries, particularly in China for shark fin soup. In Australia, shark meat is predominantly used in fish and chips. Environmental impact studies and fish stock assessments are crucial in ensuring sustainable harvesting methods. Selective fishing techniques and fishing gear selectivity are employed to minimize bycatch and reduce habitat destruction. Sustainable fishing practices, including population dynamics modeling and habitat protection measures, are essential to ensure long-term market growth.
Aquaculture sustainability and bycatch reduction devices are key initiatives to mitigate environmental concerns. Food safety regulations and fishery management regulations are in place to ensure the quality and safety of shark meat. Consumer demand analysis and market price fluctuation are critical factors influencing supply chain transparency and processing techniques. Marine protected areas and community involvement programs contribute to the conservation of shark populations and the overall health of marine ecosystems. Shark finning reduction and species distribution mapping are ongoing efforts to combat illegal fishing and ensure the sustainability of shark populations. Despite these initiatives, challenges persist, including the economic impact assessment of shark fishing and the potential negative consequences of shark meat consumption on population dynamics.
Continuous research and collaboration among stakeholders are necessary to ensure the long-term viability of the market.
Market Dynamics
Our researchers analyzed the data with 2024 as the base year, along with the key drivers, trends, and challenges. A holistic analysis of drivers will help companies refine their marketing strategies to gain a competitive advantage.
What are the key market drivers leading to the rise in the adoption of Shark Meat Industry?
- The market is driven primarily by the high nutritional value of the products offered. Shark meat is a highly sought-after nutritious seafood due to its rich content of vitamins, minerals, and healthy fats. The global demand for shark meat continues to grow as it is an excellent source of protein, providing 21 grams per 3.5-ounce serving, and essential nutrients like selenium. Selenium plays a crucial role in metabolism, digestion, and thyroid function, boosting the immune system and acting as a powerful antioxidant when combined with vitamin E. This nutrient helps prevent cell damage caused by free radicals. To ensure the sustainability of shark populations and minimize the environmental impact, selective fishing techniques and fishing gear with improved selectivity are employed.
- Sustainable harvesting methods, such as fish stock assessments and fishing quota management, are implemented to maintain healthy fish populations. Waste management solutions are also prioritized to minimize by-catch and reduce the impact on non-target species. Aquaculture sustainability is another approach to meet the increasing demand for shark meat while minimizing the environmental impact. Through the use of advanced technology and best practices, the aquaculture industry strives to produce shark meat in a responsible and sustainable manner. Environmental impact studies are conducted to assess the effects of shark farming on the ecosystem and ensure the implementation of eco-friendly practices.
What are the market trends shaping the Shark Meat Industry?
- The use of shark body parts in various applications is gaining increasing popularity and is considered the latest market trend. This emerging trend reflects the growing demand for innovative and sustainable solutions derived from shark by-products. The market is witnessing significant growth due to the expanding applications of shark body parts in various industries. Traditional uses of shark fin in making soups and shark meat for fish and chips remain prevalent. However, emerging applications in industries such as cosmetics and health supplements, particularly shark liver oil, are expected to fuel the demand for sharks.
- The applications of shark body parts extend to industries such as pharmaceuticals and nutraceuticals, where they are used for their unique properties. These developments underscore the importance of implementing effective conservation strategies and adhering to regulatory frameworks to ensure the long-term sustainability of the market. Sustainable fishing practices, population dynamics modeling, habitat protection measures, and bycatch mitigation strategies are crucial to ensure the health of marine ecosystems and the sustainability of the market. Shark finning reduction initiatives and species distribution mapping are essential to maintain the balance of marine ecosystems and ensure food safety regulations are met.
What challenges does the Shark Meat Industry face during its growth?
- The overexploitation and depletion of fish stocks pose a significant challenge to the growth and sustainability of the fishing industry. This issue, which arises from unsustainable fishing practices and environmental pressures, threatens the long-term viability of this essential sector and necessitates urgent action to ensure its continued growth and prosperity. The market faces significant challenges due to overexploitation and depletion of marine species. Commercial fishing and aquaculture are primary drivers for the market, but the long maturation time of sharks makes them particularly vulnerable to overfishing. International trade of shark products, including fins, meat, liver oil, cartilage, and skin, contributes to the depletion of fish stocks.
- Ocean conservation initiatives also contribute to the preservation of shark populations. Market price fluctuations impact the supply chain transparency and processing techniques used in the industry. Ensuring the ethical and sustainable sourcing of shark products is essential for maintaining the health of marine ecosystems and the long-term viability of the market. According to recent research, annual fishing mortality surpasses the intrinsic rebound potential for most commerially exploited shark species. To mitigate these challenges, fishery management regulations play a crucial role in ensuring sustainable practices. Community involvement programs and bycatch reduction devices are essential components of these regulations.
Exclusive Customer Landscape
The shark meat market forecasting report includes the adoption lifecycle of the market, covering from the innovator’s stage to the laggard’s stage. It focuses on adoption rates in different regions based on penetration. Furthermore, the shark meat market report also includes key purchase criteria and drivers of price sensitivity to help companies evaluate and develop their market growth analysis strategies.
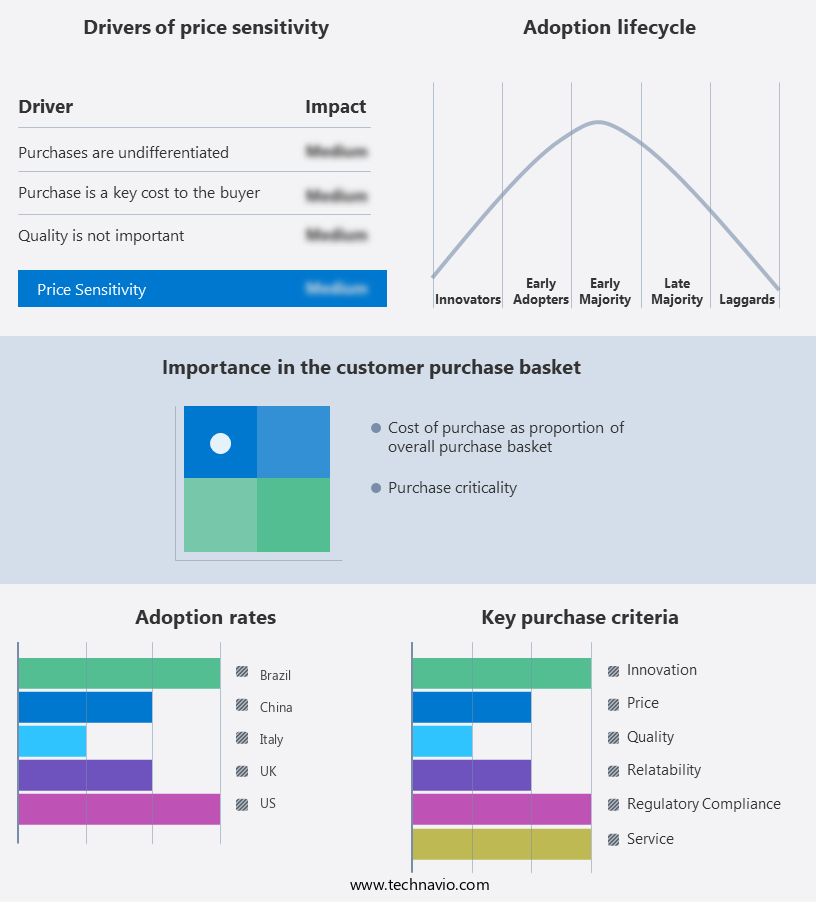
Customer Landscape
Key Companies & Market Insights
Companies are implementing various strategies, such as strategic alliances, shark meat market forecast, partnerships, mergers and acquisitions, geographical expansion, and product/service launches, to enhance their presence in the industry.
Aquafin Trade Inc. - The company specializes in providing high-quality shark meat products, including Blue Shark Steaks, to the global market.
The industry research and growth report includes detailed analyses of the competitive landscape of the market and information about key companies, including:
- Aquafin Trade Inc.
- Citarella
- Crystal Amusements Ltd.
- East Coast Seafood LLC
- Fujian Haoyuan Food Co. Ltd.
- Gaudets Seafood
- Marder Trawling Inc.
- Premier Seafood Ltd.
- Talleys
- Wellfleet Harbor Seafood Co. Inc.
- Wenzhou Haideli Shark Products Co. Ltd.
Qualitative and quantitative analysis of companies has been conducted to help clients understand the wider business environment as well as the strengths and weaknesses of key industry players. Data is qualitatively analyzed to categorize companies as pure play, category-focused, industry-focused, and diversified; it is quantitatively analyzed to categorize companies as dominant, leading, strong, tentative, and weak.
Recent Development and News in Shark Meat Market
- In January 2024, Sea Quest Fisheries, a leading shark meat processor, announced the launch of its new product line, "Premium Shark Sushi," in collaboration with renowned sushi chefs. This strategic partnership aimed to cater to the growing demand for high-quality shark meat in the sushi industry (Sea Quest Fisheries Press Release).
- In March 2024, Sharky's Fin, a major shark meat supplier, secured a strategic investment of USD15 million from Blue Horizon Ventures, a leading sustainable food investor. This funding round would support Sharky's Fin's expansion plans and technological advancements in sustainable shark fishing practices (Blue Horizon Ventures Press Release).
- In July 2024, the European Union (EU) approved the inclusion of shark meat in its Common Fisheries Policy. This policy change opened up new markets for shark meat producers, allowing them to export their products to EU countries (European Commission Press Release).
- In May 2025, Oceanic Technologies, a pioneer in shark meat processing technology, unveiled its new, patented, eco-friendly processing method. This innovation significantly reduced the environmental impact of shark meat production, addressing concerns about the industry's sustainability (Oceanic Technologies Press Release).
Research Analyst Overview
In the complex and dynamic market, various factors influence market activity and trends. Ecological interactions between shark populations and their prey, as well as with other species, play a crucial role in shaping fishery stock levels. Data collection methods, such as population monitoring and tagging, provide valuable insights into shark behavior and migration patterns. Fishing vessel management practices, including compliance monitoring and sustainable aquaculture, help ensure the long-term viability of the industry. Feed formulation and wastewater treatment are essential aspects of fish farming practices, contributing to food security issues and reducing environmental impact. Conservation biology and habitat restoration efforts aim to protect endangered shark species and maintain marine biodiversity.
Data analysis techniques, including risk assessment modeling and genetic diversity studies, inform fishery stock rebuilding and disease prevention strategies. Fishing gear technology and aquaculture technology advancements facilitate more efficient and selective capture of target species, reducing bycatch and minimizing harm to non-target species. Behavioral ecology research sheds light on shark feeding habits and social structures, informing predator control measures and sustainable fishing practices. Environmental monitoring and finning regulations ensure the responsible management of shark populations and the preservation of their critical habitats.
The Shark Meat Market is increasingly influenced by sustainability and regulatory frameworks. A vital concern is overfishing impact assessment, which helps monitor population decline and ecological imbalances caused by excessive harvest. Government and conservation agencies are ramping up illegal fishing detection using satellite monitoring, smart buoys, and AI-driven surveillance tools to identify unlawful activity and protect endangered species.
Dive into Technavio’s robust research methodology, blending expert interviews, extensive data synthesis, and validated models for unparalleled Shark Meat Market insights. See full methodology.
|
Market Scope |
|
|
Report Coverage |
Details |
|
Page number |
208 |
|
Base year |
2024 |
|
Historic period |
2019-2023 |
|
Forecast period |
2025-2029 |
|
Growth momentum & CAGR |
Accelerate at a CAGR of 2.4% |
|
Market growth 2025-2029 |
USD 147.9 million |
|
Market structure |
Concentrated |
|
YoY growth 2024-2025(%) |
2.4 |
|
Key countries |
Indonesia, US, Japan, India, Spain, Portugal, South Korea, China, Canada, and Brazil |
|
Competitive landscape |
Leading Companies, Market Positioning of Companies, Competitive Strategies, and Industry Risks |
What are the Key Data Covered in this Shark Meat Market Research and Growth Report?
- CAGR of the Shark Meat industry during the forecast period
- Detailed information on factors that will drive the growth and forecasting between 2025 and 2029
- Precise estimation of the size of the market and its contribution of the industry in focus to the parent market
- Accurate predictions about upcoming growth and trends and changes in consumer behaviour
- Growth of the market across APAC, Europe, North America, South America, and Middle East and Africa
- Thorough analysis of the market’s competitive landscape and detailed information about companies
- Comprehensive analysis of factors that will challenge the shark meat market growth of industry companies
We can help! Our analysts can customize this shark meat market research report to meet your requirements.
 RIA -
RIA - 
