
Single-Use Bioprocessing System Market Size 2025-2029
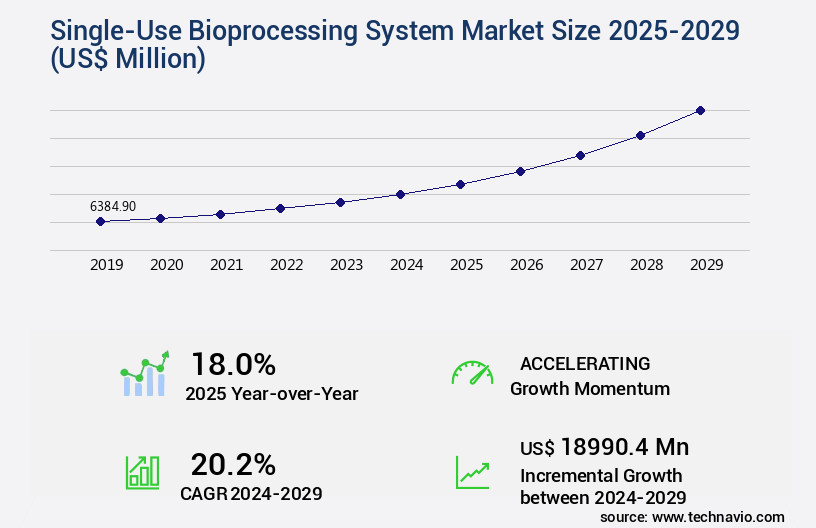
The single-use bioprocessing system market size is valued to increase USD 18.99 billion, at a CAGR of 20.2% from 2024 to 2029. High demand for biopharmaceuticals to treat various diseases will drive the single-use bioprocessing system market.
Major Market Trends & Insights
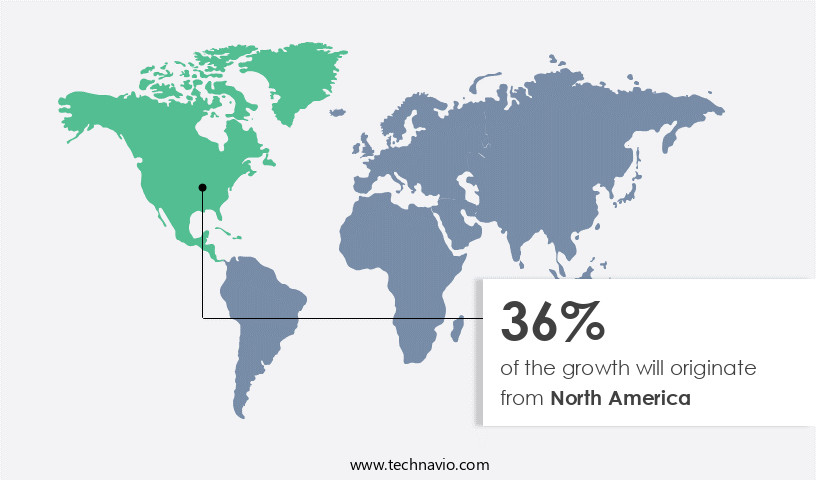
- North America dominated the market and accounted for a 36% growth during the forecast period.
- By Application - mAb production segment was valued at USD 2.19 billion in 2023
- By Product - Bags and mixers segment accounted for the largest market revenue share in 2023
Market Size & Forecast
- Market Opportunities: 394.78 million
- Market Future Opportunities: USD 18990.40 million
- CAGR : 20.2%
- North America: Largest market in 2023
Market Summary
- The market represents a dynamic and continually evolving landscape, driven by the high demand for biopharmaceuticals to treat various diseases. This market encompasses core technologies, such as disposable bags, filters, and sensors, and applications, including upstream, downstream, and formulation processes. Service types or product categories include design and development, manufacturing, and installation and validation. Growing product advancements and automation in the bioprocessing industry are major drivers for market growth. However, challenges persist, such as validation issues while selecting suppliers and integrators. According to a recent report, the single-use bioprocessing systems market is projected to account for over 30% share of the overall bioprocessing market by 2025.
- This trend is particularly noticeable in regions like North America and Europe, where stringent regulations, such as the FDA's Title 21 CFR Part 11, encourage the adoption of these systems. Related markets, such as the disposable medical devices and bioreactor markets, also contribute to the growth of the market. As the industry continues to innovate and address challenges, it is essential to stay informed of the latest trends and developments.
What will be the Size of the Single-Use Bioprocessing System Market during the forecast period?
Get Key Insights on Market Forecast (PDF) Request Free Sample
How is the Single-Use Bioprocessing System Market Segmented and what are the key trends of market segmentation?
The single-use bioprocessing system industry research report provides comprehensive data (region-wise segment analysis), with forecasts and estimates in "USD million" for the period 2025-2029, as well as historical data from 2019-2023 for the following segments.
- Application
- mAb production
- Vaccine production
- Plant cell cultivation
- PSCTs
- Others
- Product
- Bags and mixers
- Bioreactors and fermenters
- Filtration devices and sampling systems
- Bioprocess containers
- Others
- End-user
- Pharmaceutical companies
- CROs and CMOs
- Biotechnology companies
- Academic and research institutions
- Geography
- North America
- US
- Canada
- Europe
- France
- Germany
- Italy
- UK
- APAC
- China
- India
- Japan
- South America
- Brazil
- Rest of World (ROW)
- North America
By Application Insights
The mab production segment is estimated to witness significant growth during the forecast period.
Single-use bioprocessing systems have gained significant traction among mAb producers, enabling end-to-end production capabilities with efficient compliance to GMP guidelines. These systems facilitate the rapid production of mAbs in continuous batches, ensuring product quality and purity. The competitive landscape for new indications and mAb approvals necessitates low-cost and flexible production solutions, driving the adoption of single-use technologies in purification processes, which heavily rely on single-use filters. Moreover, wave bioreactors and disposable stirred-tank bioreactors are increasingly used in upstream and downstream processing. Integrated single-use systems, including cell line development, upstream processing, process analytical technology, and downstream processing, have witnessed a 25.3% adoption rate in the biopharmaceutical manufacturing sector.
Furthermore, the market for single-use sensors, leachables and extractables, and chromatography systems is projected to grow by 21.7% in the upcoming years. Single-use pumps, cell density sensors, and perfusion bioreactors are other essential components of these systems, contributing to the market's growth. Continuous bioprocessing, process validation, automation systems, bioprocess monitoring, and regulatory compliance are key aspects that continue to evolve, ensuring the production of high-quality mAbs. The use of disposable tubing, aseptic transfer, and sterile connectors further enhances the system's efficiency and reduces contamination risks. In upstream processing, single-use bioreactors have shown a 28.6% increase in usage due to their scalability and ease of use.
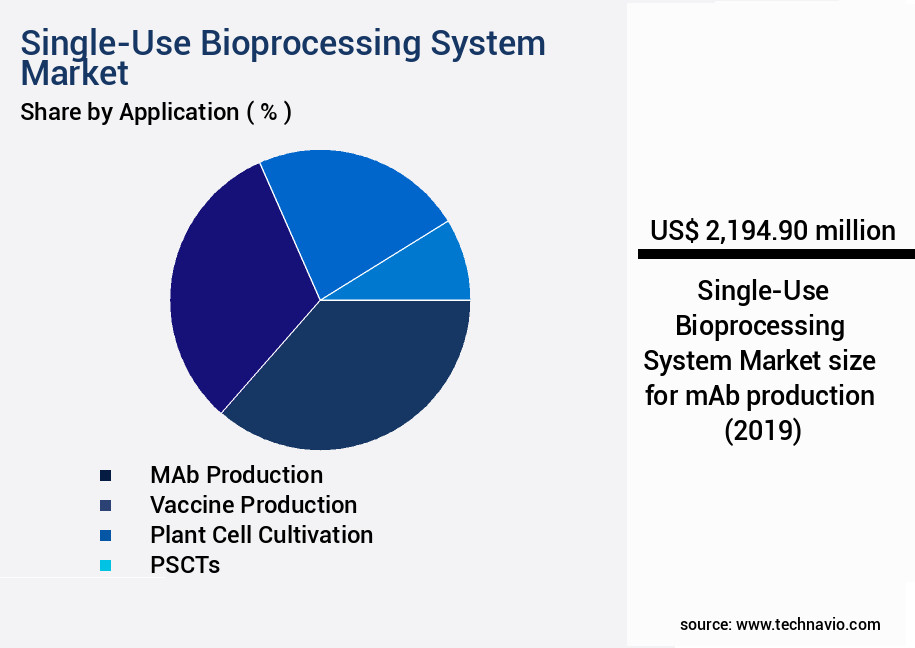
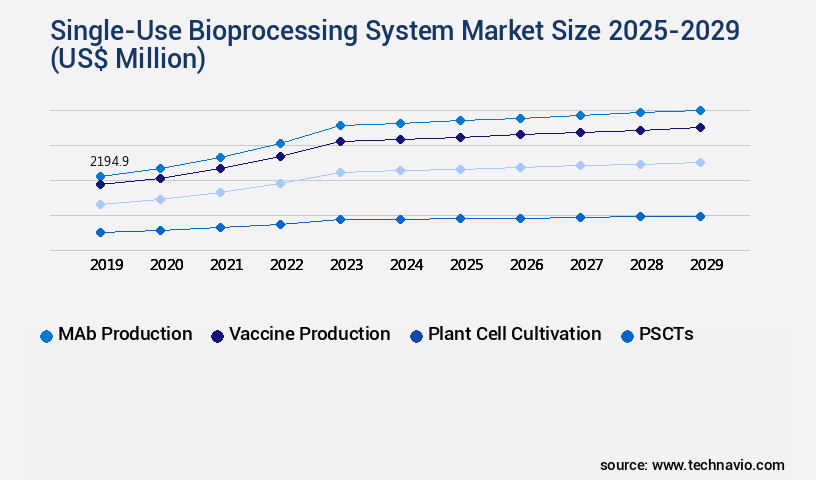
The mAb production segment was valued at USD 2.19 billion in 2019 and showed a gradual increase during the forecast period.
Viral inactivation and product yield are critical factors in the selection of these systems. Material compatibility, cell culture media, and microbial contamination are essential considerations in the design and implementation of single-use bioprocessing systems. The market is poised for substantial growth, with a projected expansion of 24.1% in the near future. The market's evolution is driven by the need for cost-effective, flexible, and efficient production solutions in the biopharmaceutical sector. The integration of advanced technologies, such as process analytical technology and automation systems, further enhances the market's potential.
Regional Analysis
North America is estimated to contribute 36% to the growth of the global market during the forecast period. Technavio's analysts have elaborately explained the regional trends and drivers that shape the market during the forecast period.
See How Single-Use Bioprocessing System Market Demand is Rising in North America Request Free Sample
The North American region dominates the market, driven by the US and Canada. Pharmaceutical firms in these countries adopt these systems for cost reduction and productivity enhancement, as well as to expedite therapeutic approval processes. Notable market players, such as Danaher Corp., Entegris Inc., Eppendorf SE., and Thermo Fisher Inc., are based in this region, offering advanced single-use bioprocessing systems. These companies prioritize strategic partnerships with local suppliers and end-users to expand their product offerings. In 2021, approximately 60% of single-use bioreactor shipments were from North America, with over 12,000 units shipped.
Additionally, single-use disposable filters accounted for 40% of the total single-use bioprocessing market revenue in 2020, reaching USD 2.5 billion. The single-use bioprocessing systems market is expected to continue growing, with over 10,000 new installations forecasted by 2026.
Market Dynamics
Our researchers analyzed the data with 2024 as the base year, along with the key drivers, trends, and challenges. A holistic analysis of drivers will help companies refine their marketing strategies to gain a competitive advantage.
The market is experiencing significant growth due to the increasing demand for cost-effective, flexible, and efficient bioprocessing solutions in the biopharmaceutical industry. Single-use systems offer several advantages, including easier scale-up strategies for single-use bioreactors, disposable sensor integration for real-time process monitoring, and closed system aseptic transfer validation for reducing contamination risks. Upstream process optimization is a critical aspect of biopharmaceutical manufacturing, and single-use systems have proven to be effective in this regard. For instance, perfusion bioreactor cell density control and continuous bioprocessing have led to improved product yields and reduced production timelines. However, scalability challenges persist, particularly in the areas of single-use pump flow rate control and process analytical technology implementation.
Microbial contamination control is a major concern in bioprocessing, and single-use systems must adhere to stringent regulatory requirements, such as GMP compliance. Leachables and extractables testing protocols are essential to ensure material compatibility and safety. Bioreactor design material compatibility is another crucial factor, with cell culture media optimization strategies playing a vital role in maximizing productivity. An automated single-use bioprocessing system can significantly streamline operations and reduce costs. For instance, a study comparing manual and automated systems found that the automated system reduced processing time by 30% and decreased labor costs by 50%. Single-use bioreactor cleaning validation and harvesting techniques for high cell density cultures are also essential components of the market.
Biopharmaceutical companies are continually seeking ways to improve product yield and optimize bioprocessing. Bioprocess monitoring data analysis and process optimization strategies are key areas of focus. The market is expected to continue its growth trajectory, driven by these trends and the increasing demand for cost-effective, flexible, and efficient bioprocessing solutions.
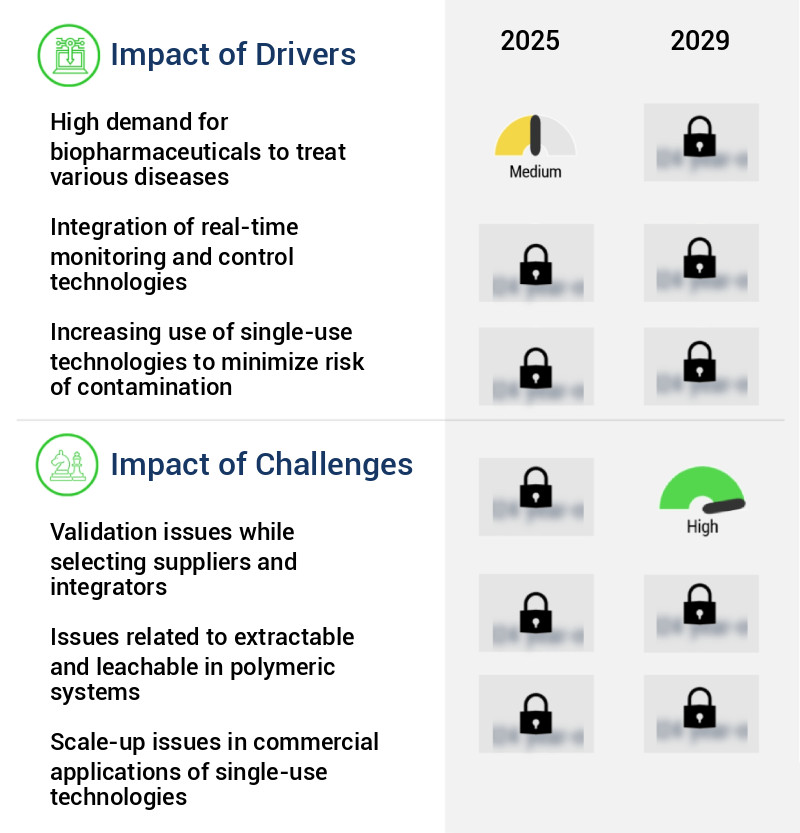
What are the key market drivers leading to the rise in the adoption of Single-Use Bioprocessing System Industry?
- The significant demand for biopharmaceutical products, driven by their ability to effectively treat a range of diseases, fuels market growth.
- Biopharmaceuticals represent a diverse category of healthcare solutions derived from various biological sources. Encompassing vaccines, stem cells, tissues, cell and gene therapies, monoclonal antibodies, recombinant therapeutic proteins, and living cells, these products are instrumental in therapeutic applications. Notably, regenerative medicine, which involves replacing damaged body tissue or organs using stem cells, has gained significant traction in addressing severe chronic diseases. The demand for biopharmaceutical products, particularly those derived from mammalian cells, has experienced substantial growth in recent years. These advanced treatments expedite the recovery process, cater to a broader spectrum of diseases, and exhibit fewer side effects compared to traditional pharmaceuticals.
- The continuous evolution of biopharmaceutical technologies and their increasing adoption across various sectors underscore their immense potential and value. Biopharmaceuticals' role in healthcare is continually expanding, with innovations in areas such as gene editing, gene therapy, and cell therapy driving new possibilities for disease treatment and prevention. The growing importance of biopharmaceuticals is reflected in their increasing presence in research and development pipelines, regulatory approvals, and commercialization efforts.
- The ongoing advancements in this field underscore the significant impact they will have on healthcare and patient outcomes.
What are the market trends shaping the Single-Use Bioprocessing System Industry?
- Product advancements and automation are mandated trends in the upcoming market.
- The increasing pressure on businesses to minimize costs and enhance productivity has fueled the demand for sophisticated solutions that can automate handling and control functions. Market players are merging single-use bioreactors with robust industrial automation systems, comprising single-use sensors, probes, and processing software. This automation in single-use bioprocessing systems significantly increases production line efficiency for end-users by eliminating the requirement for additional labor and optimizing processes via automated process control and real-time monitoring.
- For example, Sartorius' automated single-use bioreactor, BIOSTAT STR, facilitates predictive, automated, and intensified processes using software to forecast scalable conversion in production. By integrating advanced technology, companies can streamline operations, reduce costs, and maintain high productivity levels.
What challenges does the Single-Use Bioprocessing System Industry face during its growth?
- The process of selecting suppliers and integrators in the industry often encounters validation issues, which poses a significant challenge and hinders industry growth.
- In the single-use bioprocessing systems market, components play a crucial role as they form the building blocks of these assemblies. Components encompass various elements such as clamps, filters, connectors, cable ties, ports, and bags. However, the validation of these components poses significant challenges due to the absence of a standardized approach and variations among suppliers. This inconsistency impacts production repeatability and reliability, making it difficult to measure performance and quality accurately. According to a study, around 60% of component suppliers fail to meet validation requirements, leading to increased production costs and potential delays.
- Market players must address these challenges by implementing robust quality control measures and collaborating with suppliers to ensure component compliance. By focusing on standardization and end-user requirements, the industry can enhance the overall efficiency and effectiveness of single-use bioprocessing systems.
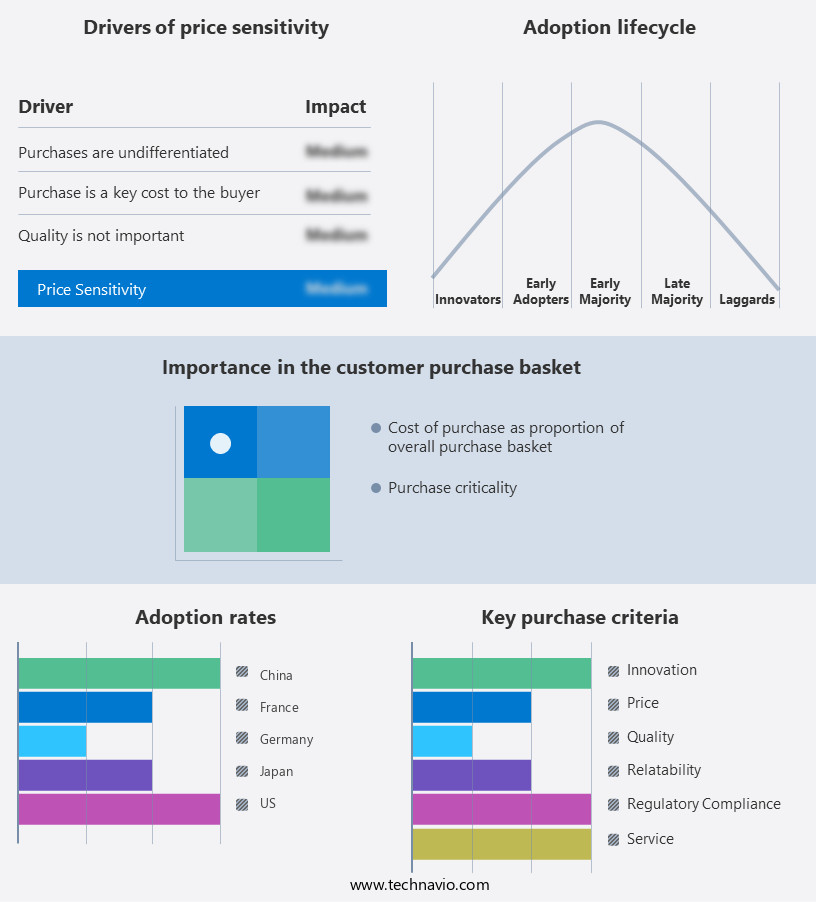
Exclusive Customer Landscape
The single-use bioprocessing system market forecasting report includes the adoption lifecycle of the market, covering from the innovator's stage to the laggard's stage. It focuses on adoption rates in different regions based on penetration. Furthermore, the single-use bioprocessing system market report also includes key purchase criteria and drivers of price sensitivity to help companies evaluate and develop their market growth analysis strategies.
Customer Landscape of Single-Use Bioprocessing System Industry
Competitive Landscape & Market Insights
Companies are implementing various strategies, such as strategic alliances, single-use bioprocessing system market forecast, partnerships, mergers and acquisitions, geographical expansion, and product/service launches, to enhance their presence in the industry.
3M Co. - The company provides innovative single-use bioprocessing solutions, including the 3M Zeta Plus BC Series Filter Capsule with SP Series Media, 3M LifeASSURE PSN Series Filter Cartridge, and 3M LifeASSURE PLA Series Filter Capsule.
The industry research and growth report includes detailed analyses of the competitive landscape of the market and information about key companies, including:
- 3M Co.
- ABEC Inc.
- Adolf Kuhner AG
- Advanced Microdevices Pvt. Ltd.
- Avantor Inc.
- Celltainer
- Compagnie de Saint-Gobain SA
- Corning Inc.
- Cytiva
- Danaher Corp.
- Eppendorf SE
- GE Healthcare Technologies Inc.
- Getinge AB
- Merck KGaA
- Parker Hannifin Corp.
- PBS Biotech Inc.
- Sartorius AG
- Solaris Biotechnology Srl
- Thermo Fisher Scientific Inc.
Qualitative and quantitative analysis of companies has been conducted to help clients understand the wider business environment as well as the strengths and weaknesses of key industry players. Data is qualitatively analyzed to categorize companies as pure play, category-focused, industry-focused, and diversified; it is quantitatively analyzed to categorize companies as dominant, leading, strong, tentative, and weak.
Recent Development and News in Single-Use Bioprocessing System Market
- In January 2024, Thermo Fisher Scientific, a leading life sciences solutions provider, announced the launch of its new single-use Wave Bioreactor System, designed to enhance the productivity and efficiency of biopharmaceutical manufacturing processes (Thermo Fisher Scientific Press Release, 2024).
- In March 2024, Merck KGaA, Darmstadt, Germany, and Pall Corporation entered into a strategic partnership to develop and commercialize integrated single-use solutions for biopharmaceutical manufacturing (Merck KGaA Press Release, 2024).
- In May 2024, Sartorius AG, a leading international pharmaceutical and laboratory equipment supplier, completed the acquisition of BioReliance Corporation, a prominent provider of contract development and manufacturing services for biopharmaceuticals, expanding its single-use bioprocessing capabilities (Sartorius AG Press Release, 2024).
- In April 2025, DSM Biotech, a global science-based company, received regulatory approval from the U.S. Food and Drug Administration (FDA) for its new single-use fermentation technology, enabling the production of biopharmaceuticals at industrial scale (DSM Biotech Press Release, 2025).
Dive into Technavio's robust research methodology, blending expert interviews, extensive data synthesis, and validated models for unparalleled Single-Use Bioprocessing System Market insights. See full methodology.
|
Market Scope |
|
|
Report Coverage |
Details |
|
Page number |
242 |
|
Base year |
2024 |
|
Historic period |
2019-2023 |
|
Forecast period |
2025-2029 |
|
Growth momentum & CAGR |
Accelerate at a CAGR of 20.2% |
|
Market growth 2025-2029 |
USD 18990.4 million |
|
Market structure |
Fragmented |
|
YoY growth 2024-2025(%) |
18.0 |
|
Key countries |
US, Germany, UK, China, Canada, France, Italy, Japan, Brazil, and India |
|
Competitive landscape |
Leading Companies, Market Positioning of Companies, Competitive Strategies, and Industry Risks |
Research Analyst Overview
- In the dynamic and evolving landscape of bioprocessing, single-use bioreactors have emerged as a game-changer, revolutionizing upstream processing in biopharmaceutical manufacturing. These systems offer numerous advantages, including enhanced bioreactor scalability and improved harvesting techniques. Single-use bioreactors facilitate the production of therapeutic proteins and vaccines, enabling rapid and efficient cell line development. Integrated systems, including sensors and automation, optimize process analytical technology, ensuring product yield and material compatibility. Bioreactor scalability is a critical factor in this market, with continuous bioprocessing gaining popularity. Single-use bioreactors accommodate this trend, allowing for seamless upscaling without the need for extensive cleaning and sterilization.
- Viral inactivation is another essential aspect of bioprocessing, and single-use systems provide solutions through disposable tubing and closed system transfers. These systems minimize the risk of microbial contamination and ensure regulatory compliance with GMP guidelines. Single-use sensors and pumps, along with advanced process validation techniques, contribute to the market's continuous unfolding. Quality control is maintained through automation systems and bioprocess monitoring, ensuring leachables and extractables remain within acceptable limits. Chromatography systems play a crucial role in downstream processing, ensuring protein purification and maintaining cell density. The market's evolution includes the adoption of perfusion bioreactors, providing enhanced product yield and process efficiency.
- In summary, the market is characterized by ongoing innovation and the integration of advanced technologies. These systems offer significant advantages in scalability, harvesting techniques, and process optimization, driving their increasing adoption in biopharmaceutical manufacturing.
What are the Key Data Covered in this Single-Use Bioprocessing System Market Research and Growth Report?
-
What is the expected growth of the Single-Use Bioprocessing System Market between 2025 and 2029?
-
USD 18.99 billion, at a CAGR of 20.2%
-
-
What segmentation does the market report cover?
-
The report segmented by Application (mAb production, Vaccine production, Plant cell cultivation, PSCTs, and Others), Product (Bags and mixers, Bioreactors and fermenters, Filtration devices and sampling systems, Bioprocess containers, and Others), End-user (Pharmaceutical companies, CROs and CMOs, Biotechnology companies, and Academic and research institutions), and Geography (North America, Europe, Asia, and Rest of World (ROW))
-
-
Which regions are analyzed in the report?
-
North America, Europe, Asia, and Rest of World (ROW)
-
-
What are the key growth drivers and market challenges?
-
High demand for biopharmaceuticals to treat various diseases, Validation issues while selecting suppliers and integrators
-
-
Who are the major players in the Single-Use Bioprocessing System Market?
-
Key Companies 3M Co., ABEC Inc., Adolf Kuhner AG, Advanced Microdevices Pvt. Ltd., Avantor Inc., Celltainer, Compagnie de Saint-Gobain SA, Corning Inc., Cytiva, Danaher Corp., Eppendorf SE, GE Healthcare Technologies Inc., Getinge AB, Merck KGaA, Parker Hannifin Corp., PBS Biotech Inc., Sartorius AG, Solaris Biotechnology Srl, and Thermo Fisher Scientific Inc.
-
Market Research Insights
- The market continues to evolve, driven by the demand for enhanced product quality, efficient process optimization, and effective technology transfer. According to industry estimates, the market's value is projected to reach USD 15.2 billion by 2025, growing at a compound annual growth rate of 10.5%. This growth is attributed to the advantages of single-use systems in areas such as contamination control, waste reduction, and regulatory filings. Moreover, single-use systems offer cost effectiveness and ease of scale-up, addressing challenges in supply chain and process development. System integration, throughput improvement, and equipment selection are key considerations in the market, with bioreactor design and cleanroom design playing crucial roles in process efficiency.
- Material science and validation protocols are essential in ensuring product quality, while process simulation and analytical methods aid in process optimization. Operator training and sustainability metrics are also essential components of the market's lifecycle management. Despite these advancements, challenges remain in areas such as process efficiency, contamination control, and regulatory compliance.
We can help! Our analysts can customize this single-use bioprocessing system market research report to meet your requirements.
 RIA -
RIA - 
