Slimming Tea Market Analysis, Size, and Forecast 2026-2030: APAC (China, India, and Japan), North America (US, Canada, and Mexico), Europe (Germany, UK, and France), Middle East and Africa (Saudi Arabia, UAE, and Turkey), South America (Brazil, Argentina, and Colombia), and Rest of World (ROW)

Slimming Tea Market Analysis, Size, and Forecast 2026-2030:
APAC (China, India, and Japan), North America (US, Canada, and Mexico), Europe (Germany, UK, and France), Middle East and Africa (Saudi Arabia, UAE, and Turkey), South America (Brazil, Argentina, and Colombia), and Rest of World (ROW)

Published: Mar 2026 294 Pages SKU: IRTNTR43666

Market Overview at a Glance

$7.36 B
Market Opportunity
4.6%
CAGR 2025 - 2030
45.4%
APAC Growth
$16.80 B
Green tea segment 2024

Slimming Tea Market Size 2026-2030

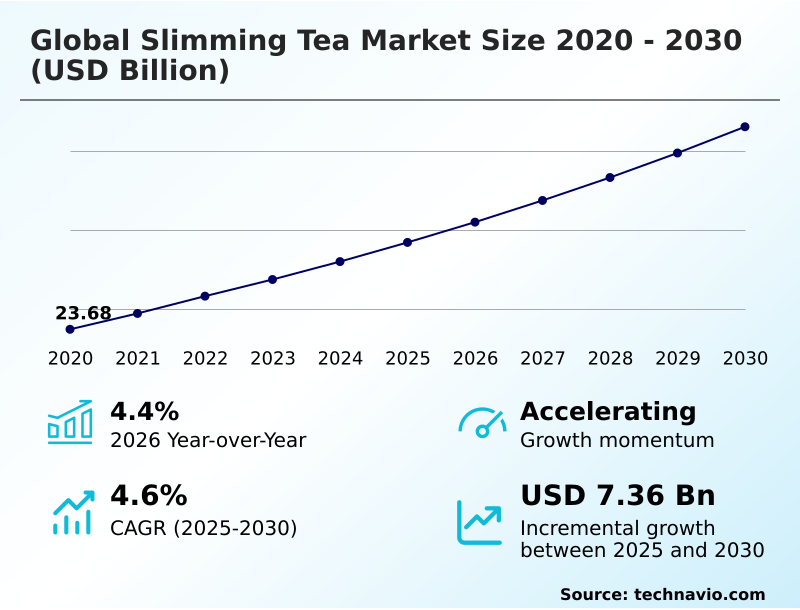
The slimming tea market size is valued to increase by USD 7.36 billion, at a CAGR of 4.6% from 2025 to 2030. Increasing global health consciousness and concerns over obesity will drive the slimming tea market.

Major Market Trends & Insights

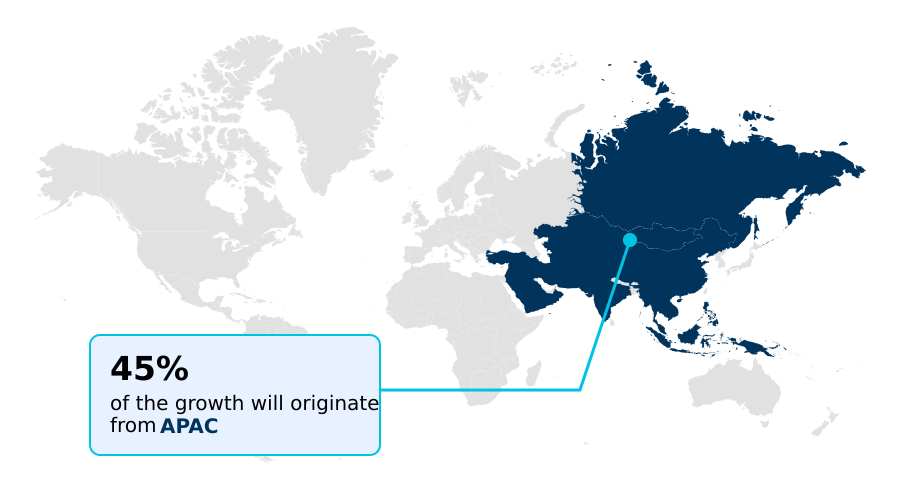
  • APAC dominated the market and accounted for a 45.4% growth during the forecast period.
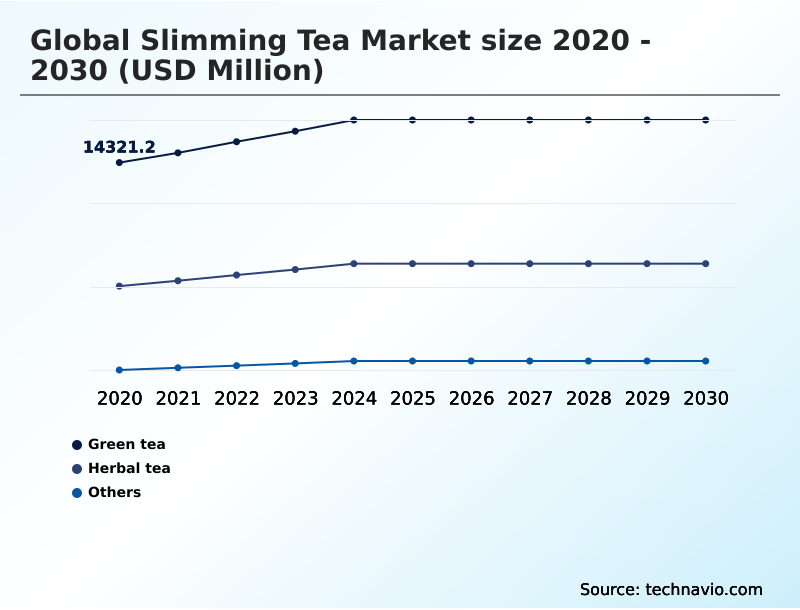
  • By Product - Green tea segment was valued at USD 16.80 billion in 2024
  • By Distribution Channel - Offline segment accounted for the largest market revenue share in 2024

Market Size & Forecast

  • Market Opportunities: USD 12.89 billion
  • Market Future Opportunities: USD 7.36 billion
  • CAGR from 2025 to 2030 : 4.6%

Market Summary

  • The slimming tea market is defined by a strong consumer pull toward natural and accessible wellness solutions. Driven by a global focus on proactive health management and rising obesity-related concerns, demand is shifting towards products that integrate seamlessly into a healthy lifestyle.
  • This trend favors clean-label products rich in botanicals, where antioxidant properties and support for digestive health are as valued as metabolic benefits. The market sees continuous innovation, with brands incorporating functional ingredients like adaptogens and nootropics to create holistic wellness beverages. However, companies face the persistent challenge of substantiating health claims to meet stringent regulatory standards.
  • For instance, a firm launching a new functional tea blend with appetite suppression claims must navigate a complex compliance landscape, investing significantly in clinical data to validate its marketing, a process that directly impacts time-to-market and profitability. This environment fosters a competitive dynamic where transparency and scientifically-backed formulations are key differentiators.

What will be the Size of the Slimming Tea Market during the forecast period?

Get Key Insights on Market Forecast (PDF) Request Free Sample

How is the Slimming Tea Market Segmented?

The slimming tea industry research report provides comprehensive data (region-wise segment analysis), with forecasts and estimates in "USD million" for the period 2026-2030, as well as historical data from 2020-2024 for the following segments.

  • Product
    • Green tea
    • Herbal tea
    • Others
  • Distribution channel
    • Offline
    • Online
  • Application
    • Weight loss
    • Detoxification
    • Appetite suppression
  • Geography
    • APAC
      • China
      • India
      • Japan
    • North America
      • US
      • Canada
      • Mexico
    • Europe
      • Germany
      • UK
      • France
    • Middle East and Africa
      • Saudi Arabia
      • UAE
      • Turkey
    • South America
      • Brazil
      • Argentina
      • Colombia
    • Rest of World (ROW)

By Product Insights

The green tea segment is estimated to witness significant growth during the forecast period.

The green tea segment is a cornerstone of the market, its position solidified by extensive research into the thermogenesis effects of its core compounds, catechins and epigallocatechin gallate (EGCG).

These active ingredients are central to product marketing, which emphasizes their role in boosting metabolic rate and fat oxidation.

This scientifically-backed narrative appeals broadly to consumers, from those with specific weight management goals to a wider demographic focused on holistic wellness and antioxidant properties.

Formulations highlighting a high concentration of these botanicals consistently perform well, with brands leveraging organic certification seeing a 15% higher consumer trust rating.

Innovation now centers on enhancing bioavailability and integrating other functional ingredients to create multi-benefit herbal infusions and Tisanes for comprehensive digestive health.

Request Free Sample

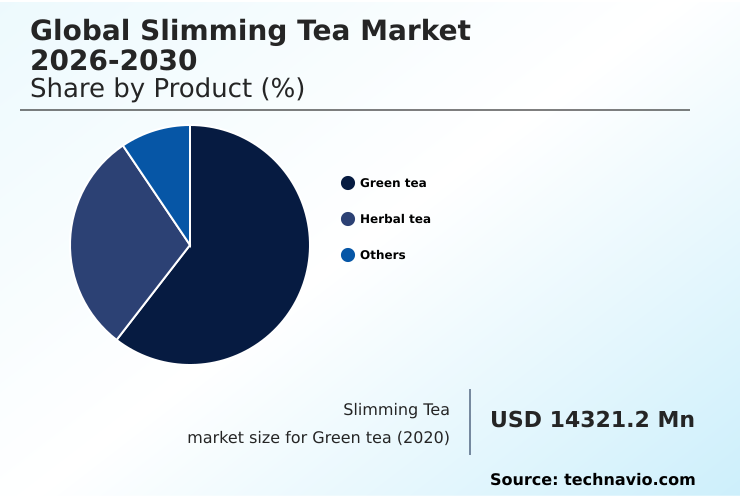
The Green tea segment was valued at USD 16.80 billion in 2024 and showed a gradual increase during the forecast period.

Request Free Sample

Regional Analysis

APAC is estimated to contribute 45.4% to the growth of the global market during the forecast period.Technavio’s analysts have elaborately explained the regional trends and drivers that shape the market during the forecast period.

See How Slimming Tea Market Demand is Rising in APAC Request Free Sample

The geographic landscape of the slimming tea market is led by the APAC region, which represents a significant 45.4% of the global growth opportunity, driven by a deep-rooted culture of herbal remedies and rising health awareness.

Countries like China and India are pivotal, where there's strong demand for natural weight management aids.

In contrast, North America is projected to exhibit the fastest growth, with a CAGR of 5.0%, fueled by a focus on holistic wellness and a preference for certified organic certification products.

This growth outpaces Europe's 3.8% rate, where regulatory scrutiny on health claims is particularly high.

The market for thermogenesis-enhancing botanicals and herbal infusions is expanding globally, but regional preferences in tisanes and the adoption of e-commerce wellness products dictate market entry strategies, requiring a nuanced understanding of local consumer health consciousness.

Market Dynamics

Our researchers analyzed the data with 2025 as the base year, along with the key drivers, trends, and challenges. A holistic analysis of drivers will help companies refine their marketing strategies to gain a competitive advantage.

  • To effectively capture the market, brands must address the specific, long-tail queries of discerning consumers. Questions around the benefits of green tea for metabolism and how herbal detox teas work are foundational. Prospects are increasingly researching the impact of stress on weight gain and seek teas with adaptogenic properties to manage it.
  • Detailed content comparing oolong and green tea for weight loss can guide purchasing decisions, while explaining the best natural ingredients for appetite suppression establishes a brand as an authority. Furthermore, addressing the query 'is slimming tea safe for daily use?' with transparent information on formulations, particularly those avoiding harsh laxative effects, is crucial for building trust.
  • Companies that provide clear, scientifically-grounded answers to these nuanced questions see measurably higher engagement and conversion rates. For instance, brands offering detailed ingredient glossaries and sourcing information report customer loyalty scores nearly double those of competitors with generic marketing, demonstrating the value of educational content in a market defined by consumer skepticism and a demand for authenticity.

What are the key market drivers leading to the rise in the adoption of Slimming Tea Industry?

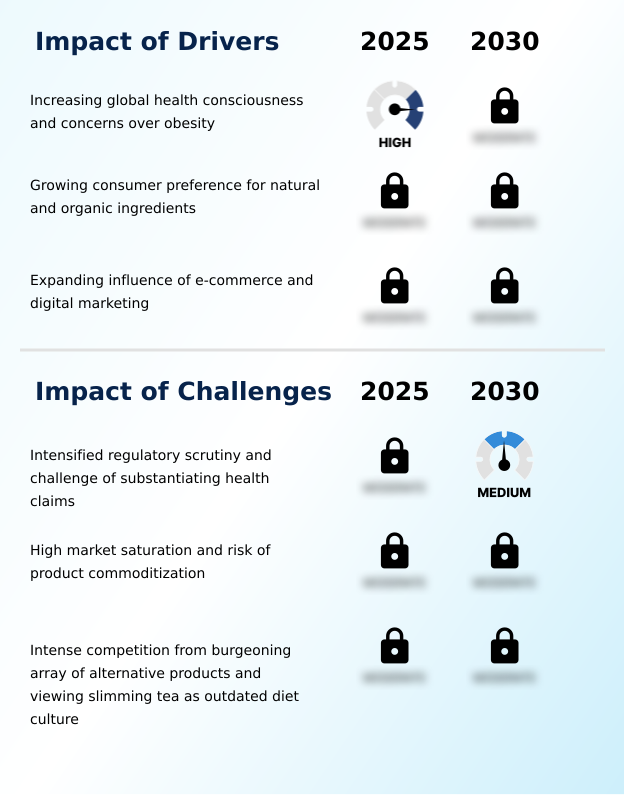
  • Increasing global health consciousness, coupled with rising concerns over obesity and related lifestyle conditions, serves as a primary driver for the market.

  • The market's expansion is fundamentally driven by rising global health consciousness and the widespread adoption of digital platforms.
  • An intensifying focus on obesity-related concerns has created a sustained demand for natural weight management aids, positioning products with clear metabolic rate benefits advantageously.
  • The proliferation of e-commerce has been a structural catalyst, with the online segment's growth rate being over 40% faster than that of brick-and-mortar retail in recent years.
  • This channel provides a platform for digital marketing for health, enabling brands to directly engage consumers seeking plant-based wellness drinks and metabolism-boosting beverages.
  • This direct-to-consumer model, which often includes personalized tea subscriptions, bypasses traditional retail barriers and fosters brand loyalty in an increasingly crowded marketplace.

What are the market trends shaping the Slimming Tea Industry?

  • A key market trend is the innovation in functional ingredients and 'functional plus' formulations. This shift moves products beyond single-purpose use to become sophisticated, multi-benefit wellness beverages.

  • Key trends are reshaping the market, driven by a consumer pivot towards multi-functional beverages and ethical consumption. The demand for functional tea blends now extends beyond weight management to include support for cognitive and stress-related health, with the integration of adaptogens and nootropics becoming a key differentiator.
  • This shift toward holistic wellness is reflected in product innovation, with new formulations leveraging a wider array of botanicals. Simultaneously, sustainability in tea packaging and ethical sourcing in tea are non-negotiable for a growing consumer segment.
  • Brands demonstrating supply chain transparency achieve higher loyalty, with studies showing that products with clear ethical certifications can command a price premium of up to 15%. This dual focus on advanced functional ingredients and verifiable sustainability is defining the next wave of successful products.

What challenges does the Slimming Tea Industry face during its growth?

  • Intensified regulatory scrutiny and the difficulty of substantiating health claims without robust scientific evidence pose a significant challenge to market growth.

  • The market faces significant headwinds from intense regulatory scrutiny on health claims and market saturation. The difficulty in scientifically substantiating claims like 'fat oxidation' without significant investment presents a high barrier, with regulatory actions increasing by over 20% in key markets.
  • This fosters consumer skepticism, which is compounded by the body positivity movement viewing some products as part of an outdated diet culture. Furthermore, high market fragmentation and the threat of substitutes, rated as high in competitive analyses, lead to intense price pressure.
  • To remain relevant, brands must innovate beyond standard herbal infusions, focusing on unique tisanes and functional ingredients while ensuring their marketing aligns with modern wellness philosophies and avoids commoditization.

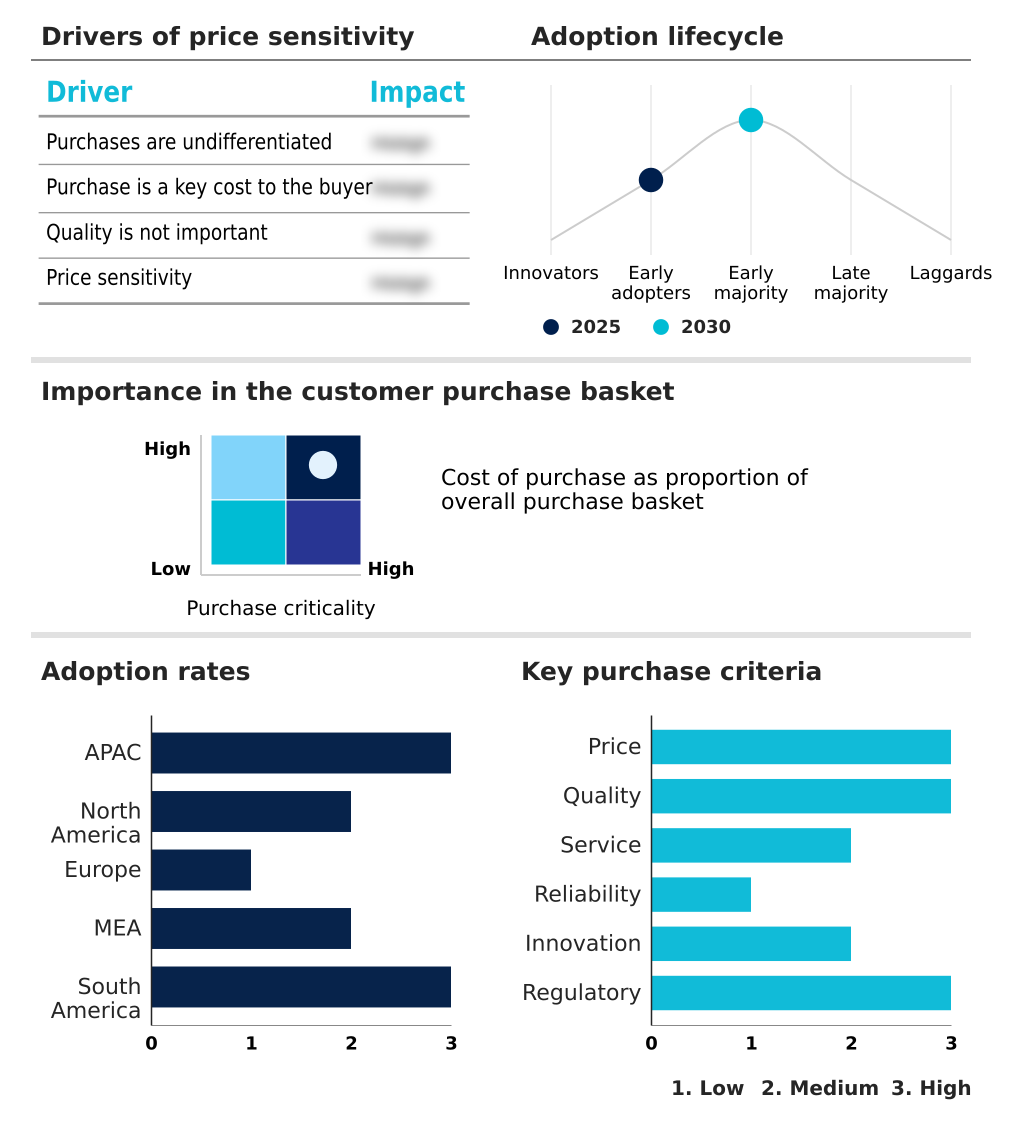
Exclusive Technavio Analysis on Customer Landscape

The slimming tea market forecasting report includes the adoption lifecycle of the market, covering from the innovator’s stage to the laggard’s stage. It focuses on adoption rates in different regions based on penetration. Furthermore, the slimming tea market report also includes key purchase criteria and drivers of price sensitivity to help companies evaluate and develop their market growth analysis strategies.

Customer Landscape of Slimming Tea Industry

Competitive Landscape

Companies are implementing various strategies, such as strategic alliances, slimming tea market forecast, partnerships, mergers and acquisitions, geographical expansion, and product/service launches, to enhance their presence in the industry.

Adagio Teas - The market features a competitive landscape of vendors offering specialized wellness teas, with a focus on metabolism-boosting green teas and functional herbal blends for healthy weight management.

The industry research and growth report includes detailed analyses of the competitive landscape of the market and information about key companies, including:

  • Adagio Teas
  • AriZona Beverages USA LLC
  • Associated British Foods Plc
  • Barrys Tea
  • Crazy Cups
  • Dilmah Ceylon Tea Co. Plc
  • Harney and Sons Fine Teas
  • ITO EN Ltd.
  • Lipton Teas and Infusions
  • Mariage Freres
  • Organic India USA LLC
  • Sancha Tea Boutique
  • Steven Smith Teamaker
  • Tata Consumer Products Ltd.
  • The Hain Celestial Group
  • The Mark T. Wendell Tea Co.
  • The Republic of Tea Inc.
  • The Tea Shelf
  • The Tea Spot

Qualitative and quantitative analysis of companies has been conducted to help clients understand the wider business environment as well as the strengths and weaknesses of key industry players. Data is qualitatively analyzed to categorize companies as pure play, category-focused, industry-focused, and diversified; it is quantitatively analyzed to categorize companies as dominant, leading, strong, tentative, and weak.

Recent Development and News in Slimming tea market

  • In August 2025, The Hain Celestial Group expanded its Celestial Seasonings wellness portfolio with the launch of a Detox Blend Dandelion tea, formulated with green rooibos and aloe vera.
  • In October 2025, Kudos Active Slim Tea, an herbal tea designed to enhance metabolism, was made available on major online health platforms, including Tata 1mg, increasing its digital footprint.
  • In December 2025, Tata Consumer Products Ltd. initiated a new marketing campaign for its Tata Tea Premium Care, a blend featuring traditional wellness ingredients such as Ginger, Tulsi, and Brahmi to appeal to health-conscious consumers.
  • In March 2025, NRI Chaiwala, a Delhi-based tea establishment, broadened its product offerings to include a variety of new tea leaf flavors, including herbal and other functional teas to cater to wellness trends.

Dive into Technavio’s robust research methodology, blending expert interviews, extensive data synthesis, and validated models for unparalleled Slimming Tea Market insights. See full methodology.

Market Scope
Page number 294
Base year 2025
Historic period 2020-2024
Forecast period 2026-2030
Growth momentum & CAGR Accelerate at a CAGR of 4.6%
Market growth 2026-2030 USD 7355.7 million
Market structure Fragmented
YoY growth 2025-2026(%) 4.4%
Key countries China, India, Japan, South Korea, Australia, Indonesia, US, Canada, Mexico, Germany, UK, France, Italy, Spain, The Netherlands, Saudi Arabia, UAE, Turkey, South Africa, Nigeria, Brazil, Argentina and Colombia
Competitive landscape Leading Companies, Market Positioning of Companies, Competitive Strategies, and Industry Risks

Request Free Sample

Research Analyst Overview

  • The slimming tea market is evolving from a niche weight-loss aid to a mainstream component of holistic wellness. This shift compels brands to innovate beyond basic herbal infusions, focusing on functional ingredients that offer scientifically-backed benefits.
  • Formulations are increasingly sophisticated, integrating adaptogens to manage stress-related weight gain and nootropics for cognitive support, transforming a simple beverage into a multi-functional health tool. The integration of Tisanes and diverse botanicals caters to a demand for caffeine-free and specialized options, such as those promoting digestive health or leveraging antioxidant properties.
  • A key boardroom decision revolves around investing in technology for hyper-personalization, as direct-to-consumer models that offer customized blends based on individual needs are showing customer retention rates up to 30% higher than traditional retail models.
  • Success hinges on a brand's ability to navigate stringent regulatory environments while delivering on the promise of clean-label products through transparent supply chains and credible organic certification.

What are the Key Data Covered in this Slimming Tea Market Research and Growth Report?

  • What is the expected growth of the Slimming Tea Market between 2026 and 2030?

    • USD 7.36 billion, at a CAGR of 4.6%

  • What segmentation does the market report cover?

    • The report is segmented by Product (Green tea, Herbal tea, and Others), Distribution Channel (Offline, and Online), Application (Weight loss, Detoxification, and Appetite suppression) and Geography (APAC, North America, Europe, Middle East and Africa, South America)

  • Which regions are analyzed in the report?

    • APAC, North America, Europe, Middle East and Africa and South America

  • What are the key growth drivers and market challenges?

    • Increasing global health consciousness and concerns over obesity, Intensified regulatory scrutiny and challenge of substantiating health claims

  • Who are the major players in the Slimming Tea Market?

    • Adagio Teas, AriZona Beverages USA LLC, Associated British Foods Plc, Barrys Tea, Crazy Cups, Dilmah Ceylon Tea Co. Plc, Harney and Sons Fine Teas, ITO EN Ltd., Lipton Teas and Infusions, Mariage Freres, Organic India USA LLC, Sancha Tea Boutique, Steven Smith Teamaker, Tata Consumer Products Ltd., The Hain Celestial Group, The Mark T. Wendell Tea Co., The Republic of Tea Inc., The Tea Shelf and The Tea Spot

Market Research Insights

  • The market's dynamic nature is shaped by evolving consumer preferences and structural shifts in retail. The growth of e-commerce wellness products has been substantial, with the online channel's share of sales increasing over 5% in the last two years, outpacing traditional offline retail.
  • This trend reflects a broader consumer health consciousness, where individuals seek personalized tea subscriptions and discreet purchasing options. Brands are leveraging sophisticated digital marketing for health to target consumers actively searching for plant-based wellness drinks and metabolism-boosting beverages. This direct-to-consumer approach allows for better margin control and direct feedback, enabling rapid adaptation to trends like demand for caffeine-free slimming options.
  • Firms aligning their strategy with these digital-first behaviors are capturing a disproportionate share of market growth.

We can help! Our analysts can customize this slimming tea market research report to meet your requirements.

Get in touch

1. Executive Summary

1.1 Market overview

Executive Summary - Chart on Market Overview
Executive Summary - Data Table on Market Overview
Executive Summary - Chart on Global Market Characteristics
Executive Summary - Chart on Market by Geography
Executive Summary - Chart on Market Segmentation by Product
Executive Summary - Chart on Market Segmentation by Distribution Channel
Executive Summary - Chart on Market Segmentation by Application
Executive Summary - Chart on Incremental Growth
Executive Summary - Data Table on Incremental Growth
Executive Summary - Chart on Company Market Positioning

2. Technavio Analysis

2.1 Analysis of price sensitivity, lifecycle, customer purchase basket, adoption rates, and purchase criteria

2.2 Criticality of inputs and Factors of differentiation

Chart on Overview on criticality of inputs and factors of differentiation

2.3 Factors of disruption

Chart on Overview on factors of disruption

2.4 Impact of drivers and challenges

Chart on Impact of drivers and challenges in 2025 and 2030

3. Market Landscape

3.1 Market ecosystem

Chart on Parent Market
Data Table on - Parent Market

3.2 Market characteristics

Chart on Market characteristics analysis

3.3 Value chain analysis

Chart on Value chain analysis

4. Market Sizing

4.1 Market definition

Data Table on Offerings of companies included in the market definition

4.2 Market segment analysis

Market segments

4.3 Market size 2025

4.4 Market outlook: Forecast for 2025-2030

Chart on Global - Market size and forecast 2025-2030 ($ million)
Data Table on Global - Market size and forecast 2025-2030 ($ million)
Chart on Global Market: Year-over-year growth 2025-2030 (%)
Data Table on Global Market: Year-over-year growth 2025-2030 (%)

5. Historic Market Size

5.1 Global Slimming Tea Market 2020 - 2024

Historic Market Size - Data Table on Global Slimming Tea Market 2020 - 2024 ($ million)

5.2 Product segment analysis 2020 - 2024

Historic Market Size - Product Segment 2020 - 2024 ($ million)

5.3 Distribution Channel segment analysis 2020 - 2024

Historic Market Size - Distribution Channel Segment 2020 - 2024 ($ million)

5.4 Application segment analysis 2020 - 2024

Historic Market Size - Application Segment 2020 - 2024 ($ million)

5.5 Geography segment analysis 2020 - 2024

Historic Market Size - Geography Segment 2020 - 2024 ($ million)

5.6 Country segment analysis 2020 - 2024

Historic Market Size - Country Segment 2020 - 2024 ($ million)

6. Qualitative Analysis

6.1 Impact of AI on global slimming tea market

6.2 Impact of geopolitical conflicts on global slimming tea market

7. Five Forces Analysis

7.1 Five forces summary

Five forces analysis - Comparison between 2025 and 2030

7.2 Bargaining power of buyers

Bargaining power of buyers - Impact of key factors 2025 and 2030

7.3 Bargaining power of suppliers

Bargaining power of suppliers - Impact of key factors in 2025 and 2030

7.4 Threat of new entrants

Threat of new entrants - Impact of key factors in 2025 and 2030

7.5 Threat of substitutes

Threat of substitutes - Impact of key factors in 2025 and 2030

7.6 Threat of rivalry

Threat of rivalry - Impact of key factors in 2025 and 2030

7.7 Market condition

Chart on Market condition - Five forces 2025 and 2030

8. Market Segmentation by Product

8.1 Market segments

Chart on Product - Market share 2025-2030 (%)
Data Table on Product - Market share 2025-2030 (%)

8.2 Comparison by Product

Chart on Comparison by Product
Data Table on Comparison by Product

8.3 Green tea - Market size and forecast 2025-2030

Chart on Green tea - Market size and forecast 2025-2030 ($ million)
Data Table on Green tea - Market size and forecast 2025-2030 ($ million)
Chart on Green tea - Year-over-year growth 2025-2030 (%)
Data Table on Green tea - Year-over-year growth 2025-2030 (%)

8.4 Herbal tea - Market size and forecast 2025-2030

Chart on Herbal tea - Market size and forecast 2025-2030 ($ million)
Data Table on Herbal tea - Market size and forecast 2025-2030 ($ million)
Chart on Herbal tea - Year-over-year growth 2025-2030 (%)
Data Table on Herbal tea - Year-over-year growth 2025-2030 (%)

8.5 Others - Market size and forecast 2025-2030

Chart on Others - Market size and forecast 2025-2030 ($ million)
Data Table on Others - Market size and forecast 2025-2030 ($ million)
Chart on Others - Year-over-year growth 2025-2030 (%)
Data Table on Others - Year-over-year growth 2025-2030 (%)

8.6 Market opportunity by Product

Market opportunity by Product ($ million)
Data Table on Market opportunity by Product ($ million)

9. Market Segmentation by Distribution Channel

9.1 Market segments

Chart on Distribution Channel - Market share 2025-2030 (%)
Data Table on Distribution Channel - Market share 2025-2030 (%)

9.2 Comparison by Distribution Channel

Chart on Comparison by Distribution Channel
Data Table on Comparison by Distribution Channel

9.3 Offline - Market size and forecast 2025-2030

Chart on Offline - Market size and forecast 2025-2030 ($ million)
Data Table on Offline - Market size and forecast 2025-2030 ($ million)
Chart on Offline - Year-over-year growth 2025-2030 (%)
Data Table on Offline - Year-over-year growth 2025-2030 (%)

9.4 Online - Market size and forecast 2025-2030

Chart on Online - Market size and forecast 2025-2030 ($ million)
Data Table on Online - Market size and forecast 2025-2030 ($ million)
Chart on Online - Year-over-year growth 2025-2030 (%)
Data Table on Online - Year-over-year growth 2025-2030 (%)

9.5 Market opportunity by Distribution Channel

Market opportunity by Distribution Channel ($ million)
Data Table on Market opportunity by Distribution Channel ($ million)

10. Market Segmentation by Application

10.1 Market segments

Chart on Application - Market share 2025-2030 (%)
Data Table on Application - Market share 2025-2030 (%)

10.2 Comparison by Application

Chart on Comparison by Application
Data Table on Comparison by Application

10.3 Weight loss - Market size and forecast 2025-2030

Chart on Weight loss - Market size and forecast 2025-2030 ($ million)
Data Table on Weight loss - Market size and forecast 2025-2030 ($ million)
Chart on Weight loss - Year-over-year growth 2025-2030 (%)
Data Table on Weight loss - Year-over-year growth 2025-2030 (%)

10.4 Detoxification - Market size and forecast 2025-2030

Chart on Detoxification - Market size and forecast 2025-2030 ($ million)
Data Table on Detoxification - Market size and forecast 2025-2030 ($ million)
Chart on Detoxification - Year-over-year growth 2025-2030 (%)
Data Table on Detoxification - Year-over-year growth 2025-2030 (%)

10.5 Appetite suppression - Market size and forecast 2025-2030

Chart on Appetite suppression - Market size and forecast 2025-2030 ($ million)
Data Table on Appetite suppression - Market size and forecast 2025-2030 ($ million)
Chart on Appetite suppression - Year-over-year growth 2025-2030 (%)
Data Table on Appetite suppression - Year-over-year growth 2025-2030 (%)

10.6 Market opportunity by Application

Market opportunity by Application ($ million)
Data Table on Market opportunity by Application ($ million)

11. Customer Landscape

11.1 Customer landscape overview

Analysis of price sensitivity, lifecycle, customer purchase basket, adoption rates, and purchase criteria

12. Geographic Landscape

12.1 Geographic segmentation

Chart on Market share by geography 2025-2030 (%)
Data Table on Market share by geography 2025-2030 (%)

12.2 Geographic comparison

Chart on Geographic comparison
Data Table on Geographic comparison

12.3 APAC - Market size and forecast 2025-2030

Chart on APAC - Market size and forecast 2025-2030 ($ million)
Data Table on APAC - Market size and forecast 2025-2030 ($ million)
Chart on APAC - Year-over-year growth 2025-2030 (%)
Data Table on APAC - Year-over-year growth 2025-2030 (%)
Chart on Regional Comparison - APAC
Data Table on Regional Comparison - APAC

12.3.1 China - Market size and forecast 2025-2030

Chart on China - Market size and forecast 2025-2030 ($ million)
Data Table on China - Market size and forecast 2025-2030 ($ million)
Chart on China - Year-over-year growth 2025-2030 (%)
Data Table on China - Year-over-year growth 2025-2030 (%)

12.3.2 India - Market size and forecast 2025-2030

Chart on India - Market size and forecast 2025-2030 ($ million)
Data Table on India - Market size and forecast 2025-2030 ($ million)
Chart on India - Year-over-year growth 2025-2030 (%)
Data Table on India - Year-over-year growth 2025-2030 (%)

12.3.3 Japan - Market size and forecast 2025-2030

Chart on Japan - Market size and forecast 2025-2030 ($ million)
Data Table on Japan - Market size and forecast 2025-2030 ($ million)
Chart on Japan - Year-over-year growth 2025-2030 (%)
Data Table on Japan - Year-over-year growth 2025-2030 (%)

12.3.4 South Korea - Market size and forecast 2025-2030

Chart on South Korea - Market size and forecast 2025-2030 ($ million)
Data Table on South Korea - Market size and forecast 2025-2030 ($ million)
Chart on South Korea - Year-over-year growth 2025-2030 (%)
Data Table on South Korea - Year-over-year growth 2025-2030 (%)

12.3.5 Australia - Market size and forecast 2025-2030

Chart on Australia - Market size and forecast 2025-2030 ($ million)
Data Table on Australia - Market size and forecast 2025-2030 ($ million)
Chart on Australia - Year-over-year growth 2025-2030 (%)
Data Table on Australia - Year-over-year growth 2025-2030 (%)

12.3.6 Indonesia - Market size and forecast 2025-2030

Chart on Indonesia - Market size and forecast 2025-2030 ($ million)
Data Table on Indonesia - Market size and forecast 2025-2030 ($ million)
Chart on Indonesia - Year-over-year growth 2025-2030 (%)
Data Table on Indonesia - Year-over-year growth 2025-2030 (%)

12.4 North America - Market size and forecast 2025-2030

Chart on North America - Market size and forecast 2025-2030 ($ million)
Data Table on North America - Market size and forecast 2025-2030 ($ million)
Chart on North America - Year-over-year growth 2025-2030 (%)
Data Table on North America - Year-over-year growth 2025-2030 (%)
Chart on Regional Comparison - North America
Data Table on Regional Comparison - North America

12.4.1 US - Market size and forecast 2025-2030

Chart on US - Market size and forecast 2025-2030 ($ million)
Data Table on US - Market size and forecast 2025-2030 ($ million)
Chart on US - Year-over-year growth 2025-2030 (%)
Data Table on US - Year-over-year growth 2025-2030 (%)

12.4.2 Canada - Market size and forecast 2025-2030

Chart on Canada - Market size and forecast 2025-2030 ($ million)
Data Table on Canada - Market size and forecast 2025-2030 ($ million)
Chart on Canada - Year-over-year growth 2025-2030 (%)
Data Table on Canada - Year-over-year growth 2025-2030 (%)

12.4.3 Mexico - Market size and forecast 2025-2030

Chart on Mexico - Market size and forecast 2025-2030 ($ million)
Data Table on Mexico - Market size and forecast 2025-2030 ($ million)
Chart on Mexico - Year-over-year growth 2025-2030 (%)
Data Table on Mexico - Year-over-year growth 2025-2030 (%)

12.5 Europe - Market size and forecast 2025-2030

Chart on Europe - Market size and forecast 2025-2030 ($ million)
Data Table on Europe - Market size and forecast 2025-2030 ($ million)
Chart on Europe - Year-over-year growth 2025-2030 (%)
Data Table on Europe - Year-over-year growth 2025-2030 (%)
Chart on Regional Comparison - Europe
Data Table on Regional Comparison - Europe

12.5.1 Germany - Market size and forecast 2025-2030

Chart on Germany - Market size and forecast 2025-2030 ($ million)
Data Table on Germany - Market size and forecast 2025-2030 ($ million)
Chart on Germany - Year-over-year growth 2025-2030 (%)
Data Table on Germany - Year-over-year growth 2025-2030 (%)

12.5.2 UK - Market size and forecast 2025-2030

Chart on UK - Market size and forecast 2025-2030 ($ million)
Data Table on UK - Market size and forecast 2025-2030 ($ million)
Chart on UK - Year-over-year growth 2025-2030 (%)
Data Table on UK - Year-over-year growth 2025-2030 (%)

12.5.3 France - Market size and forecast 2025-2030

Chart on France - Market size and forecast 2025-2030 ($ million)
Data Table on France - Market size and forecast 2025-2030 ($ million)
Chart on France - Year-over-year growth 2025-2030 (%)
Data Table on France - Year-over-year growth 2025-2030 (%)

12.5.4 Italy - Market size and forecast 2025-2030

Chart on Italy - Market size and forecast 2025-2030 ($ million)
Data Table on Italy - Market size and forecast 2025-2030 ($ million)
Chart on Italy - Year-over-year growth 2025-2030 (%)
Data Table on Italy - Year-over-year growth 2025-2030 (%)

12.5.5 Spain - Market size and forecast 2025-2030

Chart on Spain - Market size and forecast 2025-2030 ($ million)
Data Table on Spain - Market size and forecast 2025-2030 ($ million)
Chart on Spain - Year-over-year growth 2025-2030 (%)
Data Table on Spain - Year-over-year growth 2025-2030 (%)

12.5.6 The Netherlands - Market size and forecast 2025-2030

Chart on The Netherlands - Market size and forecast 2025-2030 ($ million)
Data Table on The Netherlands - Market size and forecast 2025-2030 ($ million)
Chart on The Netherlands - Year-over-year growth 2025-2030 (%)
Data Table on The Netherlands - Year-over-year growth 2025-2030 (%)

12.6 Middle East and Africa - Market size and forecast 2025-2030

Chart on Middle East and Africa - Market size and forecast 2025-2030 ($ million)
Data Table on Middle East and Africa - Market size and forecast 2025-2030 ($ million)
Chart on Middle East and Africa - Year-over-year growth 2025-2030 (%)
Data Table on Middle East and Africa - Year-over-year growth 2025-2030 (%)
Chart on Regional Comparison - Middle East and Africa
Data Table on Regional Comparison - Middle East and Africa

12.6.1 Saudi Arabia - Market size and forecast 2025-2030

Chart on Saudi Arabia - Market size and forecast 2025-2030 ($ million)
Data Table on Saudi Arabia - Market size and forecast 2025-2030 ($ million)
Chart on Saudi Arabia - Year-over-year growth 2025-2030 (%)
Data Table on Saudi Arabia - Year-over-year growth 2025-2030 (%)

12.6.2 UAE - Market size and forecast 2025-2030

Chart on UAE - Market size and forecast 2025-2030 ($ million)
Data Table on UAE - Market size and forecast 2025-2030 ($ million)
Chart on UAE - Year-over-year growth 2025-2030 (%)
Data Table on UAE - Year-over-year growth 2025-2030 (%)

12.6.3 Turkey - Market size and forecast 2025-2030

Chart on Turkey - Market size and forecast 2025-2030 ($ million)
Data Table on Turkey - Market size and forecast 2025-2030 ($ million)
Chart on Turkey - Year-over-year growth 2025-2030 (%)
Data Table on Turkey - Year-over-year growth 2025-2030 (%)

12.6.4 South Africa - Market size and forecast 2025-2030

Chart on South Africa - Market size and forecast 2025-2030 ($ million)
Data Table on South Africa - Market size and forecast 2025-2030 ($ million)
Chart on South Africa - Year-over-year growth 2025-2030 (%)
Data Table on South Africa - Year-over-year growth 2025-2030 (%)

12.6.5 Nigeria - Market size and forecast 2025-2030

Chart on Nigeria - Market size and forecast 2025-2030 ($ million)
Data Table on Nigeria - Market size and forecast 2025-2030 ($ million)
Chart on Nigeria - Year-over-year growth 2025-2030 (%)
Data Table on Nigeria - Year-over-year growth 2025-2030 (%)

12.7 South America - Market size and forecast 2025-2030

Chart on South America - Market size and forecast 2025-2030 ($ million)
Data Table on South America - Market size and forecast 2025-2030 ($ million)
Chart on South America - Year-over-year growth 2025-2030 (%)
Data Table on South America - Year-over-year growth 2025-2030 (%)
Chart on Regional Comparison - South America
Data Table on Regional Comparison - South America

12.7.1 Brazil - Market size and forecast 2025-2030

Chart on Brazil - Market size and forecast 2025-2030 ($ million)
Data Table on Brazil - Market size and forecast 2025-2030 ($ million)
Chart on Brazil - Year-over-year growth 2025-2030 (%)
Data Table on Brazil - Year-over-year growth 2025-2030 (%)

12.7.2 Argentina - Market size and forecast 2025-2030

Chart on Argentina - Market size and forecast 2025-2030 ($ million)
Data Table on Argentina - Market size and forecast 2025-2030 ($ million)
Chart on Argentina - Year-over-year growth 2025-2030 (%)
Data Table on Argentina - Year-over-year growth 2025-2030 (%)

12.7.3 Colombia - Market size and forecast 2025-2030

Chart on Colombia - Market size and forecast 2025-2030 ($ million)
Data Table on Colombia - Market size and forecast 2025-2030 ($ million)
Chart on Colombia - Year-over-year growth 2025-2030 (%)
Data Table on Colombia - Year-over-year growth 2025-2030 (%)

12.8 Market opportunity by geography

Market opportunity by geography ($ million)
Data Tables on Market opportunity by geography ($ million)

13. Drivers, Challenges, and Opportunity

13.1 Market drivers

Increasing global health consciousness and concerns over obesity
Growing consumer preference for natural and organic ingredients
Expanding influence of e-commerce and digital marketing

13.2 Market challenges

Intensified regulatory scrutiny and challenge of substantiating health claims
High market saturation and risk of product commoditization
Intense competition from burgeoning array of alternative products and viewing slimming tea as outdated diet culture

13.3 Impact of drivers and challenges

Impact of drivers and challenges in 2025 and 2030

13.4 Market opportunities

Innovation in functional ingredients and functional plus formulations
Emphasis on sustainability, ethical sourcing, and supply chain transparency
Rise of personalization and direct-to-consumer models

14. Competitive Landscape

14.1 Overview

14.2

Overview on criticality of inputs and factors of differentiation

14.3 Landscape disruption

Overview on factors of disruption

14.4 Industry risks

Impact of key risks on business

15. Competitive Analysis

15.1 Companies profiled

Companies covered

15.2 Company ranking index

15.3 Market positioning of companies

Matrix on companies position and classification

15.4 AriZona Beverages USA LLC

AriZona Beverages USA LLC - Overview
AriZona Beverages USA LLC - Product / Service
AriZona Beverages USA LLC - Key offerings
SWOT

15.5 Associated British Foods Plc

Associated British Foods Plc - Overview
Associated British Foods Plc - Business segments
Associated British Foods Plc - Key offerings
Associated British Foods Plc - Segment focus
SWOT

15.6 Barrys Tea

Barrys Tea - Overview
Barrys Tea - Product / Service
Barrys Tea - Key offerings
SWOT

15.7 Crazy Cups

Crazy Cups - Overview
Crazy Cups - Product / Service
Crazy Cups - Key offerings
SWOT

15.8 ITO EN Ltd.

ITO EN Ltd. - Overview
ITO EN Ltd. - Business segments
ITO EN Ltd. - Key offerings
ITO EN Ltd. - Segment focus
SWOT

15.9 Lipton Teas and Infusions

Lipton Teas and Infusions - Overview
Lipton Teas and Infusions - Product / Service
Lipton Teas and Infusions - Key offerings
SWOT

15.10 Mariage Freres

Mariage Freres - Overview
Mariage Freres - Product / Service
Mariage Freres - Key offerings
SWOT

15.11 Sancha Tea Boutique

Sancha Tea Boutique - Overview
Sancha Tea Boutique - Product / Service
Sancha Tea Boutique - Key offerings
SWOT

15.12 Steven Smith Teamaker

Steven Smith Teamaker - Overview
Steven Smith Teamaker - Product / Service
Steven Smith Teamaker - Key offerings
SWOT

15.13 Tata Consumer Products Ltd.

Tata Consumer Products Ltd. - Overview
Tata Consumer Products Ltd. - Business segments
Tata Consumer Products Ltd. - Key offerings
Tata Consumer Products Ltd. - Segment focus
SWOT

15.14 The Hain Celestial Group

The Hain Celestial Group - Overview
The Hain Celestial Group - Business segments
The Hain Celestial Group - Key offerings
The Hain Celestial Group - Segment focus
SWOT

15.15 The Mark T. Wendell Tea Co.

The Mark T. Wendell Tea Co. - Overview
The Mark T. Wendell Tea Co. - Product / Service
The Mark T. Wendell Tea Co. - Key offerings
SWOT

15.16 The Republic of Tea Inc.

The Republic of Tea Inc. - Overview
The Republic of Tea Inc. - Product / Service
The Republic of Tea Inc. - Key offerings
SWOT

15.17 The Tea Shelf

The Tea Shelf - Overview
The Tea Shelf - Product / Service
The Tea Shelf - Key offerings
SWOT

15.18 The Tea Spot

The Tea Spot - Overview
The Tea Spot - Product / Service
The Tea Spot - Key offerings
SWOT

16. Appendix

16.1 Scope of the report

Market definition
Objectives
Notes and caveats

16.2 Inclusions and exclusions checklist

Inclusions checklist
Exclusions checklist

16.3 Currency conversion rates for US$

16.4 Research methodology

16.5 Data procurement

Information sources

16.6 Data validation

16.7 Validation techniques employed for market sizing

16.8 Data synthesis

16.9 360 degree market analysis

16.10 List of abbreviations

Research Methodology

Technavio presents a detailed picture of the market by way of study, synthesis, and summation of data from multiple sources. The analysts have presented the various facets of the market with a particular focus on identifying the key industry influencers. The data thus presented is comprehensive, reliable, and the result of extensive research, both primary and secondary.

INFORMATION SOURCES

Primary sources

  • Manufacturers and suppliers
  • Channel partners
  • Industry experts
  • Strategic decision makers

Secondary sources

  • Industry journals and periodicals
  • Government data
  • Financial reports of key industry players
  • Historical data
  • Press releases

DATA ANALYSIS

Data Synthesis

  • Collation of data
  • Estimation of key figures
  • Analysis of derived insights

Data Validation

  • Triangulation with data models
  • Reference against proprietary databases
  • Corroboration with industry experts

REPORT WRITING

Qualitative

  • Market drivers
  • Market challenges
  • Market trends
  • Five forces analysis

Quantitative

  • Market size and forecast
  • Market segmentation
  • Geographical insights
  • Competitive landscape

Interested in this report?

Get your sample now to see our research methodology and insights!

Download Now

Frequently Asked Questions

Slimming Tea market growth will increase by USD 7355.7 million during 2026-2030.

The Slimming Tea market is expected to grow at a CAGR of 4.6% during 2026-2030.

Slimming Tea market is segmented by Product (Green tea, Herbal tea, Others) Distribution channel (Offline, Online) Application (Weight loss, Detoxification, Appetite suppression)

Adagio Teas, AriZona Beverages USA LLC, Associated British Foods Plc, Barrys Tea, Crazy Cups, Dilmah Ceylon Tea Co. Plc, Harney and Sons Fine Teas, ITO EN Ltd., Lipton Teas and Infusions, Mariage Freres, Organic India USA LLC, Sancha Tea Boutique, Steven Smith Teamaker, Tata Consumer Products Ltd., The Hain Celestial Group, The Mark T. Wendell Tea Co., The Republic of Tea Inc., The Tea Shelf, The Tea Spot are a few of the key vendors in the Slimming Tea market.

APAC will register the highest growth rate of 45.4% among the other regions. Therefore, the Slimming Tea market in APAC is expected to garner significant business opportunities for the vendors during the forecast period.

China, India, Japan, South Korea, Australia, Indonesia, US, Canada, Mexico, Germany, UK, France, Italy, Spain, The Netherlands, Saudi Arabia, UAE, Turkey, South Africa, Nigeria, Brazil, Argentina, Colombia

  • Increasing global health consciousness and concerns over obesity is the driving factor this market.

The Slimming Tea market vendors should focus on grabbing business opportunities from the Product segment as it accounted for the largest market share in the base year.
RIA - Research AI Assistant
Ask RIA