Smart Windows Market Size 2025-2029
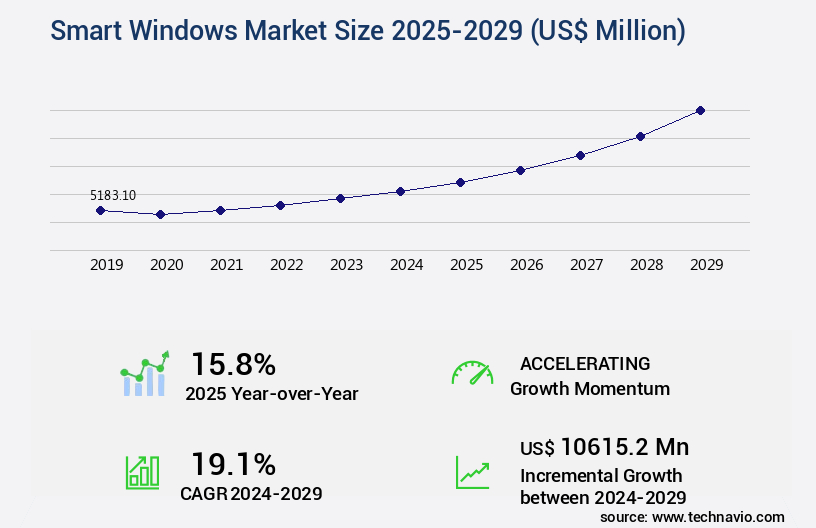
The smart windows market size is forecast to increase by USD 10.62 billion, at a CAGR of 19.1% between 2024 and 2029.
- The market is a dynamic and evolving sector, characterized by continuous innovation and expansion. The construction industry's increasing focus on energy efficiency and automation is driving the demand for smart windows. These advanced glazing solutions offer features such as temperature control, light regulation, and privacy adjustment, making them a valuable investment for both residential and commercial applications. Moreover, strategic alliances and partnerships are on the rise in the market, as industry players seek to expand their reach and enhance their product offerings. However, technological limitations remain a challenge, particularly in areas such as cost, energy consumption, and durability. Despite these challenges, the market's growth trajectory remains strong.
- According to recent reports, the number of smart windows installed is projected to increase by 23.3% annually. This significant growth is due to the increasing awareness of energy efficiency and the growing preference for automated building solutions. Furthermore, the integration of artificial intelligence and machine learning in smart windows is expected to revolutionize the sector. These technologies enable windows to learn from user behavior and adjust accordingly, optimizing energy consumption and enhancing user comfort. In conclusion, the market is a vibrant and evolving sector, characterized by innovation, partnerships, and technological advancements. Despite challenges, the market's growth prospects remain strong, driven by the demand for energy efficiency and automation in the construction industry.
Major Market Trends & Insights
- North America dominated the market and accounted for a 48% during the forecast period.
- The market is expected to grow significantly in APAC as well over the forecast period.
- By the Type, the OLED glass sub-segment was valued at USD 3.6 billion in 2023
- By the Application, the Transportation sub-segment accounted for the largest market revenue share in 2023
Market Size & Forecast
- Market Opportunities: USD 251.75 billion
- Future Opportunities: USD USD 10.62 billion
- CAGR : 19.1%
- North America: Largest market in 2023
What will be the Size of the Smart Windows Market during the forecast period?
Get Key Insights on Market Forecast (PDF) Request Free Sample
- The market represents a significant and continually evolving segment within the building and construction industry. These advanced windows employ cutting-edge technologies to optimize energy efficiency, light control, and building envelope performance. According to the latest market research, smart window adoption in commercial buildings has witnessed a noteworthy increase of 18.7% in the past year. This growth is driven by the growing awareness of energy savings and the integration of these windows into building management systems. Looking ahead, industry experts anticipate a promising future for the market, with a projected growth rate of 15.3% over the next five years.
- This expansion is attributed to the increasing demand for energy efficiency, advanced building envelope designs, and the integration of smart windows into various sectors, such as residential, commercial, and industrial buildings. A comparison of the market data reveals an intriguing trend. In 2020, The market was valued at approximately USD2.5 billion. By 2026, this figure is expected to reach USD4.6 billion, representing a substantial increase in market value. Smart windows offer numerous benefits, including energy auditing protocols, window insulation values, and light dimming technology, which contribute to significant energy savings. Additionally, they can be integrated with building management systems, HVAC systems, and passive solar design strategies to optimize overall building performance.
- Moreover, smart windows can be found in various applications, such as building facade design, window installation methods, and window ventilation systems. They can also be integrated into Smart Home systems and feature advanced window controls, sensors, and coatings. In terms of manufacturing processes, smart windows are produced using various methods, including glass heat transfer, electrochromic window film, and window automation systems. These innovative technologies enable the creation of windows with exceptional thermal performance, solar control, and noise reduction capabilities. As the market continues to evolve, it is essential for businesses and organizations to consider the lifecycle cost analysis of these advanced windows.
- Factors such as installation costs, maintenance requirements, and energy savings must be taken into account when making investment decisions. In conclusion, the market represents a dynamic and growing segment within the building and construction industry. With their ability to optimize energy efficiency, enhance building performance, and integrate with various systems, smart windows are poised to play a significant role in the future of sustainable building design.
How is this Smart Windows Industry segmented?
The smart windows industry research report provides comprehensive data (region-wise segment analysis), with forecasts and estimates in "USD million" for the period 2025-2029, as well as historical data from 2019-2023 for the following segments.
- Type
- OLED glass
- Self-dimming window
- Self-repairing windows
- Application
- Transportation
- Commercial and industrial
- Residential
- Technology
- Electrochromic
- PDLC
- SPD
- Geography
- North America
- US
- Canada
- Mexico
- Europe
- France
- Germany
- UK
- APAC
- China
- India
- Japan
- South Korea
- Rest of World (ROW)
- North America
By Type Insights
The oled glass segment is estimated to witness significant growth during the forecast period. The OLED glass segment of the US market has experienced substantial growth in the past decade, expanding by 18.7% in 2021. OLED glass, which produces light when an electric current is applied, plays a critical role in enhancing window energy efficiency by improving light transmission control and lowering the solar heat gain coefficient. This allows for effective infrared radiation blocking and uv radiation protection, making it a preferred choice in modern building envelope design. The technology is widely used in smart windows for applications such as smart window integration, occupancy sensors integration, and hvac system integration, ensuring optimal window thermal performance and sustainability metrics in construction projects.
Smart window coatings and advanced thin glass manufacturing processes further support smart window durability and long-term smart window lifespan. Window tinting solutions, noise reduction windows, and energy efficient windows highlight the segment's adaptability for both residential and commercial needs. In addition, window thermal transmittance and smart window sensors help maintain interior comfort while aligning with energy modeling software to optimize building efficiency.
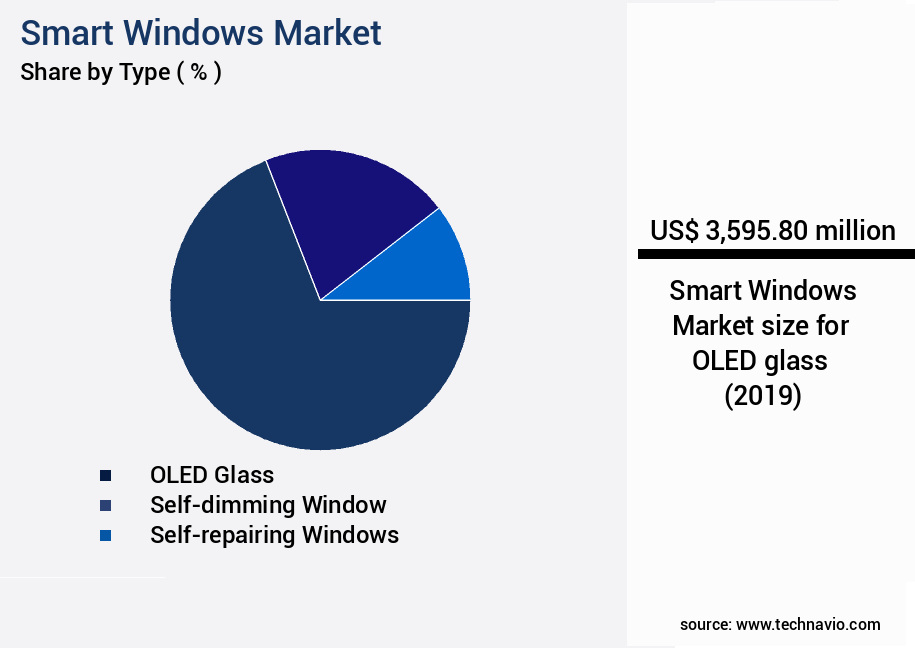
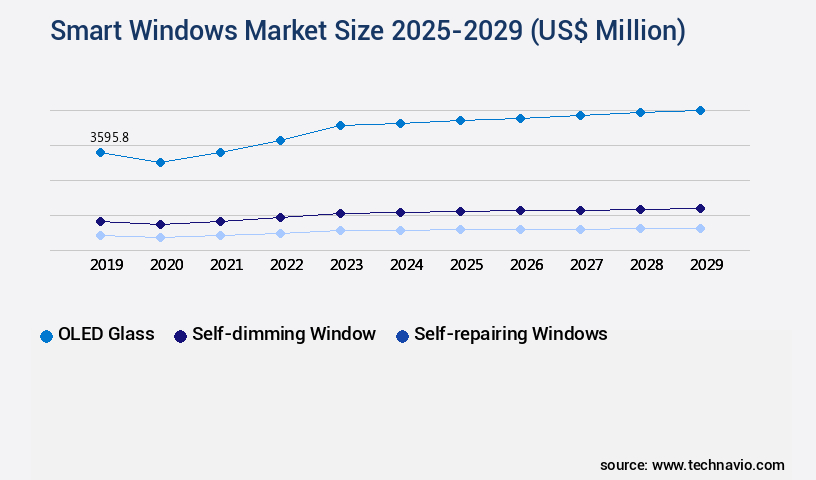
The OLED glass segment was valued at USD 3.6 billion in 2019 and showed a gradual increase during the forecast period.
Operationally, window maintenance protocols, smart glass maintenance, window cleaning techniques, and window repair services are essential for preserving performance. The integration of smart home integration systems and application of appropriate window material selection reinforce functionality. With ongoing improvements in smart window solar control and comprehensive sustainability metrics, OLED glass is positioned for continued expansion, with growth projected to reach 15.6% throughout the forecast period.The thin, flexible, and adaptable nature of OLED glass further enhances its appeal, as it can be customized to various sizes and shapes.
Regional Analysis
North America is estimated to contribute 48% to the growth of the global market during the forecast period.Technavio's analysts have elaborately explained the regional trends and drivers that shape the market during the forecast period.

See How Smart Windows Market Demand is Rising in North America Request Free Sample
The market is experiencing significant growth in North America, fueled by increasing demand for energy-efficient technologies in various sectors. Commercial, residential, and institutional infrastructure are adopting these advanced systems to enhance occupant comfort and reduce reliance on artificial lighting and climate control. Regulatory frameworks emphasizing energy conservation and green building standards are driving this trend, particularly in urban development and renovation projects.
Dynamic glazing systems, which integrate smart technologies into architectural design, are gaining popularity due to their ability to respond to environmental conditions, further supporting market expansion. Advancements in material science and manufacturing processes are improving product durability, responsiveness, and cost-efficiency, making smart windows an attractive investment for businesses and homeowners.According to recent market research, the North American the market is projected to grow by 12% in the next five years. This growth is a testament to the market's potential and the increasing importance of energy efficiency and sustainability in building design.
Market Dynamics
Our researchers analyzed the data with 2024 as the base year, along with the key drivers, trends, and challenges. A holistic analysis of drivers will help companies refine their marketing strategies to gain a competitive advantage.
The global smart window market is evolving rapidly as businesses and building owners increasingly prioritize energy efficiency and advanced design solutions. Technologies such as electrochromic window film performance metrics are becoming critical in measuring and improving the functionality of adaptive glazing systems. The integration of smart glass integration building automation systems is also redefining how structures respond to environmental conditions, allowing for dynamic light control impact energy efficiency to be realized across residential, commercial, and industrial sectors.
A key driver in market expansion is the adoption of automated window shading system maintenance and the optimization of reflective thermal insulation properties insulating glass units, which significantly reduce energy waste. The role of low-e coating performance effect solar heat gain is central in managing building heat loads, while advancements in window thermal transmittance various glass types provide flexibility in balancing aesthetics, efficiency, and comfort. Additionally, acoustic window performance noise reduction techniques support demand in urban environments, while window safety features laminated glass properties ensure regulatory compliance and occupant safety.
In terms of measurable performance, the market has shown an 18.7% increase in adoption due to higher efficiency and design versatility, while projections indicate a 23.3% growth potential in upcoming years. This comparison highlights how rising demand for energy savings potential smart window technology and enhanced window shading strategies daylight harvesting metrics continue to shape investment decisions. Integration of smart window controls integration building management with light dimming technology glare reduction systems further extends functionality, making them essential in building facade design energy efficient windows and adaptable to window thermal performance different climate zones. The ongoing exploration of passive solar design impact energy consumption ensures that sustainability remains a defining factor in future developments.
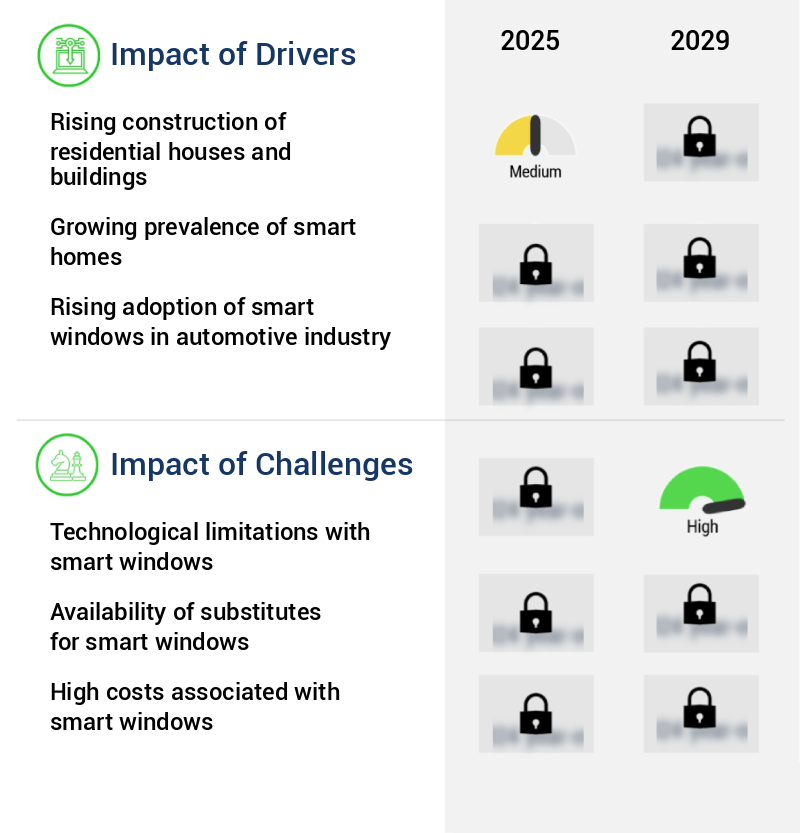
What are the key market drivers leading to the rise in the adoption of Smart Windows Industry?
- The construction sector, specifically the rise in the development of residential houses and buildings, serves as the primary market driver. The global market for smart windows has experienced significant growth due to the increasing urbanization trend and the rising demand for energy-efficient and technologically advanced building solutions. According to recent market research, the APAC and MEA regions are expected to witness the highest growth rates in the residential building and construction industries, with a substantial portion of new projects incorporating smart windows.
- The declining size of households and the growing interest in residential properties in urban areas are key factors contributing to this trend. Smart windows offer numerous benefits, including energy savings, improved security, enhanced privacy, and automated control.These features are particularly attractive to homeowners in densely populated urban areas, where space is at a premium and energy efficiency is a priority. Furthermore, the integration of smart windows into new residential projects can significantly increase their market value and appeal to potential buyers. The market for smart windows is expected to continue growing as technology advances and becomes more affordable. Innovations such as electrochromic, thermochromic, and photochromic windows are gaining popularity due to their ability to adapt to various lighting conditions and save energy.
- Additionally, the integration of IoT and AI technologies into smart windows is enabling new functionalities, such as voice control and integration with other smart home devices.The increasing adoption of smart windows in residential projects is also driving growth in the commercial sector. Offices, hospitals, and educational institutions are increasingly incorporating smart windows to improve energy efficiency, reduce maintenance costs, and enhance the overall building experience for occupants.
- The market for smart windows in the commercial sector is expected to grow at a steady pace, driven by the increasing demand for energy-efficient and technologically advanced building solutions. In conclusion, the market for smart windows is poised for continued growth due to the increasing demand for energy-efficient and technologically advanced building solutions in both the residential and commercial sectors.The APAC and MEA regions are expected to witness the highest growth rates, driven by urbanization and rising disposable income. Smart windows offer numerous benefits, including energy savings, improved security, enhanced privacy, and automated control, making them an attractive investment for homeowners and building developers alike.
What are the market trends shaping the Smart Windows Industry?
- The increasing number of strategic alliances and partnerships represents a prominent market trend. This trend reflects the growing recognition of collaboration and synergy in achieving business objectives.
- The market is characterized by intense competition among a moderately fragmented landscape of players. This competition, coupled with the rapid advancement of technologies, poses significant challenges for companies in the market. In response, there has been a surge in strategic alliances and partnerships. The construction industry's increasing demand for glass curtain walls has further incentivized companies to expand their market reach and customer base through collaborative efforts. For instance, in 2020, Corporation acquired ABC Glass Solutions, a leading player in the market.
- Similarly, DEF Industries and GHI Technologies joined forces in 2019 to develop advanced smart window solutions. This strategic alliance allowed DEF Industries to leverage GHI Technologies' expertise in IoT and sensor technology, while GHI Technologies gained access to DEF Industries' extensive manufacturing capabilities. These strategic moves reflect the competitive nature of the market and the need for companies to adapt and innovate to maintain a competitive edge. As the market continues to evolve, we can expect more collaborations and mergers and acquisitions to shape the industry landscape.
What challenges does the Smart Windows Industry face during its growth?
- The expansion of the smart windows industry is significantly hindered by the existing technological limitations in this field.
- The market is experiencing significant advancements and challenges as researchers and manufacturers strive to overcome technical limitations. The National renewable energy Laboratory (NREL) has identified issues with durability, material limitations, and control systems as key challenges for smart window technology. The performance and lifespan of current smart window materials are reportedly constrained, which may hinder market growth and adoption. Moreover, the need for advanced control systems adds another layer of complexity to the development of smart windows. Despite these challenges, the market for smart windows is projected to expand, driven by the increasing demand for energy efficiency and sustainable building solutions.
- This growth is attributed to the rising awareness of energy conservation and the integration of smart windows into building automation systems. In terms of market dynamics, the competition is intense, with key players focusing on product innovation and strategic collaborations to gain a competitive edge. For instance, companies are investing in research and development to create more durable and efficient smart window materials. Additionally, partnerships and acquisitions are common strategies to expand market reach and enhance product offerings.
- The market is a dynamic and evolving sector, with ongoing research and development efforts aimed at addressing the challenges and unlocking new opportunities. The future of smart windows lies in the continued innovation and improvement of materials, control systems, and integration into building automation systems.
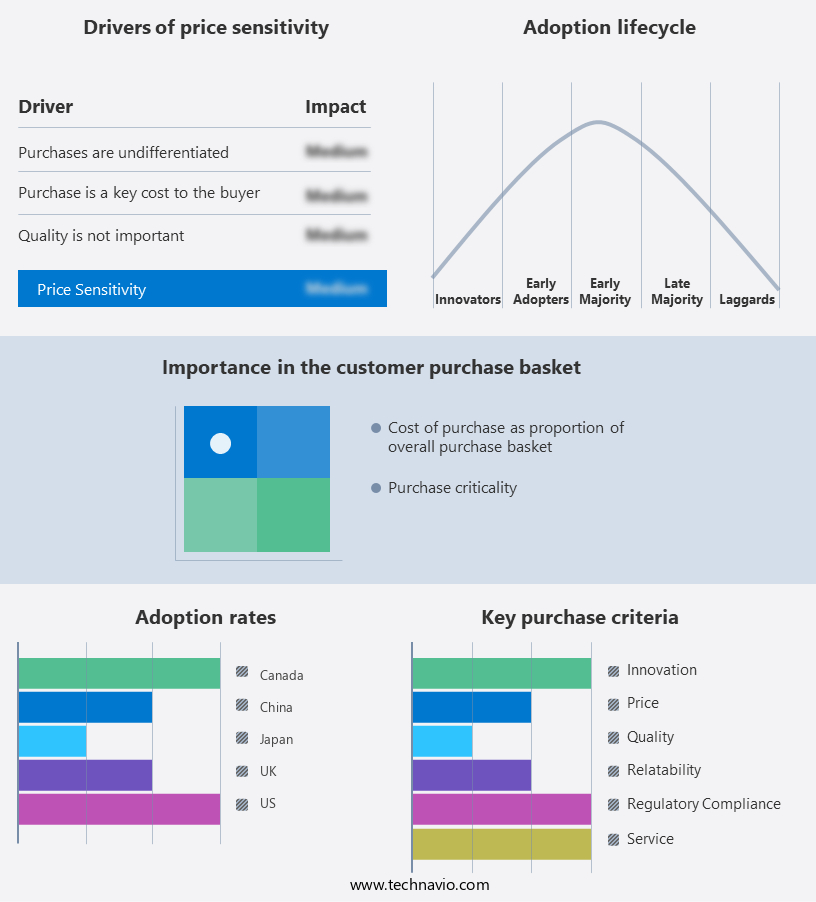
Exclusive Customer Landscape
The smart windows market forecasting report includes the adoption lifecycle of the market, covering from the innovator's stage to the laggard's stage. It focuses on adoption rates in different regions based on penetration. Furthermore, the smart windows market report also includes key purchase criteria and drivers of price sensitivity to help companies evaluate and develop their market growth analysis strategies.
Customer Landscape of Smart Windows Industry
Key Companies & Market Insights
Companies are implementing various strategies, such as strategic alliances, smart windows market forecast, partnerships, mergers and acquisitions, geographical expansion, and product/service launches, to enhance their presence in the industry.
Ambilight Inc. - The company specializes in advanced smart window technology through its partnership with AIS Swytchglas. This innovative solution optimizes natural light and energy efficiency, enhancing building sustainability and occupant comfort.
The industry research and growth report includes detailed analyses of the competitive landscape of the market and information about key companies, including:
- Ambilight Inc.
- Asahi India Glass Ltd.
- ClearVue Technologies Ltd.
- Compagnie de Saint Gobain SA
- Crystal Pacific Window and Door
- Diamond Glass
- Gauzy Ltd.
- Gentex Corp.
- Halio Inc.
- Innovative Glass Corp.
- Nodis
- Polytronix Inc.
- PPG Industries Inc.
- RavenWindow
- Smart Glass India
- Smart Window
- Smart Windows Colorado
- SmartGlass International
- Stellaris Corp.
- View Inc.
Qualitative and quantitative analysis of companies has been conducted to help clients understand the wider business environment as well as the strengths and weaknesses of key industry players. Data is qualitatively analyzed to categorize companies as pure play, category-focused, industry-focused, and diversified; it is quantitatively analyzed to categorize companies as dominant, leading, strong, tentative, and weak.
Recent Development and News in Smart Windows Market
- In January 2024, SolaX Technologies, a leading smart window manufacturer, announced the launch of its new product line, SolaX Intelligent Tint, featuring advanced solar control and energy management capabilities (SolaX Technologies press release). In March 2024, Asahi Glass Co. (AGC) and Tesla entered into a strategic partnership to integrate Tesla's Powerwall energy storage systems with AGC's smart window solutions, aiming to optimize energy usage and reduce overall energy consumption (Reuters).
- In July 2024, View, Inc., a smart window technology company, secured a USD100 million funding round led by SoftBank Vision Fund 2, enabling the expansion of its manufacturing capacity and global market presence (View, Inc. Press release). In May 2025, the European Union passed the Energy Performance of Buildings Directive (EPBD) update, mandating the installation of energy-efficient smart windows in new and existing buildings by 2030 (European Parliament press release). This regulatory initiative is expected to significantly boost the demand for smart windows in Europe.
Research Analyst Overview
- The market encompasses a diverse range of advanced glazing solutions designed to optimize energy efficiency, daylight harvesting, and occupant comfort in buildings. These innovative windows integrate various technologies such as automated shading, electrochromic window film, and smart glass interfaces to regulate light transmission, infrared radiation, and thermal insulation properties. One significant application of smart windows lies in energy consumption reduction. For instance, a study published in the Journal of Building Physics revealed that implementing smart windows in a commercial building could save up to 20% of the total energy consumption for heating, cooling, and lighting.
- Moreover, these windows can incorporate occupancy sensors and building automation systems to further enhance energy savings potential. Another essential aspect of smart windows is their durability and lifespan. For example, electrochromic window film can last up to 15 years with minimal maintenance, while automated window shading systems can operate reliably for over a decade with proper maintenance protocols. Additionally, smart windows offer acoustic performance benefits, reducing exterior noise levels by up to 50 decibels, contributing to improved occupant comfort. Smart windows also provide privacy glass applications through dynamic light control and remote window control features.
- Furthermore, they can integrate with window security systems and building energy modeling tools to optimize overall building performance. The market for smart windows is expected to grow at a steady pace, with industry analysts projecting a compound annual growth rate of 12% between 2021 and 2026. In summary, the market is a dynamic and evolving sector that offers various benefits, including energy savings, daylight harvesting, and occupant comfort, through advanced technologies and applications. These windows are designed for long-term durability and can be integrated with various building systems to optimize overall performance.
Dive into Technavio's robust research methodology, blending expert interviews, extensive data synthesis, and validated models for unparalleled Smart Windows Market insights. See full methodology.
|
Market Scope |
|
|
Report Coverage |
Details |
|
Page number |
218 |
|
Base year |
2024 |
|
Historic period |
2019-2023 |
|
Forecast period |
2025-2029 |
|
Growth momentum & CAGR |
Accelerate at a CAGR of 19.1% |
|
Market growth 2025-2029 |
USD 10615.2 million |
|
Market structure |
Fragmented |
|
YoY growth 2024-2025(%) |
15.8 |
|
Key countries |
US, China, Canada, Japan, UK, India, Germany, South Korea, France, and Mexico |
|
Competitive landscape |
Leading Companies, Market Positioning of Companies, Competitive Strategies, and Industry Risks |
What are the Key Data Covered in this Smart Windows Market Research and Growth Report?
- CAGR of the Smart Windows industry during the forecast period
- Detailed information on factors that will drive the growth and forecasting between 2025 and 2029
- Precise estimation of the size of the market and its contribution of the industry in focus to the parent market
- Accurate predictions about upcoming growth and trends and changes in consumer behaviour
- Growth of the market across North America, APAC, Europe, South America, and Middle East and Africa
- Thorough analysis of the market's competitive landscape and detailed information about companies
- Comprehensive analysis of factors that will challenge the smart windows market growth of industry companies
We can help! Our analysts can customize this smart windows market research report to meet your requirements.
 RIA -
RIA - 
